Industrial Engineering Letters ISSN 2224-6096 (print) ISSN 2225-0581 (online) Vol 2, No.6, 2012
www.iiste.org
Root cause detection of call drops using feedforward neural network K R Sudhindra* V Sridhar People’s Education Society College of Engineering, Mandya 571401, India * E-mail of the corresponding author:
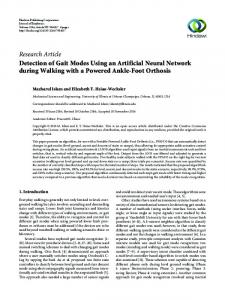
[email protected] Abstract Call drop rate in GSM (Global System for Mobile Communication) network is an important key performance indicator (KPI) that directly affects customer satisfaction. The delay in identification of exact call drop reason because of multiple reasons involved in it would results in poor customer satisfaction. The TCH (traffic channel) call drops due to three different hardware causes are collected from live GSM network for 10 days and are represented in time domain. Time domain features such as mean, maximum, standard deviation etc. are extracted from each type of call drop signal which is used to train the feedfoward neural network. FF neural network is made as decision making classifier, feature vector is inputted and root cause detection information is outputted. Keywords: TCH call drops, neural network, GSM 1. Introduction TCH (Traffic channel) drop rate is one of the major KPI that affect the performance of live GSM network. The TCH drop is the abrupt disconnection of call after traffic channel is allocated. The multiple causes of call drops in live network will delay the process of call drop detection and its elimination from the network which will result in poor customer satisfaction. The relation of call drops with handover and its effects on performance is exclusively discussed in (Wahida Nasrin and Md Majharul Islam, 2009). The effect of user mobility on call drops in live GSM network considering different patterns for user mobility was discussed in (A.G. Spilling and A.R. Nix, 2000). The influence on handover failures on TCH call drops for different types of calls are discussed in (D.Lam, D.C Cox and J.Widom,1997).In [A. Kolonits,1997] the lognormal hypothesis for distribution of the call holding time of both the normally terminated and the abnormal dropped calls has been studied. The phenomena of TCH call drops have been classified, verifying that handover failure become negligible in a well-established cellular network. All the previous works implicitly assumes that proper radio planning has been done and there is no equipment failure or network outage. In live network there are multiple causes for call drops identifying of which requires rich hands on experience on the network. In many cases root cause detection of call drops will consume lot of time which results in customer dissatisfaction. A novel method of root cause detection of TCH call drops using artificial neural network is discussed in this paper. 2. Methodology Root cause detection of TCH call drop based on feed forward (FF) neural network using Levenberg-Marquardt training algorithm is designed. The block diagram of proposed system is shown in Figure 1. The TCH call drop trends due to three different hardware causes are collected for 10 days and are represented in time domain. The next step is to extract features from the signal representing TCH call drops and construct eigenvector for each cause using extracted features. FF neural network is made as decision making classifier, signal eigenvector is inputted and root cause detection information is outputted.
25
Industrial Engineering Letters ISSN 2224-6096 (print) ISSN 2225-0581 (online) Vol 2, No.6, 2012
www.iiste.org
Figure 1. Block diagaram of root cause detection of TCH call drops 2.1Time domain representation of TCH call drops The three major BTS hardware faults such as HDLC (High Level Data Link Control) communication between CMB (control and maintenance board) and FUC(frame unit control) broken, Abis control link broken alarm and PA(Power Amplifier) forward Power (3 db) alarm contributed for call drops in live network are considered for study in the proposed system. The TCH call drops due to three different causes are collected for duration of 10 days with a sampling time of 15 minutes and are represented in time domain as shown in Figure 2 to Figure 4. The time domain representation TCH call drops shows unique characteristics for different hardware faults which are significant finding that is used for feature extraction required for root cause identification. These data is used as input for proposed root cause detection system.
Figure 2. HDLC Communication between CMB and FUC broken
26
Industrial Engineering Letters ISSN 2224-6096 (print) ISSN 2225-0581 (online) Vol 2, No.6, 2012
www.iiste.org
Figure 3. Abis control link broken alarm
Figure 4. PA Forward Power (3 db) alarm
2.2 Feature Extraction Five feature parameters such as mean, minimum, maximum, standard deviation, variance and signal power are determined for each signal sample and standard feature vector is constructed for each fault type. Euclidean distance of every two feature vectors can be calculated with the Euclidean distance formula and then compare the size of the Euclidean distances. If Euclidean distances are significantly different and balanced between them, then feature vectors are ideal (Yanhua Zhang and Lu Yang, 2010). These feature vectors are used for fault detection.
27
Industrial Engineering Letters ISSN 2224-6096 (print) ISSN 2225-0581 (online) Vol 2, No.6, 2012
www.iiste.org
2.3 Root cause detection of call drops using feedforward neural network Three layer feedforward artificial neural network (ANN) which is used in the proposed model is discussed in this section. Computation nodes are arranged in layers and information feeds forward from layer to layer via weighted connections as illustrated in Figure 5. Circles represent computation nodes (transfer functions), and lines represent weighted connections. The bias threshold nodes are represented by squares. Mathematically, the typical feedforward network can be expressed as shown in equation (1).
yi = Φ o [CΦ h (Bui + bh ) + bo ]
(1)
Figure 5. Three layer feed forward neural network Where yi is the output vector corresponding to input vector ui , C is the connection matrix ( matrix of weights) represented by arcs( the lines between two nodes) from the hidden layer to the output layer. B is the connection matrix from the input layer to the hidden layer, and bh and bo are the bias vector for the hidden and output layer, respectively, Φh (·) and Φo (·) are the vector valued function corresponding to the activation(transfer) functions of the nodes in the hidden and output layers, respectively. Thus, feedforward neural network models have the general structure of equation (2).
yi = f (u )
(2)
where f(·) is a nonlinear mapping. The continuous activation functions allow for the gradient based training of multilayer networks [.K. Mohamad, S. Saon, M.H. Abd Wahab et al., 2008]. Various learning algorithms were developed and only a few are suitable for multilayer neuron networks. Levenberg-Marquardt (LM) (Magali R. G. Meirele and Paulo E. M. Almeida, 2003) learning is used in the proposed model of root cause detection of call drops. TCH call drops due to three types of causes are collected for 10 days from OMC and used to construct feature vector for training the neural network. Six unique group of feature vector from each type of signal are constructed. 18 groups of data that are obtained are used as training sample to be inputted into network to train the network. In addition feature vectors are also constructed as detecting sample to test whether the network is working as per design. The specific structure of FF neural network consist ‘15’ neurons at hidden layer and ‘3’ neurons at output layer. Hyperbolic secant S-transfer function “tansig” is adopted as transfer function of hidden layer and linear transfer
28
Industrial Engineering Letters ISSN 2224-6096 (print) ISSN 2225-0581 (online) Vol 2, No.6, 2012
www.iiste.org
function “purelin” is adopted as transfer function of output layer. Levenberg-Marquardt BP training function is adopted as network training function whose performance index is “mse” and training target is 0.01. After training, the neural network can be given problems that are similar to the ones that it was trained on and it would make decisions about the data that it is currently processing. 3. Results and discussion Five feature parameters such as mean, maximum, standard deviation, variance and signal power are found using TCH call drop time series signal and used as feature vector for fault detection. Table 1 shows the characteristics parameters of TCH call drop time series signal. Table 1. Characteristics parameters of TCH call drop time series signal
Sl. No.
1
2 3
Fault Type HDLC Communication between CMB FUC broken Abis Control broken
and link
PA forward power (3 dB) alarm
Mean
Max
Std
Var
Power
0.97
34.00
3.10
10.00
13
0.59
14.00
1.14
1.13
0.93
0.62
23.00
1.60
2.60
2.48
Root cause codes for HDLC communication between CMB and FUC broken (type1), Abis control link broken alarm (type2) and PA forward Power (3 db) faults (type 3) are designed in Table 2. Part of training samples is shown in Table 3. LM algorithm is used to train the feed forward neural network. Network training error curve is shown in figure 6. Table 2. Fault type code design
Parameters Flaw codes
Fault Types Type-1
Type-2
Type-3
001
010
100
29
Industrial Engineering Letters ISSN 2224-6096 (print) ISSN 2225-0581 (online) Vol 2, No.6, 2012
www.iiste.org
Table 3. Training Sample Fault codes for input vector
U2
Input Vectors U3 U4
U5
0.971
34
3.107
9.476
13.780
100
1.060
42
1.484
3.534
7.070
100
Type-1
1.822
13
3.077
9.473
20.803
100
Type-1
1.414
20
3.280
10.790
25.94
100
Type-1
0.945
32
3.201
10.24
11.66
100
Type-1
1.240
51
3.801
14.400
13
100
Type-2
0.589
14
0.934
1.140
0.93
010
Type-2
0.523
16
1.260
1.611
1.128
010
Type-2
0.714
17
1.618
2.618
2.123
010
Type-2
0.669
17
1.223
1.49
1.180
010
Type-2
0.228
7
0.681
0.464
0.473
010
Type-2
0.363
13
1.013
1.021
0.534
010
Type-3
0.514
59
2.078
4.319
4.120
001
Type-3
0.547
22
1.446
2.091
1.648
001
Type-3
1.036
21
2.439
6.041
9.610
001
Type-3
1.170
21
2.144
4.591
6.840
001
Type-3
0.417 0.640
23 10
1.700 1.130
2.653 1.270
2.482 1.96
001
Fault Types
U1
Type-1 Type-1
Type-3
001
Figure 6. Train Error curve
From Figure 6 we observed that final mean-square error is small, the test set error and the validation set error have similar characteristics and no significant overfitting has occurred by iteration ‘3’ where the best validation performance occurs. In order to verify the accuracy of network, test samples with a total of ‘9’ sets of data are used to test network model and test results are shown in table 4. From table 4 it is found that the actual output of network is accordance with expectation output.
30
Industrial Engineering Letters ISSN 2224-6096 (print) ISSN 2225-0581 (online) Vol 2, No.6, 2012
www.iiste.org
Table 4 Sample test results Fault Types
Input Vectors U1
U2
U3
U4
U5
Expected outputs
Actual outputs
Results
Type-1
0.9
34
3.1
10
13
100
0.9992
-0.0003
Type-1
0.8
32
3.1
9
12
100
0.9994
-0.0003
0.0004 0.0003
Type-1
0.7
28
2.7
12
13
100
0.9999
-0.0001
0.0002
correct
Type-2
0.5
14
0.14
1.13
0.93
010
-0.0268
0.8323
0.1885
correct
Type-2
0.6
12
1.12
2.87
1.12
010
0.0013
1.0014
0.0005
correct
Type-2
0.4
13
0.13
2.14
4.12
010
0.0008
1.0023
-0.002
correct
Type-3
0.6
23
1.57
3.61
2.48
010
0.0019
0.0012
0.9997
correct
Type-3
0.7
22
1.63
2.7
2.48
010
0.0020
0.0015
1.0000
correct
Type-3
0.6
24
1.61
4.3
2.23
010
-0.0009
-0.1082
1.1023
correct
correct correct
4. Conclusions The time series representation of TCH call drops shows unique characteristics for different hardware faults. These characteristics help to extract time domain features and construct Eigen vector for identifying root cause of call drops. Root cause detector of TCH call drops using feedforward neural network is designed and LM algorithm is used to train the network from the constructed feature vectors. The efficiency of the network can be improved by training the network with large number of samples. 5. Acknowledgment The authors would like to thank IDEA Cellular Ltd, Bangalore to have made possible the access to the data used for this study. References Wahida Nasrin, Md Majharul Islam Rajib,“An analytical approach to enhance the capacity of GSM frequency hopping networks with intelligent Underlay-overlay” Journal of communication, Vol 4,No. 6, July 2009. A.G. Spilling and A.R. Nix, “Performance enhancement in cellular networks with dynamic cell sizing” IEEE PIMRC 2000. D.Lam,D.C Cox and J.Widom “Teletraffic modeling for personal communication services” IEEE communications Magazine, Vol. 35, No. 2, Feb 1997,pp 79-87. A. Kolonits, “Evaluating the Potential of Multiple Re-Use Patterns for Optimizing Existing Network Capacity” IIR Maximizing Capacity Workshop, London, June 1997. Yanhua Zhang, Lu Yang et al., “ Study of feature extraction and classification of ultrasonic flaw signals” WSEAS Trans. On Mathematics, issue 7, Vol. 9, July 2010. A.K. Mohamad, S. Saon, M.H. Abd Wahab et al.,” Using Artificial Neural Network to monitor and predict induction motor bearing (IMB) failure”International Engineering Convention, Jeddah, Saudi Arabia, 10-14, March, 2008. Magali R. G. Meireles, Paulo E. M. Almeida et al. “A Comprehensive Review for Industrial Applicability of Artificial Neural Networks” IEEE Tran. on Industrial Electronics, Vol. 50. NO. 3, June 2003, 585.
31
Industrial Engineering Letters ISSN 2224-6096 (print) ISSN 2225-0581 (online) Vol 2, No.6, 2012
www.iiste.org
K R Sudhindra received Bachelor of Engineering degree in Electroncs and communication from Mysore University, India in 1999 and M.Sc ( Engg). by research in faculty of Electrical Engineering sciences from Visvesvaraya Technological University, India in 2007. He is currently a Ph.D student of Department of Electronics and Communication Engineering, PESCE, Karnataka, India. He has total 5 years of experience in Telecom Industry. His research interests include operational research, signal processing & wireless communication. V Sridhar has obtained his Ph.D from Indian Institute of Technology (IITD), New Delhi in the year 1996. He obtained his B.E (E&C) from University of Mysore in the year 1980 and M.E (Electronics & Telecommunications) from Jadavpur university, Calcutta in the year 1986. Presently he is serving as the Principal, PESCE, Mandya. He has more than 29 years of teaching, research and administrative experience.His major areas of research interest are Biomedical instrumentation, Telemedicine, VLSI Design and Mobile communication. He has to his credit more than 40 research papers in national /international journals and conferences.
32
This academic article was published by The International Institute for Science, Technology and Education (IISTE). The IISTE is a pioneer in the Open Access Publishing service based in the U.S. and Europe. The aim of the institute is Accelerating Global Knowledge Sharing. More information about the publisher can be found in the IISTE’s homepage: http://www.iiste.org The IISTE is currently hosting more than 30 peer-reviewed academic journals and collaborating with academic institutions around the world. Prospective authors of IISTE journals can find the submission instruction on the following page: http://www.iiste.org/Journals/ The IISTE editorial team promises to the review and publish all the qualified submissions in a fast manner. All the journals articles are available online to the readers all over the world without financial, legal, or technical barriers other than those inseparable from gaining access to the internet itself. Printed version of the journals is also available upon request of readers and authors. IISTE Knowledge Sharing Partners EBSCO, Index Copernicus, Ulrich's Periodicals Directory, JournalTOCS, PKP Open Archives Harvester, Bielefeld Academic Search Engine, Elektronische Zeitschriftenbibliothek EZB, Open J-Gate, OCLC WorldCat, Universe Digtial Library , NewJour, Google Scholar