Bernabo et al., J Comput Sci Syst Biol 2013, 6:4 http://dx.doi.org/10.4172/jcsb.1000117
Computer Science
Systems Biology Research Article Review Article
Open OpenAccess Access
Computational Modeling of Spermatozoa Signal Transduction Pathways: Just a Computer Game or a Reliable Tool in Studying Male Gametes Function? Nicola Bernabo*, Mauro Mattioli and Barbara Barboni Department of Comparative Biomedical Sciences, University of Teramo, Piazza Aldo Moro 45, 64100 Teramo, Italy
Abstract Mammalian spermatozoa gain their fertilizing ability only after they reside within the female genital tract, where important physical-chemical modifications, the “capacitation”, occur: the cytoskeleton reorganizes, the membranes become more instable and tend to fuse each other, the protein phosphorylation pattern changes, a new motility pattern, the hyperactivated motility, appears. These events are regulated by several signal transduction pathways, whose failure could have negative implication for fertility. Unfortunately, frequently it is impossible to issue a diagnosis, as in the case of “idiopathic infertility”. In our opinion, this inability could be not due to the scarcity of molecular data, but to the difficulty to manage them. Indeed, spermatozoa (like other cells) are constituted by heterogeneous components that interact collectively and nonlinearly, giving rise to a complex behavior in which the whole system is more than the sum of its single components. To overcome this problem, we adopted a holistic approach based on computational modeling. We represented the events occurring during human spermatozoa capacitation as a biological network of nodes (the molecules) and links (the interactions). Topological analyses of network showed that it has a scale free topology and that it is characterized by a high signaling efficiency and robustness against random failure. Interestingly, we found that the same topology is shared with other organisms, sea urchin and Caenorhabditis elegans, belonging to different Phyla and characterized by very different reproductive ecology. Further, we modelized boar sperm capacitation, separating the molecules depending on their subcellular compartment: model analysis suggested that actin cytoskeleton is not only a mechanical support, but it could participate to the coordination of the capacitation-related events. This hypothesis was, then, successfully validated in an in vitro experiment. In conclusion, from computational models it is possible to infer important information not otherwise obtainable, then improving the understanding of the spermatozoa biology complexity.
Keywords: Spermatozoa; Capacitation; Fertility; Systems biology; Biological networks; Networks topology; Scale free topology
Introduction Immediately after ejaculation, mammalian spermatozoa are unable to fertilize the oocyte. They acquire the fertilizing ability only after they reside for a time ranging from hours to days within the female genital tract [1,2]. Here, the seminal plasma is removed and male gametes are exposed to gradients of activating and inhibiting signals which establish a functional dialogue between spermatozoa and female environment involving autocrine, paracrine and endocrine factors. The goal of this process named “the capacitation” is on one hand to ensure the presence of spermatozoa able to fertilize at the right time (the ovulation) and on the other one, to avoid polyspermic fertilization by lowering the number of fertilizing male gametes [1,3]. As it is known during capacitation spermatozoa undergo deep modifications in their biochemical function and signaling machine. In particular spermatozoa membranes changes their organization either at microscopic (membrane microdomains) and at macroscopic (membrane domains) level [4-6]. The content in cholesterol gradually lowers and in parallel the relative amount of unsaturated phospholypids rises. As a consequence, the membrane anisotropy decreases and membrane fluidity progressively increases. The result of this process of membrane remodeling is the acquisition by plasma membrane (PM) and by outer acrosome membrane (OAM) of the ability to fuse each other the so called “fusogenicity”. The molecules mainly involved in control of this chain of events are bicarbonate (as activating factor) and endocannabinoids (as inhibiting factors) [7-11]. At cytosolic level the capacitation implies a gradual elevation of intercellular concentration of Ca2+ and cAMP: both acts as second J Comput Sci Syst Biol ISSN:0974-7230 JCSB, an open access journal
messengers, transducing the molecular messages from extracellular environment to the cytosolic compartment, thus promoting the activation of several signaling systems, such as the PKC, PKC, PLD– dependent pathways [12-15]. This leads to the modification of protein phosphorylation status to the enzymes activation and inhibition, and to the change in motility pattern. Indeed spermatozoa once are exposed to capacitating condition, either in physiological context or in an artificial environment, gradually acquire the hyper activated motility [16-18]. This process was first described in 1969 by Yanagimachi (Yanagimachi, 1969) who reported that the spermatozoa able to fertilize the oocyte showed a new and more vigorous swimming pattern [19]. In human, flagella of hyperactivated spermatozoa beat less symmetrical than those of ejaculated spermatozoa, thus they tend to vigorously swim in circles. It is thought that the acquisition of hyperactivated motility is functional to allow to the spermatozoa to penetrate the oviductal mucus, the cumuls-oocyte complex extracellular matrix and finally the ZP. Cytoskeleton also modifies its organization [20-22]. In particular,
*Corresponding author: Nicola Bernabo, Department of Comparative Biomedical Sciences, University of Teramo, Piazza Aldo Moro 45, 64100 Teramo, Italy, Tel: 39 0861 266858; Fax: 39 0861 266879; E-mail:
[email protected] Received June 28, 2013; Accepted August 20, 2013; Published August 27, 2013 Citation: Bernabo N, Mattioli M, Barboni B (2013) Computational Modeling of Spermatozoa Signal Transduction Pathways: Just a Computer Game or a Reliable Tool in Studying Male Gametes Function? J Comput Sci Syst Biol 6: 194-205. doi:10.4172/jcsb.1000117 Copyright: © 2013 Bernabo N, et al. This is an open-access article distributed under the terms of the Creative Commons Attribution License,which permits unrestricted use, distribution, and reproduction in any medium, provided the original author and source are credited.
Volume 6(4): 194-205 (2013) - 194
Citation: Bernabo N, Mattioli M, Barboni B (2013) Computational Modeling of Spermatozoa Signal Transduction Pathways: Just a Computer Game or a Reliable Tool in Studying Male Gametes Function? J Comput Sci Syst Biol 6: 194-205. doi:10.4172/jcsb.1000117
it has been reported that during capacitation Globular actin (G-actin) polymerizes leading to the formation of filaments (F-actin). Currently, it is thought that when fusogenicity of PM and OAM increases the developing network of F-actin, could act as a diaphragm between these membranes, thus avoiding their premature fusion. Once the capacitation was completely reached and the physiological stimulus, the Zona Pellucida (ZP) proteins of oocyte, was detected, the spermatozoa undergo a fast rise in intracellular calcium concentration. This ionic event causes the immediate depolymerisation of actin structure, thus allowing fusion of PM and OAM and ultimately Acrosome Reaction (AR).
Consequently, it is impossible to study and analyze complex systems (and among them, spermatozoa biochemical machinery) by using a reductionist approach (i.e. dissecting them in their elementary components), whereas it is necessary to take under consideration their entirety (a complex system is more than the sum of its components) and adopting new strategies [25]. In particular a promising approach is the computational modeling, which allows inferring important biological information. It poses an important question: among all the possible ones, which is the better modeling strategy to adopt?
The study of signaling systems involved in capacitation has a continuously growing importance because of its important implications both for basic (developmental biology, endocrinology, and biochemistry) and applied science (andrology, male infertility, contraception). In particular, these last aspects are of great interest, because at the present, a reliable a priori marker of sperm capacitation is unavailable [23]. As a consequence, in several cases, it is impossible for clinicians and andrologists to perform an adequate diagnosis, therapy and prognosis after seminal and clinical investigations as it is the case of unexplained infertility of male origin. It has been reported that iinfertility affects about 7% of all men and its etiology can involve factors acting at pre-testicular, post-testicular or directly at the testicular level. Primary testicular failure accounts for about 75% of all male factor infertility and despite the recent progress in clinic and medicine of reproduction its etopathology is still unknown in about 50% of cases, in which the only possible diagnosis is “idiopathic infertility” [24].
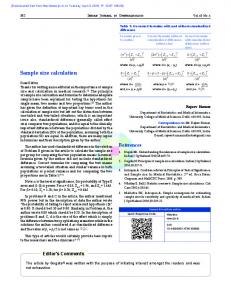
One of the most powerful and innovative computational strategy derives from mathematical concepts elaborated more that 250 years ago [26]. In 1735, Swiss mathematician and physicist Leonhard Euler used a sort of model to solve the seven bridges of Königsberg problem: the city of Königsberg in Prussia (now Kaliningrad, Russia) was set on both sides of the Pregel River (Figure 1A), and included two islands connected to each other and to the mainland by seven bridges (Figure 1B and 1C). The problem was to find a walk through the city that would cross each bridge once and only once. The islands could not be reached by any route other than the bridges, and every bridge must have been crossed completely every time. Euler for the first time represented the mainland and the islands as nodes and the bridges as edges connecting them (Figure 1D). The ensemble of nodes and edges originated a graph or a network, providing a strategy to represent a problem by an abstract object, a model, whose architecture, the network topology, could offer important information about the represented phenomenon. Using this modeling strategy Euler demonstrated that the problem had no solution and, more importantly, opened a new field of research: the networks science. More recently this branch of mathematics was applied to the study of a myriad of natural and non-natural phenomena such as the structure of human and animal societies [26,27], the dynamics of stock market [28], the architecture of world wide web and the structure of internet [29,30], the air and land transports [31], the neuronal interconnection [32-34], the architecture of cell signaling systems [35-
In response to this failure, the research effort on this topic is greatly increased in latest years. This has lead, on one hand to the increase of knowledge on molecular determinants of signal transduction pathways involved capacitation but on the other one it has not been paralleled by the increase in understanding of unexplained infertility etiology. In our opinion this could be due to the intrinsic complexity of capacitation biochemistry.
Networks Science: an Innovative Approach Dating Back More Than 250 Years Ago
Spermatozoa Signaling: an Example of Biological Complexity Biological complex systems are characterized by well defined proprieties, such as: the elements composing the system are strongly interconnected: if one of them fails, possibly all the system fails; • The links among the different system components are frequently non-linear and characterized by multiple feed-back loops; • The interaction among the elements are dynamical, thus evolves with time. In other words, prior states of system may have an influence on present states (the so called hysteresis): they have a memory; • The system components may themselves be complex systems. For instance, a cell (which is a complex system) is composed by organelles (which are complex systems), which, in turn, are composed by molecular aggregates (which are complex systems), and so on. • They display emergent behaviors, i.e. they may show new properties when they are studied at a higher or lower levels. For instance, the ability to fertilize will emerge only studying the male gametes at cellular level. J Comput Sci Syst Biol ISSN:0974-7230 JCSB, an open access journal
Figure 1: The seven bridges of Königsberg problem A) Ancient map of Königsberg, showing the city set by Pregel River. B) The seven bridges (yellow bars) in a modern picture of Kalinigrad (Google Maps) C) Abstracted model representing the mainland, the island and the bridges. D) Network modelization of the seven bridges of Königsberg problem.
Volume 6(4): 194-205 (2013) - 195
Citation: Bernabo N, Mattioli M, Barboni B (2013) Computational Modeling of Spermatozoa Signal Transduction Pathways: Just a Computer Game or a Reliable Tool in Studying Male Gametes Function? J Comput Sci Syst Biol 6: 194-205. doi:10.4172/jcsb.1000117
37], etc… All these entities share the possibility to be represented as a network of nodes linked by edges [31,32]. The node represents the element of the network [38], i.e. the atoms constituting a molecule, the molecules involved in pathways, the cells communicating each other. The link is the kind of interaction which links two different nodes, for instance in signaling transduction it could be “activation”, “inhibition”, “dimerisation”. It could be directed or undirected (Figure 2A and 2B). The most elementary characteristic of a given node is its degree (or connectivity), k, which is a measure of how many links the node has to other nodes. In directed networks there is an incoming degree, k-in, which denote the number of links that point to a node, and an outgoing degree, k-out, which denotes the number of links that start from it [39]. An undirected network with N nodes and L links is characterized by an average degree = 2L/N (where denotes the average). The degree distribution, P(k), gives the probability that a selected node has exactly k links. P(k) is obtained by counting the number of nodes N(k) with k = 1, 2… links and dividing by the total number of nodes N [39]. The distance in networks is measured with the path length, which is the measure of how many links we need to pass through to travel between two nodes. Importantly, in directed networks, the distance AB from node A to node B is often different from the distance BA from B to A. The mean path length, represents the average over the shortest paths between all pairs of nodes and offers a measure of a network overall navigability. A further important characteristic of networks is the measure of how they tend to cluster, i.e. to develop local areas of dense interconnection among nodes [40-41]. This phenomenon is quantified by the clustering coefficient: CI = 2nI / k (k − 1) where nI is the number of links connecting the kI neighbours of node I to each other. A further important parameter of the network architecture is the function C(k), which is defined as the average clustering coefficient of all nodes with k links. The average degree , average path length and average clustering coefficient depend on the number of nodes and links (N and L) in the network, whereas, the P(k) and C(k) functions are independent of the network size, and could be used to classify various kinds of networks. Indeed, in latest 50 years several scientists have studied the mathematical and topological features of networks, thus proposing some models.
Random networks A random network is obtained by connecting a set of n nodes with randomly added edges (Figure 3A). The most commonly studied models of random networks are that proposed by Edgar Gilbert, denoted G(n,p), in which every possible edge occurs independently with probability p [42], and that proposed by Paul Erdős and Alfréd Rényi, denoted G(n,M), in which it exists an equal probability of all graphs with exactly M edges (Erdős–Rényi or ER model) [43]. Two different variants of ER model are known: - the G(n, M) model, in which a graph is chosen at random from the collection of all graphs with n nodes and M edges. For example, in the G(3, 2) model, each of the three possible graphs on three vertices and two edges are included with probability 1/3. The G(n, p) model, in which a graph is realized by randomly connecting the nodes: each edge is added to the graph with a probability p, independent from every other edge. Thus, all graphs
n with n nodes and M edges have equal probability of p (1 − p ) − M 2 M
J Comput Sci Syst Biol ISSN:0974-7230 JCSB, an open access journal
Figure 2: Types of networks. A) Undirected network: the links between the nodes have no direction. B) Directed network: the links between the nodes have a direction.
Figure 3: Different classes of networks classified depending on their topology. A) Random network: each node has, on average, the same number of connections. B) Small world networks: it is possible to cross all the network by a small number of steps (for instance 4 steps to go from A to B). C) Scale free network: a few nodes are mostly connected (the hubs, in yellow) than the others. D) Hierarchical network: the most connected nodes are also the most clusterized ones (the yellow ones).
. The parameter p in this model represents a weighting function: as it increases from 0 to 1, the model becomes more and more likely to include graphs with more edges and less and less likely to include graphs with fewer edges. In particular, the case p = 0.5 corresponds n to the case where all 2 graphs on n vertices are chosen with equal 2 probability. In random networks, the node degree (i.e. the number of links per node) follows a Poisson distribution, i.e. that most of nodes have approximately the same number of links, close to the average degree,
Volume 6(4): 194-205 (2013) - 196
Citation: Bernabo N, Mattioli M, Barboni B (2013) Computational Modeling of Spermatozoa Signal Transduction Pathways: Just a Computer Game or a Reliable Tool in Studying Male Gametes Function? J Comput Sci Syst Biol 6: 194-205. doi:10.4172/jcsb.1000117
that defines the network scale. For instance, the water, at room temperature, is constituted by several cluster of molecules aggregated to form domains, due to the presence of hydrogen bonds. Each water molecule binds on average 4 other molecules, thus it is possible to represent water as a network of scale 4. The tail (high k region) of the degree distribution P(k) decreases exponentially, thus the nodes that significantly deviate from the average are extremely rare. The clustering coefficient is independent from the node degree, and the mean path length is proportional to the logarithm of the network size, l ~ log N [37]. From a biological point of view, random networks have two important features: - the network behavior strictly depends on the network scale; - random networks are democratic networks, i.e. each node concurs as all others nodes in determining network proprieties.
Small word networks Random networks fail to explain a typical phenomenon of social and biological networks: the so called “small world” effect. Indeed, in several conditions it was found that the navigability of real biological networks (i.e. the possibility to jump from a node to a other node) is greatest of that predicted by ER model. In particular, the distance of two random selected nodes tends to be shortest that expected (Figure 3B). It is the case of classical Stanley Milgram experiment, in which it was found that all the people are separated only from six step (thus originating the “six degrees of separation” myth) [44]. To take into account this phenomenon, in 1998 Duncan J. Watts and Steven Strogatz proposed a new model (known as Watts-Strogatz, WS, model) [45] which is the interpolation between an ER graph and a regular ring lattice: the underlying lattice structure of the model produces a locally clustered network, and the random links dramatically reduce the average path lengths.
Scale-free networks WS model elegantly explains important features of biological networks, which often are characterized by a small world topology, as it happens, for instance, in neuronal networks, but they are unable to describe another characteristic of these systems: the heterogeneity of node degree. Indeed, several phenomena, from the WWW connectivity to Internet architecture, from the stock market to the protein interaction networks, share the same architectural feature: the presence of a low number of highly connected nodes (defined the “hubs”) and a higher number of scarcely connected nodes (Figure 3C). In 1999 Albert Lazlo Barabási and Reka Albert proposed the so called Barabási–Albert (BA) model, which incorporates two important general concepts: growth and preferential attachment [46]. In particular, these networks are able to grow over the time, and the growth is realized by the preferential attachment of new nodes to the hubs: the more one node is connected; the more is its able to attract new connections to new nodes. New nodes are added to the network one at a time and each new node is connected to m already existing nodes with a probability that is proportional to the number of links that the existing nodes already have. Thus, the probability pi that the new node is connected to node i is: pi =
ki
∑k j
j
where ki is the degree of node i and the sum is made over all preexisting nodes j [47]. These networks are characterized by a power-law distribution of node degree, in other words, the probability that a J Comput Sci Syst Biol ISSN:0974-7230 JCSB, an open access journal
node has k links follows P(k) ~ k –γ, where γ is the degree exponent and usually ranges between 2 and 3. As a consequence, the probability that a node is highly connected is statistically higher than in a random graph, thus the network behavior is strongly determined by a small number of highly connected nodes and that a “typical” node does not exists (scale-free topology). These network do not have an inherent modularity, indeed C(k) is independent of k and they have the average path length following l ~ log log N, which is significantly shorter than log N that characterizes random networks.
Hierarchical networks Hierarchical networks belong to the scale-free networks family but are characterized by modularity and high local clustering (Figure 3D). In contrast to the BA scale-free models, in this case the clustering coefficient is a function of the node degree:
C (k ) ~ k β Several networks representing important biological entities have been found to have a hierarchical topology, such as metabolic networks or protein interaction networks [48-50].
Biological networks to explore signaling pathways of mammalian spermatozoa. Recently, biological networks-based computational models have been applied to study the signaling system of mammalian and nonmammalian spermatozoa. Male gametes are ideal candidate for this purpose because of a few important biological characteristics: - the main molecular events occurring during sperm capacitation are largely studied, thus the available information allows to build a reliable model; - the spermatozoa are able to exert their function outside the organism in which they are produced. As a consequence they are capable of independent life (unlike the other cells) and it is possible to in vitro manage them without loss of the cell function; - their maturation process can be experimentally reproduced under in vitro condition and assessed by measuring their ability to undergo AR after co incubation with homologous ZP or by the measure to in vitro fertilize the oocytes (in animal models); - their molecular composition is stable over the time, since the nucleus of male germ cells is transcriptionally silent. It has been reported only the mitochondrial protein translation of nuclearencoded proteins [51,52]. This last aspect, in particular, is very important. Indeed, in the case of male germ cells, the problem does not exist to modelize the continuous modification in cellular protein content and in molecular interactions due to the dynamical regulation of genes expression and protein transcription, as it happens in other kinds of cells. In a first study [53], since at present a database containing molecular information about the signalling events occurring during capacitation, either of human or mammal spermatozoa, is not available, a new database was realized using Microsoft Office Excel 2003, obtaining the information from peer-reviewed papers present in PubMed (www.ncbi.nlm.nih. gov/pubmed/) archive.
The database was realized as follows
Volume 6(4): 194-205 (2013) - 197
Citation: Bernabo N, Mattioli M, Barboni B (2013) Computational Modeling of Spermatozoa Signal Transduction Pathways: Just a Computer Game or a Reliable Tool in Studying Male Gametes Function? J Comput Sci Syst Biol 6: 194-205. doi:10.4172/jcsb.1000117
Interaction: it represents the nature of interaction (activation, inhibition, binding, ...). Target molecule: it represents the molecule target of the interaction. Biological function: it represents the functional meaning or the context where the interaction takes place (glycolysis, lipid remodelling, oxidative phosphorylation, …). Species: it represents the specie(s) in which the interaction was described. Reference: it represents the bibliographic source of information. Notes: it represents the entire notation such as the presence of synonyms or the intracellular location, if relevant, or the explanation of complex cellular events. In particular, the data concerning human spermatozoa of the latest 10 years were used. The freely available and diffusible molecules such as H2O, CO2, Pi, H+,O2 were omitted, when not necessary and, in some cases, the record did not represent a single molecule but complex events, such as “membrane fusion” or “protein tyrosine phosphorylation” because all the single molecular determinants of the phenomenon are still unknown. Source molecule: represents the molecule source of interaction. These data were used to build a biological network using the Cytoscape 2.6.3 software (http://www.cytoscape.org) [54] (Figure 4). The statistical and topological analyses of networks were carried out considering the networks as directed by the Cytoscape plugin Network Analyzer (http://med.bioinf.mpi-inf.mpg.de/netanalyzer/help/2.6.1/ index.html), and the following parameters have been assessed: The number of nodes: This represents the total number of molecules involved The number of edges: This represents the total number of interaction among nods within the network; The node degree (or connectivity): This indicates how many links each node has to other nodes; The node degree distribution P(k): which represents the probability that a selected node has exactly k links; The clustering coefficient: which is calculated as CI = 2nI / k (k − 1) , where nI is the number of links connecting the kI neighbours of node I to each other. It is a measure of how the nodes tend to form clusters: the more the clustering coefficient is higher, the more the presence of clusters will increase; The network diameter: This is the largest distance between two nodes; The averaged number of neighbours: This is the mean number of connection of nodes; The characteristic path length: This is the expected distance between two random individuated connected nodes. The betweenness centrality: This is a measure of node centrality in a network. It is computed as: Cb (n) = ∑ s ≠ n ≠ t (σ st (n) / σ st )
“where s and t are nodes of
J Comput Sci Syst Biol ISSN:0974-7230 JCSB, an open access journal
Figure 4: Biological network representing the molecular events occurring during human sperm capacitation. The node size is proportional to the connection number and the node color gradient, from red (higher values) to green (lower values), is dependent from the closeness centrality. This parameter is computed as: Cc(n) = 1/avg(L(n,m)), were L (n,m) is the length of the shortest path between two nodes n and m. The closeness centrality of each node ranges from 0 (light gray) to 1 (dark gray) and it is a measure of how fast the information spreads from a given node to the other nodes. The spatial network arrangement was obtained by using the Cytoscape Spring-embedded Layout. In zoom panel are shown the most connected nodes ([Ca2+]i and ATP.
the network that are different from n, σst denotes the number of shortest paths from s to t, and σst (n) is the number of shortest paths from s to t where n lies on” [55]. This parameter “reflects the amount of control that this node exerts over the interactions of other nodes in the same network”, highlighting “nodes that join communities (dense subnetworks), rather than nodes that lie inside a community” [55]. In addition, for each network, the node degree distribution law has been checked, and the exponent (γ) and the result of correlation test (r) have been reported. As a result it was found that the network topological parameters (Table 1) are in agreement with the BA model of scale free networks and that this architecture confers to it some biologically relevant features, such as: Robustness against random damage: In scale free networks only a low number of nodes is highly connected, whereas the most of them is scarcely linked. As a consequence a random perturbation will have a low probability to affect an hub of network and an high probability to involve a node with a low number of connections. Thus in the most of the cases, the network topology will be not or scarcely affected by this event. On the contrary, if a well designed attack to the network is performed (for instance removing the two most connected nodes: [Ca2+]i and ATP/ADP system) the network collapses (Figure 5). From the biological point of view this finding points out the key role of calcium and energy metabolism in acquisition of spermatozoa fertilizing ability (see above). Controllability: The presence of hubs implies that the whole system can be modulated with high efficiency by acting just on these nodes, thus reducing the energetic cost and facilitating/accelerating the spermatozoa response to modulator factors. Noteworthy, this idea is strengthened by the finding that the hubs are also the most central
Volume 6(4): 194-205 (2013) - 198
Citation: Bernabo N, Mattioli M, Barboni B (2013) Computational Modeling of Spermatozoa Signal Transduction Pathways: Just a Computer Game or a Reliable Tool in Studying Male Gametes Function? J Comput Sci Syst Biol 6: 194-205. doi:10.4172/jcsb.1000117
nodes in the network, as demonstrated by the correlation between the number of links vs. the betweenness centrality per node (r = 0.662, carried out on logrithmized data). Easy navigability: The virtual absence of clustering, the low values of the characteristic path length and of the averaged number of neighbours, confers to the network easy navigability. Indeed, each molecule interacts with the others ones through a small number of steps, as a consequence, the loss of information due to signal decrease is minimized and the signalling efficiency is maximized. It means that any local network perturbation will affect the whole cellular system in a very short time, thus increasing the responsiveness of spermatozoa to intracellular and extracellular stimuli. Interestingly, this analytical approach allows also to identify the molecules which play a key role in signalling pathways (i.e. the hubs) (Table 2): [Ca2+]i, the ATP-ADP system, the protein kynase A (PKA), the Tyr phosphorylation and phospholipase D1 (PLD1). During capacitation the [Ca2+]i increases and capacitation does not take place in the Ca2+ absence [56, 57]. In detail, Ca2+ behaves as a second messenger converting extracelluar stimuli to chemical response in a myriad of molecular system, such as, protein kynase Topological parameter Connected components
Value 1
Number of nodes
151
Number of edges
205
Clustering coefficient
Figure 5: Biological network representing the molecular events occurring during human sperm capacitation after the removal of [Ca2+]i and APT/ ADP system. The node size is proportional to the connection number and the node color gradient, from red (higher values) to green (lower values ), is dependent from the closeness centrality. This parameter is computed as: Cc(n) = 1/avg(L(n,m)), were L (n,m) is the length of the shortest path between two nodes n and m. The closeness centrality of each node ranges from 0 (light gray) to 1 (dark gray) and it is a measure of how fast the information spreads from a given node to the other nodes. The spatial network arrangement was obtained by using the Cytoscape Spring-embedded Layout. In zoom panel are shown the most connected nodes ([Ca2+]i and ATP).
0.028 20
Node
Number of links
8086 (35%)
[Ca2+]i
26
6.546
APT/ADP
16/8
2.662
Protein tyrosine phosphorilation
14
PKA
9
γ
-1.499
PLD1
8
r
0.988
Table 2: Most connected nodes (hubs) in human capacitation network.
R2
0.884
γ
-1.934
r
0.996
C (PKC), protein kynase C (PKA), actin, and many others. To date, several molecular mechanisms have been described to be involved in capacitation-dependent rise in intracellular calcium concentration. In resting condition, the calcium clearance is maintained by molecules acting either at plasma membrane or at cytosolic level. In detail, plasma membrane Ca2+-ATPase exports a cytoplasmic Ca2+ ion and imports one or two extracellular protons at the expense of ATP. When [Ca2+]i is elevated, the plasma membrane Na+-Ca2+ exchanger operates in forward mode exporting an intracellular Ca2+ ion and importing approximately three Na+ ions at the expense of the Na+ gradient. At cytosoloic level, sarcoplasmic-endoplasmic reticulum Ca2+-ATPase pumps and the mitochondrial Ca2+ uniporter operate sequestering calcium into the acrosome or into the mitochondria, respectively. During capacitation several molecular mechanisms are activated, promoting the increase in intracellular calcium concentration [58]:
Network diameter Shortest paths Characteristic path length Averaged number of neighbours In-degree distribution
Out-degree distribution
R
2
0.818
Avg. Clustering Coefficient Distribution γ
-0.454
r
0.183
R
2
0.217
The value of connected components measures the number of networks obtained; the number of nodes represent the total number of molecules involved; the number of edges represents the total number of interaction found; the clustering coefficient is calculated as CI = 2nI / k (k − 1) where nI is the number of links connecting the kI neighbours of node I to each other; the network diameter is the largest distance between two nodes; shortest paths is the measure of the number (and percentage) of shortest path within the network; the Averaged n° neighbours represent the mean number of connection of each node; the Char. path length gives the expected distance between two connected nodes; γ represent the exponent of power law y = ax-γ, r is the correlation coefficient, R2 the coefficient of determination of power law. Table 1: Main topological parameters of human spermatozoa capacitation.
J Comput Sci Syst Biol ISSN:0974-7230 JCSB, an open access journal
CatSper channels: On sperm membrane are present four poreforming CatSper channel proteins, CatSper1–4. They contain six transmembrane-spanning (TM) domains, their overall sequences are similar to those of CaVs and they have the T/S-x-E/D-x-W signature sequence in the ion selectivity filter region. The intracellular NH2
Volume 6(4): 194-205 (2013) - 199
Citation: Bernabo N, Mattioli M, Barboni B (2013) Computational Modeling of Spermatozoa Signal Transduction Pathways: Just a Computer Game or a Reliable Tool in Studying Male Gametes Function? J Comput Sci Syst Biol 6: 194-205. doi:10.4172/jcsb.1000117
terminus of CatSper1 is rich in histidines (49 out of 250 amino acids in the mice), which may be related to its pHi sensitivity. The S4 segments of all CatSpers channels have charged residues (R/K) at every third position, a signature of voltage-gated ion channels [59]. Voltage-dependent calcium channels (VDCCs): They are a group of voltage-gated cationic channels found in spermatozoa and several others excitable cells (i.e. muscle, glial cells, neurons, etc.) with permeability to calcium about 1000-fold greater than to sodium, under normal physiological conditions. When membranes are in the condition of resting membrane potential, VDCCs are normally closed. When membrane depolarizes, as in spermatozoa it happens during AR, they open, thus allowing Ca2+ entry into the cell [58] (Table 3). Transient receptor potential channels (TRP channels): They are about 28 channels that share some structural similarity to each other. TRP are divided into two groups: group 1 includes, TRPC (“C” for canonical), TRPV (“V” for vanilloid), TRPM (“M” for melastatin), TRPN and TRPA. In group 2 there are TRPP (“P” for polycystic) and TRPML (“ML” for mucolipin). In spermatozoa TRPV1 in particular have been found to have an important role concurring in modulation of the acquisition of fertilizing ability and the onset of AR [60]. Topological parameter
Value
Connected components
17
Number of nodes
149
Number of edges
157
Clustering coefficient
0.011
Network diameter
19
Shortest paths
2583 (11%)
Characteristic path length
6.364
Averaged number of neighbours
2.081
In-degree distribution γ
-2.051
r
0.999
R2
0.926
γ
-2.413
r
0.995
R2
0.874
Out-degree distribution
Avg. Clustering Coefficient Distribution γ
1.012
r
0.395
R
2
0.389
The value of connected components measures the number of networks obtained; the number of nodes represent the total number of molecules involved; the number of edges represents the total number of interaction found; the clustering coefficient is calculated as CI = 2nI / k (k − 1) where nI is the number of links connecting the , kI neighbours of node I to each other; the network diameter is the largest distance between two nodes; shortest paths is the measure of the number (and percentage) of shortest path within the network; the Averaged n° neighbours represent the mean number of connection of each node; the Char. path length gives the expected distance between two connected nodes; γ represent the exponent of power law y = ax-γ, r is the correlation coefficient, R2 the coefficient of determination of power law. Table 3: Main topological parameters of human spermatozoa capacitation after removal of [Ca2+]i and APT/ADP system.
J Comput Sci Syst Biol ISSN:0974-7230 JCSB, an open access journal
Cyclic nucleotide-gated ion channels (CNG channels): They are ion channels that function in response to the binding of cyclic nucleotides cGMP and cAMP and either of a depolarization or a hyperpolarisation event [61]. The ATP-ADP system is the main energetic source of spermatozoa. In fact in male gametes, the metabolic energy production is ensured by the glycolysis exclusively, by mitochondrial oxidative phosphorylation exclusively, or by a combination of both the pathways [62]. Changes in protein tyrosine phosphorylation pattern of spermatozoa during the capacitation have been reported in several mammalian species such as human, mice, cattle, pigs, hamsters and cats [63-65]. This process has been demonstrated either in flagellum or at sperm head level, but at present the molecular targets of protein tyrosine phosphorylation are largely unknown.The PKA is involved in several signaling events, acting as a crossroad among different pathways. In particular HCO3− and Ca2+ promote, via soluble adenylyl cyclase (sAC), the PKA activity, which represent a key point in late events that drive the spermatozoa to acquire fertilizing ability and hyperactivated motility. At the molecular level, its activation is correlated with a modification of proteins phosphorylation pattern, dependent on the presence of cholesterol acceptors in the capacitation medium [66,67]. PLD1 plays a key role in several biochemical events, such as in the polymerization of actin that is one of the most important events occurring during capacitation. More in particular, MAP-kinase, tyrosine kinase, and ADP-ribosylation factor lead to the PLD activation, which in turn determines the hydrolysis of phosphatidyl-choline to produce phosphatidic acid, thus activating the polymerization of G-actin to F-actin [22,68,69]. It is also interesting to note that all these hubs (and in particular [Ca2+]i and ATP-ADP system) exert key roles in controlling several pathways (modules), in different times and locations. Then it is possible to classify them as “date” hubs, i.e. as intermodule hubs, in opposition to “party”, which are intra-module hubs [70,71]. This idea is confirmed also by the finding that the removal of these nodes from the networks causes the collapse of network itself. Importantly, it was found that also organisms with a completely different reproductive pattern share with human the same architecture of signaling system (i.e. are scale free) and some of the molecular determinant involved in sperm activation. It is, for instance, the case of sea urchin and Caenorhabditis elegans (Table 4) [72]. Sea urchins are members of the Phylum Echinodermata, they are dioecious, and have five gonads (five fold symmetry) [73]. The testes are lined by muscles, thus the animal squeezes spermatozoa into the surrounding sea water, where fertilization takes place [73]. Male gametes became immediately motile once they contact sea water and are attracted by chemoattractant molecules dispersed by the homologous oocytes [74]. When sperm encounter the egg jelly, they undergo to the acrosome reaction and to the pHi-dependent polymerization of actin. This last event leads to the extension of an acrosomal tubule, which exposes a new bindin-covered membrane which will fuse with the egg [75,76]. C. elegans is an unsegmented, 1 mm long, bilaterally symmetrical worm that lives in the ground. It has hermaphrodites and males (respectively 99.95% and 0.05% of the individuals). Males have a single-lobed gonad, a vas deferens, and a tail specialized for mating [77] whereas hermaphrodites have two ovaries, an oviduct, a chamber where oocytes are fertilized by sperm (the so called “spermatheca”) and a single uterus. The eggs are laid by the hermaphrodite and, after hatching, they pass through four juvenile stages (L1–L4). Hermaphrodites produce sperm at L4 stage (150 sperm per gonadal arm), and then they start to
Volume 6(4): 194-205 (2013) - 200
Citation: Bernabo N, Mattioli M, Barboni B (2013) Computational Modeling of Spermatozoa Signal Transduction Pathways: Just a Computer Game or a Reliable Tool in Studying Male Gametes Function? J Comput Sci Syst Biol 6: 194-205. doi:10.4172/jcsb.1000117
produce oocytes. The male can inseminate the hermaphrodite, which will preferentially use male sperm (both types of sperm are stored in the spermatheca). Spermatozoa from C. elegans are characterized by the absence of flagellum and the lack of acrosome, while they content many membranous vesicles, the Membranous Organelles (MOs). They acquire their motility at the end of a process, the spermiogenesis, in which the spherical spermatid extends a pseudopod, thanks an important reorganization of cytoskeleton, constituted by a Major Sperm Protein (MSP), instead of actin, and of membrane involving specific microdomains [78]. The reasons of evolution of this common feature could be the robustness against random failure, the efficiency of signal transduction, and the fastness of signalling, as already discussed. Interestingly, in all the cases, the intracellular calcium concentration is the most linked node in the networks (Table 5). Indeed, in sea urchin Ca2+ enters the sperm cell through voltage dependent channels (Cav1.2 or 1.3) or through cAMP or cGMP (SpHCN1 or 2) gated channels and it is involved in the control of cAMP, cGMP and in the PIP2/IP3 pathway [79]. In C. Elegans also [Ca2+]i is controlled by membrane channels and by sequestering the ion in intracellular stores and it concurs in modulating PIP2/IP3 signaling pathways and in regulating the MOs Topological parameter Connected components
Human
Sea urchin
C. elegans
1
1
1
Number of nodes
151
130
102
Number of edges
205
184
139
0.028
0.037
0.031
20
23
23
Clustering coefficient Network diameter Shortest paths
8086 (35%)
7176 (42%)
3524 (34%)
Characteristic path length
6.546
7.967
7.812
Averaged number of neighbours
2.662
2.738
2.569
In-degree distribution γ
-1.499
-1.531
-1.826
r
0.988
0.989
0.996
0.884
0.700
0.914
-1.934
-2.228
-2.345
R
2
Out-degree distribution γ r
0.996
0.967
0.931
R2
0.818
0.919
0.843
γ
-0.454
-0.690
0.416
r
0.183
0.347
0.305
R2
0.217
0.420
0.135
Avg. Clustering Coefficient Distribution
The value of connected components measures the number of networks obtained; the number of nodes represent the total number of molecules involved; the number of edges represents the total number of interaction found; the clustering coefficient is calculated as CI = 2nI / k (k − 1) ,where nI is the number of links connecting the kI neighbors of node I to each other; the network diameter is the largest distance between two nodes; shortest paths is the measure of the number (and percentage) of shortest path within the network; the Averaged n° neighbours represent the mean number of connection of each node; the Char. path length gives the expected distance between two connected nodes; γ represent the exponent of power law y = ax-γ, r is the correlation coefficient, R2 the coefficient of determination of power law. Table 4: Main topological parameters of human, sea urchin and C. elegans spermatozoa activation.
J Comput Sci Syst Biol ISSN:0974-7230 JCSB, an open access journal
Sea urchin
C. elegans
Human
Node
N° of links
Node
N° of links
Node
N° of links
[Ca ]i
19
[Ca ]i
10
cGMP
15
[H+]i
9
APT/ADP
16/8
[H+]i
14
Motility
8
Protein tyrosine phosphorilation
14
cAMP
13
ATP
7
PKA
9
ATP
9
Vesicle fusion
7
PLD1
8
NADH
7
2+
2+
Ca
2+
26
Table 5: Most connected nodes (hubs) in sea urchin, C. elegans and human spermatozoa activation network.
fusion and the onset of motility [78]. This finding strengthens the concept that spermatozoa signal transduction is a calcium-dependent pathway, regardless the species and the reproductive ecology of organisms.
Experimental Validation of Computational Modeling of Spermatozoa Signal Transduction Pathways - The use of such modeling strategy allows taking many biologically relevant inferences, but without an experimental validation is just a computer game. To overcome this claim, an in silico – in vitro experiment was carried out [80]. As first the molecules involved in sperm capacitation of an animal model (swine) have been described by the same approach already used and then their intracellular localization was represented by the use of Cerebral V.2 plug-in for Cytoscape (Figure 6). As a result it has been found that the node representing the “actin polymerization” node has two important and unique features: - it is one of the most connected nodes (a hub); - it links in a specific manner all the intracellular compartments. To better study its role in capacitation, the node was removed from the network and, as a result, it was found that its topology did not change significatively (Table 6) but that a few nodes were detached from the ensemble. It is important to note that among these nodes there were “OAM fusion” and “PM fusion”. This leads to hypothesize that the in vitro inhibition of actin polymerization will not affect whole cellular function (networks topology did not change) but, at the same time, OAM and PM will be unable to fuse each other (i.e. the AR will not take place, even in the presence of its physiological agonists). Surprisingly, these inferences were exactly confirmed when boar spermatozoa where incubated under capacitating condition in the presence of cytochalasin D (CD), an inhibitor of actin polymerization. Treated spermatozoa, when compared with control ones, did not displayed a different CTC staining pattern, or a different relocalization of PLC-γ1 from cytosol to membrane (where it exerts its activity), or a different tyrosine phosphorylation pattern. They maintained the ability to respond with a fast rise in intracellular calcium concentration to the ZP coincubation, but they are unable to undergo AR when stimulated with its physiological agonist (homologous ZP3). This finding leaded to take two important observations: 1) It is currently thought that the actin has a merely structural role during capacitation: the actin network appearing during this process acts as a diaphragm between the PM and OAM avoiding their fusion. At the moment of AR this physical
Volume 6(4): 194-205 (2013) - 201
Citation: Bernabo N, Mattioli M, Barboni B (2013) Computational Modeling of Spermatozoa Signal Transduction Pathways: Just a Computer Game or a Reliable Tool in Studying Male Gametes Function? J Comput Sci Syst Biol 6: 194-205. doi:10.4172/jcsb.1000117
Figure 6: Boar spermatozoa capacitation network and with subcellular localization of nodes. The node size is proportional to the connection number and the node color gradient, from red (higher values) to green (lower values) is dependent from the closeness centrality. This parameter is computed as: Cc(n) = 1/avg(L(n,m)), were L (n,m) is the length of the shortest path between two nodes n and m. The closeness centrality of each node ranges from 0 (light gray) to 1 (dark gray) and it is a measure of how fast the information spreads from a given node to the other nodes (modified from Bernabò et al., [77]).
barrier is rapidly removed and the fusion between the two membranes can happen. If this model was correct it will be reasonably to expect that the treatment of spermatozoa with CD, in early phases of capacitation, would lead to the increase in the percentage of spermatozoa undergoing AR, because of the inefficiency of PM and OAM separation. On the contrary, it was found that, even in the absence of this diaphragm, the PM and OAM did not fuse. Thus, it possible to hypothesize that in spermatozoa, as in other cells, the role of actin cytoskeleton overcomes the structural function, having a more complex role. As suggested by the results of computational experiment, it is possible to suppose that actin dynamics could play an important role in coordination of information flow, in keeping with the emerging evidence that, in several cellular systems, the cytoskeleton has a key role in signal transduction. Indeed, “independent of its mechanical strength, the filaments of the cytoskeleton form a continuous, dynamic connection between nearly all cellular structures, and they present an enormous surface area on which proteins and other cytoplasmic components can dock” [81]. Possibly, actin cytoskeleton might provide a signal transduction route and macromolecular scaffold, which, during capacitation, contributes to the spatial J Comput Sci Syst Biol ISSN:0974-7230 JCSB, an open access journal
organization of signaling pathways. 2) it is evident that the in silico experiments results were in perfect agreement with those from the in vitro approach, thus providing the direct validation of computational modeling.
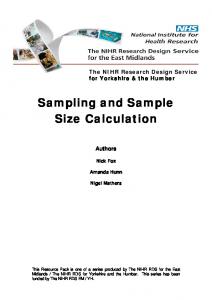
In silico: a new environment for studying signal transduction of mammalian spermatozoa Form these data it emerges that it is possible to complete the data obtained from in vivo and in vitro experiments with those from computational models (i.e. from in silico experiments). Indeed it is possible to complete our knowledge by integrating the data from the different approaches (Figure 7). In vivo and in vitro obtained data can be used to build computational models and, once the models have been realized, to validate them. Vice versa in silico research could open new perspective for wet lab biologists, thus establishing a sort of positive feed-back. In this optic this new environment could be really useful for several reasons: 1) it could be possible to carry out experiments without ethical concerns; 2) it is possible to compare the biochemical machinery from
Volume 6(4): 194-205 (2013) - 202
Citation: Bernabo N, Mattioli M, Barboni B (2013) Computational Modeling of Spermatozoa Signal Transduction Pathways: Just a Computer Game or a Reliable Tool in Studying Male Gametes Function? J Comput Sci Syst Biol 6: 194-205. doi:10.4172/jcsb.1000117
Topological parameter Connected components
Swine spermatozoa capacitation
Swine spermatozoa capacitation without “actin polymerization”
1
6
Number of nodes
153
152
Number of edges
208
199
0.028
0.028
20
20
Clustering coefficient Network diameter Shortest paths
8177 (35%)
Characteristic path length
6.540
6.621
Averaged number of neighbours
2.654
2.566
γ
-1.530
-1.473
r
0.990
0.988
0.862
0.884
γ
-1.942
-2.159
r
0.995
0.996
R2
0.818
0.882
γ
-0.486
-0.448
r
0.215
0.162
R2
0.249
0.207
In-degree distribution
R
2
Out-degree distribution
Avg. Clustering Coefficient Distribution
The value of connected components measures the number of networks obtained; the number of nodes represent the total number of molecules involved; the number of edges represents the total number of interaction found; the clustering coefficient is calculated as CI = 2nI / k (k − 1) where nI is the number of links connecting the kI neighbours of node I to each other; the network diameter is the largest distance between two nodes; shortest paths is the measure of the number (and percentage) of shortest path within the network; the Average n° neighbours represent the mean number of connection of each node; the Char. path length gives the expected distance between two connected nodes; γ represent the exponent of power law y = ax-γ, r is the correlation coefficient, R2 the coefficient of determination of power law. Table 6: Main topological parameters of boar spermatozoa capacitation before and after removal of “actin polymerization” node.
different species for comparative and evolutionary purposes; 3) it is possible to assess great numbers of experimental conditions, drugs, media, etc… in short times and saving money; 4) Above all, from networks topology it is possible to infer new information, otherwise unattainable, that could improve our understanding of spermatozoa biology. References 1. AUSTIN CR (1951) Activation and the correlation between male and female elements in fertilization. Nature 168: 558-559. 2. CHANG MC (1951) Fertilizing capacity of spermatozoa deposited into the fallopian tubes. Nature 168: 697-698. 3. Hunter RH (2012) Components of oviduct physiology in eutherian mammals. Biol Rev Camb Philos Soc 87: 244-255. 4. Gadella BM, Tsai PS, Boerke A, Brewis IA (2008) Sperm head membrane reorganisation during capacitation. Int J Dev Biol 52: 473-480. 5. Boerke A, Tsai PS, Garcia-Gil N, Brewis IA, Gadella BM (2008) Capacitationdependent reorganization of microdomains in the apical sperm head plasma membrane: functional relationship with zona binding and the zona-induced acrosome reaction. Theriogenology 70: 1188-1196. 6. Gadella BM (2008) Sperm membrane physiology and relevance for fertilization. Anim Reprod Sci 107: 229-236. 7. Harrison RA, Gadella BM (2005) Bicarbonate-induced membrane processing in sperm capacitation. Theriogenology 63: 342-351. 8. Gadella BM, Van Gestel RA (2004) Bicarbonate and its role in mammalian sperm function. Anim Reprod Sci 82-83: 307-19. 9. Maccarrone M, Barboni B, Paradisi A, Bernabò N, Gasperi V, et al. (2005) Characterization of the endocannabinoid system in boar spermatozoa and implications for sperm capacitation and acrosome reaction. J Cell Sci 118: 4393-4404. 10. Barboni B, Bernabò N, Palestini P, Botto L, Pistilli MG, et al. (2011) Type-1 cannabinoid receptors reduce membrane fluidity of capacitated boar sperm by impairing their activation by bicarbonate. PLoS One 6: e23038. 11. Bernabò N, Palestini P, Chiarini M, Maccarrone M, Mattioli M, et al. (2012) Endocannabinoid-binding CB1 and TRPV1 receptors as modulators of sperm capacitation. Commun Integr Biol 5: 68-70. 12. Ickowicz D, Finkelstein M, Breitbart H (2012) Mechanism of sperm capacitation and the acrosome reaction: role of protein kinases. Asian J Androl 14: 816-821. 13. Shukla KK, Mahdi AA, Rajender S (2012) Ion channels in sperm physiology and male fertility and infertility. J Androl 33: 777-788. 14. Signorelli J, Diaz ES, Morales P (2012) Kinases, phosphatases and proteases during sperm capacitation. Cell Tissue Res 349: 765-782. 15. Lishko PV, Kirichok Y, Ren D, Navarro B, Chung JJ, et al. (2012) The control of male fertility by spermatozoan ion channels. Annu Rev Physiol 74: 453-475. 16. Chang H, Suarez SS (2010) Rethinking the relationship between hyperactivation and chemotaxis in mammalian sperm. Biol Reprod 83: 507-513. 17. Suarez SS (2008) Control of hyperactivation in sperm. Hum Reprod Update 14: 647-657. 18. Suarez SS (2008) Regulation of sperm storage and movement in the mammalian oviduct. Int J Dev Biol 52: 455-462. 19. Yanagimachi R (1969) In vitro capacitation of hamster spermatozoa by follicular fluid. J Reprod Fertil 18: 275-286. 20. Breitbart H, Etkovitz N (2011) Role and regulation of EGFR in actin remodeling in sperm capacitation and the acrosome reaction. Asian J Androl 13: 106-110. 21. Breitbart H, Rotman T, Rubinstein S, Etkovitz N (2010) Role and regulation of PI3K in sperm capacitation and the acrosome reaction. Mol Cell Endocrinol 314: 234-238.
Figure 7: In silico, in vitro and in vivo approaches are complementary resources, whose integration could improve our understanding of spermatozoa biology.
J Comput Sci Syst Biol ISSN:0974-7230 JCSB, an open access journal
22. Breitbart H, Cohen G, Rubinstein S (2005) Role of actin cytoskeleton in mammalian sperm capacitation and the acrosome reaction. Reproduction 129: 263-268.
Volume 6(4): 194-205 (2013) - 203
Citation: Bernabo N, Mattioli M, Barboni B (2013) Computational Modeling of Spermatozoa Signal Transduction Pathways: Just a Computer Game or a Reliable Tool in Studying Male Gametes Function? J Comput Sci Syst Biol 6: 194-205. doi:10.4172/jcsb.1000117
23. Bernabò N, Mattioli M, Barboni B (2012) A Systems Biology Approach to Understanding Male Infertility. Intech open science 24. Krausz C (2011) Male infertility: pathogenesis and clinical diagnosis. Best Pract Res Clin Endocrinol Metab 25: 271-285. 25. Van Regenmortel MH (2004) Reductionism and complexity in molecular biology. Scientists now have the tools to unravel biological and overcome the limitations of reductionism. EMBO Rep 5: 1016-1020.
48. Papin JA, Reed JL, Palsson BO (2004) Hierarchical thinking in network biology: the unbiased modularization of biochemical networks. Trends Biochem Sci 29: 641-647. 49. Ravasz E (2009) Detecting hierarchical modularity in biological networks. Methods Mol Biol 541: 145-160. 50. Ravasz E, Barabási AL (2003) Hierarchical organization in complex networks. Phys Rev E Stat Nonlin Soft Matter Phys 67: 026112.
26. Barabási AL (2003) Linked: How Everything is connected to Everything Else and What It Means for Business, Science, and Everyday Life. New York: Plume.
51. Gur Y, Breitbart H (2007) Protein translation in mammalian sperm. Soc Reprod Fertil Suppl 65: 391-397.
27. Wey T, Blumstein DT, Shen W, Jordan F (2008) Social network analysis of animal behaviour: a promising tool for the study of sociality. Animal Behaviour 75: 333-344.
52. Gur Y, Breitbart H (2008) Protein synthesis in sperm: dialog between mitochondria and cytoplasm. Mol Cell Endocrinol 282: 45-55.
28. Hein O, Schwind M, Spiwoks M (2005) A Microscopic Stock Market Model with Heterogeneous Interacting Agents in a Scale-Free Communication Network. Workshop on Economic Heterogeneous Interacting Agents (WEHIA 05), University of Essex. 29. Barabási AL (2009) Scale-free networks: a decade and beyond. Science 325: 412-413. 30. Barabási AL, Bonabeau E (2003) Scale-free networks. Sci Am 288: 60-69. 31. Guimerà R, Mossa S, Turtschi A, Amaral LA (2005) The worldwide air transportation network: Anomalous centrality, community structure, and cities’ global roles. Proc Natl Acad Sci U S A 102: 7794-7799.
53. Bernabò N, Mattioli M, Barboni B (2010) The spermatozoa caught in the net: the biological networks to study the male gametes post-ejaculatory life. BMC Syst Biol 4: 87. 54. Saito R, Smoot ME, Ono K, Ruscheinski J, Wang PL, et al. (2012) A travel guide to Cytoscape plugins. Nat Methods 9: 1069-1076. 55. Network Analyzer Online Help 56. Fraser LR, Umar G, Sayed S (1993) Na(+)-requiring mechanisms modulate capacitation and acrosomal exocytosis in mouse spermatozoa. J Reprod Fertil 97: 539-549. 57. Wennemuth G, Babcock DF, Hille B (2003) Calcium clearance mechanisms of mouse sperm. J Gen Physiol 122: 115-128.
32. Stoop R, Saase V, Wagner C, Stoop B, Stoop R (2013) Beyond scale-free small-world networks: cortical columns for quick brains. Phys Rev Lett 110: 108105.
58. Darszon A, Nishigaki T, Beltran C, Treviño CL (2011) Calcium channels in the development, maturation, and function of spermatozoa. Physiol Rev 91: 13051355.
33. Kobayashi R, Kitano K (2013) Impact of network topology on inference of synaptic connectivity from multi-neuronal spike data simulated by a large-scale cortical network model. J Comput Neurosci 35: 109-124.
59. Ren D, Xia J (2010) Calcium signaling through CatSper channels in mammalian fertilization. Physiology (Bethesda) 25: 165-175.
34. Smit DJ, de Geus EJ, van de Nieuwenhuijzen ME, van Beijsterveldt CE, van Baal GC, et al. (2011) Scale-free modulation of resting-state neuronal oscillations reflects prolonged brain maturation in humans. J Neurosci 31: 13128-13136.
60. Bernabò N, Pistilli MG, Mattioli M, Barboni B (2010) Role of TRPV1 channels in boar spermatozoa acquisition of fertilizing ability. Mol Cell Endocrinol 323: 224-231. 61. Navarro B, Kirichok Y, Chung JJ, Clapham DE (2008) Ion channels that control fertility in mammalian spermatozoa. Int J Dev Biol 52: 607-613.
35. Ravasz E (2009) Detecting hierarchical modularity in biological networks. Methods Mol Biol 541: 145-160.
62. Storey BT (2008) Mammalian sperm metabolism: oxygen and sugar, friend and foe. Int J Dev Biol 52: 427-437.
36. Lacroix V, Cottret L, Thébault P, Sagot MF (2008) An introduction to metabolic networks and their structural analysis. IEEE/ACM Trans Comput Biol Bioinform 5: 594-617.
63. Breitbart H, Rubinstein S, Etkovitz N (2006) Sperm capacitation is regulated by the crosstalk between protein kinase A and C. Mol Cell Endocrinol 252: 247-249.
37. Sweetlove LJ, Fernie AR (2005) Regulation of metabolic networks: understanding metabolic complexity in the systems biology era. New Phytol 168: 9-24.
64. Visconti PE (2009) Understanding the molecular basis of sperm capacitation through kinase design. Proc Natl Acad Sci U S A 106: 667-668.
38. Bollobás B (1979) Graph Theory: an Introductory Course. New York: Springer Verlag. 39. Barabási AL, Oltvai ZN (2004) Network biology: understanding the cell’s functional organization. Nat Rev Genet 5: 101-113. 40. Jeong H, Tombor B, Albert R, Oltvai ZN, Barabási AL (2000) The large-scale organization of metabolic networks. Nature 407: 651-654. 41. Yook SH, Oltvai ZN, Barabási AL (2004) Functional and topological characterization of protein interaction networks. Proteomics 4: 928-942. 42. Gilbert EN (1959) Random graphs. Annals of Mathematical Statistics 30: 1141– 1144. 43. Erdos P, Rényi A (1959) On Random Graphs I. Publ Math Debrecen 6: 290– 297. 44. Milgram S (1967) The small-world problem. Psychology Today 1: 61-67. 45. Watts DJ, Strogatz SH (1998) Collective dynamics of ‘small-world’ networks. Nature 393: 440-442.
65. Barbonetti A, Vassallo MR, Cinque B, Antonangelo C, Sciarretta F, et al. (2008) Dynamics of the global tyrosine phosphorylation during capacitation and acquisition of the ability to fuse with oocytes in human spermatozoa. Biol Reprod 79: 649-656. 66. Visconti PE, Bailey JL, Moore GD, Pan D, Olds-Clarke P, et al. (1995) Capacitation of mouse spermatozoa. I. Correlation between the capacitation state and protein tyrosine phosphorylation. Development 121: 1129-1137. 67. Urner F, Sakkas D (2003) Protein phosphorylation in mammalian spermatozoa. Reproduction 125: 17-26. 68. Gomez-Cambronero J, Keire P (1998) Phospholipase D: a novel major player in signal transduction. Cell Signal 10: 387-397. 69. Cohen G, Rubinstein S, Gur Y, Breitbart H (2004) Crosstalk between protein kinase A and C regulates phospholipase D and F-actin formation during sperm capacitation. Dev Biol 267: 230-241. 70. Han JD, Bertin N, Hao T, Goldberg DS, Berriz GF, et al. (2004) Evidence for dynamically organized modularity in the yeast protein-protein interaction network. Nature 430: 88-93.
46. Barabasi AL, Albert R (1999) Emergence of scaling in random networks Science 286: 509-512.
71. Chang X, Xu T, Li Y, Wang K (2013) Dynamic modular architecture of proteinprotein interaction networks beyond the dichotomy of ‘date’ and ‘party’ hubs. Sci Rep 3: 1691.
47. Albert R, Barabási AL (2002) Statistical mechanics of complex networks. Rev Mod Phys 74: 47–97.
72. Bernabò N, Saponaro I, Mattioli M, Barboni B (2012) Signaling Strategy in Spermatozoa Activation in Sea Urchin, C. elegans and Human: Three Different
J Comput Sci Syst Biol ISSN:0974-7230 JCSB, an open access journal
Volume 6(4): 194-205 (2013) - 204
Citation: Bernabo N, Mattioli M, Barboni B (2013) Computational Modeling of Spermatozoa Signal Transduction Pathways: Just a Computer Game or a Reliable Tool in Studying Male Gametes Function? J Comput Sci Syst Biol 6: 194-205. doi:10.4172/jcsb.1000117
Players for the Same Melody. J Bioengineer & Biomedical Sci 001-S3. 73. Barnes RD (1992) Invertebrate Zoology. Holt-Saunders International Edition 2. 74. Neill AT, Vacquier VD (2004) Ligands and receptors mediating signal transduction in sea urchin spermatozoa. Reproduction 127: 141-149. 75. Barré P, Zschörnig O, Arnold K, Huster D (2003) Structural and dynamical changes of the bindin B18 peptide upon binding to lipid membranes. A solidstate NMR study. Biochemistry 42: 8377-8386. 76. Kamei N, Glabe CG (2003) The species-specific egg receptor for sea urchin sperm adhesion is EBR1,a novel ADAMTS protein. Genes Dev 17: 2502-2507. 77. L’Hernault SW (2006) Spermatogenesis. WormBook .
78. Fraire-Zamora JJ, Cardullo RA (2010) The physiological acquisition of amoeboid motility in nematode sperm: is the tail the only thing the sperm lost? Mol Reprod Dev 77: 739-750. 79. Darszon A, Nishigaki T, Wood C, Treviño CL, Felix R, et al. (2005) Calcium channels and Ca2+ fluctuations in sperm physiology. Int Rev Cytol 243: 79172. 80. Bernabò N, Berardinelli P, Mauro A, Russo V, Lucidi P, et al. (2011) The role of actin in capacitation-related signaling: an in silico and in vitro study. BMC Syst Biol 5: 47. 81. Janmey PA (1998) The cytoskeleton and cell signaling: component localization and mechanical coupling. Physiol Rev 78: 763-781.
Submit your next manuscript and get advantages of OMICS Group submissions Unique features: • • •
User friendly/feasible website-translation of your paper to 50 world’s leading languages Audio Version of published paper Digital articles to share and explore
Special features:
Citation: Bernabo N, Mattioli M, Barboni B (2013) Computational Modeling of Spermatozoa Signal Transduction Pathways: Just a Computer Game or a Reliable Tool in Studying Male Gametes Function? J Comput Sci Syst Biol 6: 194-205. doi:10.4172/jcsb.1000117
J Comput Sci Syst Biol ISSN:0974-7230 JCSB, an open access journal
• • • • • • • •
250 Open Access Journals 20,000 editorial team 21 days rapid review process Quality and quick editorial, review and publication processing Indexing at PubMed (partial), Scopus, DOAJ, EBSCO, Index Copernicus and Google Scholar etc Sharing Option: Social Networking Enabled Authors, Reviewers and Editors rewarded with online Scientific Credits Better discount for your subsequent articles
Submit your manuscript at: http://www.editorialmanager.com/systemsbiology
Volume 6(4): 194-205 (2013) - 205