Mar 4, 2016 - optimization algorithm, for determining degrees of freedom (the number of used ..... âbestâ c that converges to c0 in the limit of M/N â â.
Sampling approach to sparse approximation problem: determining degrees of freedom by simulated annealing Tomoyuki Obuchi and Yoshiyuki Kabashima
arXiv:1603.01399v1 [cs.IT] 4 Mar 2016
Department of Computational Intelligence and Systems Science, Tokyo Institute of Technology, Yokohama 226-8502, Japan Abstract—The approximation of a high-dimensional vector by a small combination of column vectors selected from a fixed matrix has been actively debated in several different disciplines. In this paper, a sampling approach based on the Monte Carlo method is presented as an efficient solver for such problems. Especially, the use of simulated annealing (SA), a metaheuristic optimization algorithm, for determining degrees of freedom (the number of used columns) by cross validation is focused on and tested. Test on a synthetic model indicates that our SA-based approach can find a nearly optimal solution for the approximation problem and, when combined with the CV framework, it can optimize the generalization ability. Its utility is also confirmed by application to a real-world supernova data set.
I. I NTRODUCTION In a formulation of compressed sensing, a sparse vector x = (xi ) ∈ RN is recovered from a given measurement vector y = (yµ ) ∈ RM (M < N ) by minimizing the residual sum of squares (RSS) under a sparsity constraint as � � 1 2 ˆ x(K) = arg min ||y − Ax||2 subj. to ||x||0 ≤ K, (1) 2 x where A = (Aµi ) ∈ RM×N and ||x||0 denote the measurement matrix and the number of non-zero components in x (ℓ0 norm), respectively [1]. The need to solve similar problems also arises in many contexts of information science such as variable selection in linear regression, data compression, denoising, and machine learning. We hereafter refer to the problem of (1) as the sparse approximation problem (SAP). Despite the simplicity of its expression, SAP is highly nontrivial to solve. Finding the exact solution of (1) has proved to be NP-hard [2], and various approximate methods have been proposed. Orthogonal matching pursuit (OMP) [3], in which the set of used columns is incremented in a greedy manner to minimize RSS, is a representative example of such approximate solvers. Another way of finding an approximate solution of (1) is by converting the problem into a Lagrangian form 12 ||y −Ax||22 +λ||x||pp in conjunction with relaxing ||x||0 PN to ||x||pp = i=1 |xi |p . In particular, setting p = 1 makes the converted problem convex and allows us to efficiently find its unique minimum solution. This approach is often termed LASSO [4]. When prior knowledge about the generation of x and y is available in the form of probability distributions, one may resort to the Bayesian framework for inferring x from
y. This can be efficiently carried out by approximate message passing (AMP) [5]. Solvers of these kinds have their own advantages and disadvantages, and the choice of which to employ depends on the imposed constraints and available resources. This means that developing novel possibilities is important for offering more choices. Supposing a situation where one can make use of relatively high computational resources, we explore the abilities and limitations of another approximate approach, i.e., Monte Carlo (MC)-based sampling. In an earlier study, we showed that a version of simulated annealing (SA) [6], which is a versatile MC-based metaheuristic for functional optimization, has the ability to efficiently find a nearly optimal solution for SAP in a wide range of system parameters [7]. In this paper, we particularly focus on the problem of determining the degrees of freedom, K, by cross validation (CV). We will show that the necessary computational cost of our algorithm is bounded by O(M 2 N |SK |Kmax ), where SK is the set of tested values of K and |SK | is its cardinality, and Kmax is the largest one among tested values of K. Admittedly, this computational cost is not cheap. However, our algorithm is easy to parallelize and we expect that large-scale parallelization will significantly diminish this disadvantage and will make the CV analysis using SA practical. II. S AMPLING
FORMULATION AND SIMULATED ANNEALING
Let us introduce a binary vector c = (ci ) ∈ {0, 1}N , which indicates the column vectors used to approximate y: If ci = 1, the ith column of A, ai , is used; if ci = 0, it is not used. We call this binary variable sparse weight. Given c, the optimal coefficients, x(c), are expressed as x(c) = arg min ||y − A(c ◦ x)||22 ,
(2)
x
where (c ◦ x)i = ci xi represents the Hadamard product. The components of x(c) for the zero components of c are actually indefinite, and we set them to be zero. The corresponding RSS is thus defined by E(c|y, A) = M ǫ(c|y, A) =
1 ||y − Ax(c)||22 . 2
(3)
To perform sampling, we employ the statistical mechanical formulation in Ref. [7] as follows. By regarding E as an “energy” and introducing an “inverse temperature” β, we can define a Boltzmann distribution as ! X 1 ci − K e−βE(c|y,A), (4) P (c|β; y, A) = δ G i where G is the “partition function” G = G(β|y, A) =
X c
δ
X i
ci − K
!
e−βE(c|y,A) .
(5)
In the limit of β → ∞, (4) is guaranteed to concentrate on the solution of (1). Therefore, sampling c at β ≫ 1 offers an approximate solution of (1). Unfortunately, directly sampling c from (4) is computationally difficult. To resolve this difficulty, we employ a Markov chain dynamics whose equilibrium distribution accords with (4). Among many choices of such dynamics, we employ the standard Metropolis-Hastings rule [8]. A noteworthy remark is that a trial move of the sparse weights, c → c′ , is generated by “pair flipping” two sparse weights, one equal to 0 and the other equal to 1. Namely, choosing an index i of the sparse weight from ONES ≡ {k|ck = 1} and another index j from ZEROS ≡ {k|ck = 0}, we set c′ = c, except for the counterpart of (ci , cj ) = (1, 0), which is given as (c′i , c′j ) = (0, 1). This flipping can keep the sparsity constant during the update. A pseudo-code of the MC algorithm is given in Algorithm 1 as a reference. The most time-consuming part in the algorithm is the evaluation of E ′ denoted in the sixth line; the naive operation for it requires O(M K 2 + K 3 ) since matrix inversion of the gram matrix A(c)T A(c) is involved, where T and A(c) stand for the matrix transpose and the submatrix of A that is composed of column vectors of A whose column indices belong to ONES, respectively. However, since the flip c → c′ changes A(c) only by two columns, one can reduce this computational cost to O(M K + K 2 ) using a matrix inversion formula [7]. This implies that, when the average number of flips per variable (MC steps) is kept to a constant, the computational cost of the algorithm scales as O(M N K) per MC step in the dominant order since M > K. In general, a longer time is required for equilibrating MC dynamics as β grows larger. Furthermore, the dynamics has the risk of being trapped by trivial local minima of (3) if β is fixed to a very large value from the beginning. A practically useful technique for avoiding these inconveniences is to start with a sufficiently small β and gradually increase it, which is termed simulated annealing (SA) [6]. As β → ∞, c is no longer updated, and final configuration cfin is expected to lead to a solution that is very close (or identical) to the optimal ˆ solution in (1), i.e., x(K) ≈ x(cfin ). SA is mathematically guaranteed to find the globally optimal solution of (1) if β is increased to infinity slowly enough in such a way that β(t) < C log(t + 2) is satisfied, where t is the counter of the MC dynamics and C is a time-independent
constant [9]. Of course, this schedule is practically meaningless, and a much faster schedule is employed generally. In Ref. [7], we examined the performance of SA with a very rapid annealing schedule for a synthetic model whose properties of fixed β can be analytically evaluated. Comparison between the analytical and the experimental results indicates that the rapid SA performs quite well unless a phase transition of a certain type occurs at relatively low β. Owing to the analysis of the synthetic model, the range of system parameters in which the phase transition occurs is rather limited. We therefore expect that SA serves as a promising approximate solver for (1). Algorithm 1 MC update with pair flipping 1: procedure MC PF (c, β, y, A) ⊲ MC routine 2: ONES ← {k|ck = 1}, ZEROS ← {k|ck = 0} 3: randomly choose i from ONES and j from ZEROS 4: c′ ← c 5: (c′i , c′j ) ← (0, 1) 6: (E, E ′ ) ← (E(c|y, A), E(c′ |y, A)) ′ 7: paccept ← max(1, e−β (E −E ) ) 8: generate a random number r ∈ [0, 1] 9: if r < paccept then 10: c ← c′ 11: end if 12: return c 13: end procedure
III. E MPLOYMENT OF SA
FOR CROSS VALIDATION
CV is a framework designed to evaluate the generalization ability of statistical models/learning systems based on a given set of data. In particular, we examine the leave-one-out (LOO) CV, but its generalization to the k-fold CV is straightforward. In accordance with the cost function of (1), we define the generalization error !2 N X 1 (6) ǫg = A(M+1),i xi yM+1 − 2 i=1 as a natural measure for evaluating the generalization ability of x, where · · · denotes the expectation with respect to the � “unobserved” (M + 1)th data {A(M+1),i }, yM+1 . LOO CV assesses the LOO CV error (LOOE) !2 N M X 1 X \µ \µ Aµi xi (c ) (7) yµ − ǫLOO (K|y, A) = 2M µ=1 i=1
as an estimator of (6) for the solution of (1), where \µ x\µ (c\µ ) = (xi (c\µ )) is the solution of (1) for the “µth LOO system,” which is defined by removing the µth data ({Aµi }, yµ ) from the original system. One can evaluate (7) by independently applying SA to each of the M LOO systems. The LOOE of (7) depends on K through c\µ , and hence we can determine its “optimal” value from the minimum of ǫLOO (K|y, A) by sweeping K. Compared to the case of a single run of SA at a given K, the computational cost for
y = Ax0 + ξ,
(8)
ρ=0.05
0.2 0.18 0.16
1 ˆ − x0 ||22 ||x N
0.1 0.08 0.06
0
0.1
0.1
0.08
0.08
0.06
0.06
0.04
0.04
0.02
0.5
1
0.02
0
T
0.5
1
0
0
0.5
T
1
T
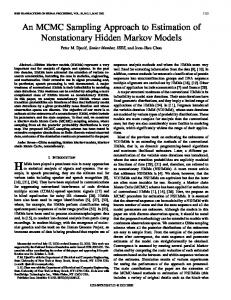
Fig. 1. ǫ versus T = β −1 observed in the annealing process for N = 100, 200, and 400. Curves represent the RS predictions for (4). The replica symmetry is broken owing to the AT instability below the broken lines.
α=0.5,ρ =0.1,σ2 =10,σ2 =0.1 0
[10]–[12]. Hence, minimizing the estimator of (6), i.e. (7), ˆ in the sense of (9). The leads to optimizing the accuracy of x same conclusion has also been obtained for LASSO in the limit of M → ∞ while keeping N and K finite [13], where it is not needed to assume absence of correlations in A. The second issue is about the difficulty in identifying sparse weight vector c0 of x0 using CV, which is known to fail even when M/N → ∞ [14]. Actually, we have tried a naive approach to identify c0 by directly minimizing a CV error with the use of SA and confirmed that it does not work. A key quantity for this is another type of LOOE: !2 N M X 1 X \µ Aµi xi (c) . (10) yµ − ǫ˜LOO (c|y, A) = 2M µ=1 i=1
0.3
x
ξ
N=100 N=200 N=400 RS AT ρ0
ǫ
0.4
This looks like (7), but is different in that c is common among all the terms. It may be natural to expect that the sparse weight minimizing (10), c˜ = argminc {˜ ǫLOO (c|y, A)}, is the “best” c that converges to c0 in the limit of M/N → ∞. Unfortunately, this is not true; in fact, ǫ˜LOO (c|y, A) in general tends to decrease as K increases, irrespective of the value of ||x0 ||0 [14]. We have confirmed this by conducting SA, handling ǫ˜LOO (c|y, A) as an energy function of c. Therefore, minimizing (10) can neither identify c0 nor offer any clue for determining K. We emphasize that minimization of (7) can be utilized to determine K to optimize the generalization ability, although it does not have the ability to identify c0 either. The difference between these two issues is critical and confusing, as several earlier studies have provided some controversial implications to the usage of CV in sparse inference on linear models [13], [15]–[18].
0.12
0.12
(9)
ˆ x0 ) = d2 (x,
ρ=0.15
0.12
0.14
M
where ξ ∈ R is a noise vector whose entries are uncorrelated with one another. The first issue is about the accuracy in inferring x0 . When A is provided as a column-wisely normalized zero mean random matrix whose entries are uncorrelated with one another, (6) is linearly related to the squared distance between the true and ˆ which is given as inferred vectors, x0 and x,
ρ=0.1
0.14
N=100 N=200 N=400 RS AT
ǫ
LOO CV is increased by a certain factor. This factor is roughly evaluated as O(M × |SK | × Kmax ) when varying K in the set of SK in which the maximum value is Kmax . However, this part of the computation can be easily parallelized and, therefore, may not be so problematic when sufficient quantities of CPUs and memories are available. In the next section, the rationality of the proposed approach is examined by application to a synthetic model and a real-world data set. Before closing this section, we want to remark on two important issues. For this, we assume that y is generated by a true sparse vector x0 as
0.2 0.1 0
0
0.05
0.1
0.15
0.2
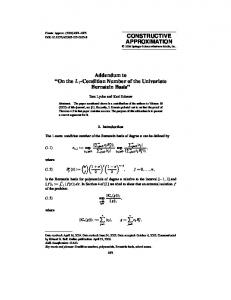
ρ Fig. 2. ǫ finally achieved by SA (symbols), its RS assessments for β → ∞ (full curve) and at the onset of the AT instability (red broken curve), plotted against ρ = K/N .
IV. R ESULT A. Test on a synthetic model We first examine the utility of our methodology by applying it to a synthetic model in which vector y is generated in the manner of (8). For analytical tractability, we assume that A is a simple random matrix whose entries are independently sampled from N (0, N −1 ) and that each component of x0 and ξ is also independently generated from (1 − ρ0 )δ(x) + ρ0 N (0, σx2 ) and N (0, σξ2 ), respectively. Under these assumptions, an analytical technique based on the replica method of statistical mechanics makes it possible to theoretically assess the typical values of various macroscopic quantities when c is generated from (4) as N → ∞ keeping α = M/N finite [19]. We performed a theoretical assessment under the so-called replica symmetric (RS) assumption. In the experiment, system parameters were fixed as ρ0 = 0.1, α = 0.5, σx2 = 10, and σξ2 = 0.1. The annealing schedule
2
K ǫLOO
2
α=0.5,ρ0 =0.1,σx =10,σξ =0.1
0.45 0.4
ǫ LOO,ǫ g
0.35
2 0.0239
variable times selected
0.3 0.25
variable times selected
0.2 0.15
0
0.05
0.1
0.15
5 0.0334
Fig. 3. ǫLOO evaluated by solutions of SA (symbols) and RS assessments of typical ǫg for β → ∞ (full curve) and at the onset of the AT instability (red broken curve), plotted against ρ = K/N .
K=1 2 ∗ 78 0 K=2 2 1 78 77
∗ 0 275 1
∗ 0
∗ 0 ∗ 0
∗ 0
K=3 2 1 78 76
233 69
14 3
69 2
variable times selected
K=4 2 1 78 59
233 56
94 49
225 13
variable times selected
K=5 2 36 78 37
223 33
225 31
6 27
0.2
ρ
TABLE II T HE TOP FIVE VARIABLES SELECTED BY THE M = 78 LOO CV K = 1–5.
was set as βa = β0 + ra−1 − 1, τa = τ, (a = 1, · · · , 100),
4 0.0331
variable times selected
0.1 0.05 0
3 0.0281
TABLE I LOO CV ERROR OBTAINED FOR K = 1–5 FOR THE TYPE I A SUPERNOVA DATA SET.
N=100 N=200 N=400 RS AT ρ0 ρ*
0.5
1 0.0328
FOR
(11)
where τa denotes the typical number of MC flips per component for a given value of inverse temperature βa . We set τ = 5, β0 = 10−8 , and r = 1.1 as default parameter values. Thus, the maximum value of β was β100 ≈ 1.3 × 10⁴ . The examined system sizes were N = 100, 200, and 400. We took the average over Nsamp = 100 different samples. The error bar is givenpby the standard deviation among those samples divided by Nsamp − 1. Fig. 1 shows how ǫ depends on T = β −1 during the annealing process for K/N ≡ ρ = 0.05, 0.1, and 0.15. The data of SA (symbols) for N = 100, 200, and 400 totally exhibit a considerably good accordance with the theoretical prediction (curves) for (4) despite the very rapid annealing schedule of (11), in which ci (i = 1, 2, . . . , N ) is flipped only five times on average at each value of β = βa . The replica analysis indicates that the replica symmetry breaking (RSB) due to the de Almeida-Thouless (AT) instability [20] occurs below the broken lines. However, the RS predictions for β → ∞ still serve as the lower bounds of ǫmin even in such cases [21], [22]. Fig. 2 shows that the values achieved by SA are fairly close to the lower bounds, implying that SA can find nearly optimal solutions of (1). Let us denote (6) of typical samples generated from (4) at inverse temperature β as ǫg (β). The generalization error of the optimal solution of (1) is assessed as ǫg (∞). Fig. 3 plots the ǫLOO evaluated by the solutions of SA (symbols) and the RS evaluations of ǫg (∞) (full curve) and ǫg (βAT ) (red broken curve), against ρ = K/N . Here, βAT is the critical inverse temperature at which RSB occurs owing to the AT instability. The three plots accord fairly well with one another in the left of their minimum point ρ∗ ∼ 0.063, whereas there are considerable discrepancies between ǫg (∞) and the other two plots for ρ > ρ∗ .
The discrepancies are considered to be caused by RSB. For β > βAT , the MC dynamics tends to be trapped by a metastable state. This makes it difficult for SA to find the global minimum of ǫ(c), which explains why the SA’s results are close to ǫg (βAT ). Fortunately, this trapping works beneficially for the present purpose of raising the generalization ability by lowering ǫg , as seen in Fig. 3. As far as we have examined, for fixed ρ, ǫg (βAT ) never exceeds the RS evaluation of ǫg (∞) and is always close to ǫLOO of SA’s results. These imply that the generalization ability achieved by tuning K = N ρ using the SA-based CV is no worse than that obtained when CV is performed by exactly solving (1) for LOO systems. This is presumably because, for a large ρ, the optimal solution of (1) overfits the observed (training) data and its generalization ability becomes worse than that of x(c) typically sampled at appropriate values of β(< ∞). B. Application to a real-world data set We also applied our SA-based analysis to a data set from the SuperNova DataBase provided by the Berkeley Supernova Ia program [23], [24]. Screening based on a certain criteria yields a reduced data set of M = 78 and N = 276 [25]. The purpose of the data analysis is to select a set of explanatory variables relevant for predicting the absolute magnitude at the maximum of type Ia supernovae by linear regression. Following a conventional treatment of linear regression, we preprocessed both the absolute magnitude at the maximum (dependent variable) and the 276 candidates of explanatory variables to have zero means. We performed the SA for M = 78 LOO systems of the preprocessed data set. The result of one single experiment with varying K is given in Tables I and II. Table I provides the values of LOOE, which shows that ǫLOO is minimized at K = 2.
Possible statistical correlations between explanatory variables, which were not taken into account in the synthetic model in sec. IV-A, could affect the results of linear regression [26]. The CV analysis also offers a useful clue for checking this risk. Examining the SA results of M (= 78) LOO systems, we could count how many times each explanatory variable was selected, which could be used for evaluating the reliability of the variable [27]. Table II summarizes the results for five variables from the top for K = 1–5. This indicates that no variables other than “2,” which stands for color, were chosen stably, whereas variable “1,” representing light curve width, was selected with high frequencies for K ≤ 3. Table II shows that the frequency of “1” being selected is significantly reduced for K ≥ 4. These are presumably due to the strong statistical correlations between “1” and the newly added variables, suggesting the low reliability of the CV results for K ≥ 4. In addition, for K ≥ 4, we observed that the results varied depending on samples generated by the MC dynamics in SA, which implies that there exist many local minima in (3) of LOO systems for K ≥ 4. These observations mean that we could select at most only color and light curve width as the explanatory variables relevant for the absolute magnitude prediction with a certain confidence. This conclusion is consistent with that of [25], in which the relevant variables were selected by LASSO, combined with hyper parameter determination following the ad hoc “onestandard-error rule,” and with the comparison between several resulting models. V. S UMMARY We examined the abilities and limitations of simulated annealing (SA) for sparse approximation problem, in particular, when employed for determining degrees of freedom by cross validation (CV). Application to a synthetic model indicates that SA can find nearly optimal solutions for (1), and when combined with the CV framework, it can optimize the generalization ability. Its utility was also tested by application to a real-world supernova data set. Although we focused on the use of SA, samples at finite temperatures contain useful information for SAP. How to utilize such information is currently under investigation. ACKNOWLEDGMENTS This work was supported by JSPS KAKENHI under grant numbers 26870185 (TO) and 25120013 (YK). The UC Berkeley SNDB is acknowledged for permission of using the data set of sec. IV-B. Useful discussions with Makoto Uemura and Shiro Ikeda on the analysis of the data set are also appreciated. R EFERENCES [1] M. Elad, Sparse and Redundant Representations, Springer, 2010. [2] B.K. Natarajan, “Sparse approximate solutions to linear systems,” SIAM Journal on Computing, vol. 24, pp. 227–234, 1995.
[3] Y.C. Pati, R. Rezaiifar and P.S. Krishnaprasad, “Orthogonal matching pursuit: Recursive function approximation with applications to wavelet decomposition,” in 1993 Conference Record of The Twenty-Seventh Asilomar Conference on Signals, Systems and Computers, 1993, pp. 40–44. [4] R. Tibshirani, “Regression shrinkage and selection via the lasso,” Journal of the Royal Statistical Society: Series B (Methodological), vol. 58, pp. 267–288, 1996. [5] F. Krzakala, M. M´ezard, F. Sausset, Y. Sun and L. Zdeborov´a, “Probabilistic reconstruction in compressed sensing: algorithms, phase diagrams, and threshold achieving matrices,” Journal of Statistical Mechanics: Theory and Experiment, vol. 2012, pp. P08009 (1–57), 2012. [6] S. Kirkpatrick, C.D. Gelatt Jr and M.P. Vecchi, “Optimization by simulated annealing,” Science, vol. 220, pp. 671–680, 1983. [7] T. Obuchi and Y. Kabashima, “Sparse approximation problem: how rapid simulated annealing succeeds and fails,” arXiv:1601.01074. [8] W.K. Hastings, “Monte Carlo sampling methods using Markov chains and their applications,” Biometrika, vol. 57, pp. 97–109, 1970. [9] S. Geman and D. Geman, “Stochastic relaxation, Gibbs distributions, and the Bayesian restoration of images,” IEEE Transactions on Pattern Analysis and Machine Intelligence, vol. 6, pp. 721–741, 1984. [10] H.S. Seung, H. Sompolinsky, and N. Tishby, “Statistical mechanics of learning from examples,” Physical Review A, vol. 45, pp. 6056–6091, 1992. [11] M. Opper and O. Winther, “A mean field algorithm for Bayes learning in large feed-forward neural networks,” in Advances in Neural Information Processing Systems 9, 1996, pp. 225–231. [12] T. Obuchi and Y. Kabashima, “Cross validation in LASSO and its acceleration,” 2016, arXiv:1601.00881. [13] D. Homrighausen and D.J. McDonald, “Leave-one-out cross-validation is risk consistent for lasso,” Machine Learning, vol. 97, pp. 65–78, 2014. [14] J. Shao, “Linear model selection by cross-validation,” Journal of the American Statistical Association, vol. 88, pp. 486–494, 1993. [15] O. Bousquet and A. Elisseeff, “Stability and generalization,” Journal of Machine Learning Research, vol. 2, pp. 499–526, 2002. [16] C. Leng, Y. Lin and G. Wahba, “A note on the lasso and related procedures in model selection,” Statistica Sinica, vol. 16, pp. 1273– 1284, 2006. [17] K. Shalev-Shwartz, O. Shamir, N. Srebro and K. Sridharan, “Learnability and stability in the general learning setting,” in COLT 2009, 2009. [18] H. Xu and S. Mannor, “Sparse algorithms are not stable: a no-freelunch theorem,” IEEE Transactions on Pattern Analysis and Machine Intelligence, vol. 34, pp. 187–193, 2012. [19] Y. Nakanishi, T. Obuchi, M. Okada and Y. Kabashima, “Sparse approximation based on a random overcomplete basis,” arXiv:1510.02189. [20] J.R.L. de Almeida and D.J. Thouless, “Stability of the SherringtonKirkpatrick solution of a spin glass model,” Journal of Physics A: Mathematical and General, vol. 11, pp. 983–990, 1978. [21] T. Obuchi, K. Takahashi and K. Takeda, “Replica symmetry breaking, complexity, and spin representation in the generalized random energy model,” Journal of Physics A: Mathematical and Theoretical, vol. 43, pp. 485004 (1–28), 2010. [22] T. Obuchi, “Role of the finite replica analysis in the mean-field theory of spin glasses,” Ph. D thesis submitted to Tokyo Institute of Technology in 2010, arXiv:1510.02189. [23] “The UC Berkeley Filippenko Group’s Supernova Database,” http://heracles.astro.berkeley.edu/sndb/. [24] J.M. Silverman, M. Ganeshalingam, W. Li. and A.V. Filippenko, “Berkeley Supernova Ia Program – III. Spectra near maximum brightness improve the accuracy of derived distances to Type Ia supernovae,” Mon. Not. R. Astron. Soc., vol. 425, pp. 1889–1916, 2012. [25] M. Uemura, K.S. Kawabata, S. Ikeda and K. Maeda, “Variable selection for modeling the absolute magnitude at maximum of Type Ia supernovae,” Publ. Astron. Soc. Japan, vol. 67, pp. 55 (1–9), 2015. [26] D. Belsley, Conditioning Diagnostics: Collinearity and Weak Data in Regression, Wiley, 1991. [27] N. Meinshausen and P. B¨uhlmann, “Stability selection,” Journal of the Royal Statistical Society: Series B (Methodological), vol. 72, pp. 417–473, 2010.