Hans de Bruin and Hans van Vliet ... {hansdb,hans}@cs.vu.nl. Abstract. ..... Lang./Lib. Persistency. Broker. Single Channel. Multi. Channel. CLI (UCM). Flat Files ...
Scenario-Based Generation and Evaluation of Software Architectures Hans de Bruin and Hans van Vliet Vrije Universiteit Mathematics and Computer Science Department De Boelelaan 1081a, 1081 HV Amsterdam, The Netherlands {hansdb,hans}@cs.vu.nl
Abstract. Architecture conception is a difficult and time consuming process, requiring advanced skills from the software architect. The tasks of an architect are alleviated if means can be provided to generate architectures that can be evaluated with respect to functional and nonfunctional requirements. This paper discusses an approach for doing so. It centers around a rich feature-solution graph which captures the evolving knowledge about requirements and solution fragments. This graph is used to guide an iterative architecture development process.
1
Introduction
The architecture of a software system captures early design decisions. These early design decisions reflect major quality concerns, including functionality. We would obviously like to design our systems such that they fulfill the quality requirements set for them. Unfortunately, we in general do not succeed in doing so in a straightforward way. For that reason, we develop an initial architecture, meanwhile making tradeoffs between quality concerns. We next assess the architecture with respect to its qualities, as far as such is feasible. If necessary, the architecture is next adapted, and the assessment/adapt cycle is repeated. This paper is concerned with supporting this iterative process. In particular, we propose to use a rich feature-solution graph to capture the evolving knowledge about quality requirements and solution fragments. This graph is next used to guide the iterative architecture development process. Our approach to generating and evaluating software architectures combines and extends the following, widely accepted ideas: Architectural patterns. By capturing structural and behavioral aspects of (partial) design solutions together with their quality properties, we may hope to be able to design and reason about architectural solutions and their quality attributes. Attribute-Based Architectural Styles (ABASs) have been proposed as a means to do so. An ABAS combines an architectural style (such as a layered style) with certain quality characteristics (such as portability) [10].
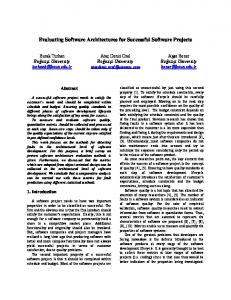
Scenario-based evaluation. Architecture evaluation is most often scenariobased. Different stakeholders are then asked to come up with scenarios of anticipated use. These scenarios may concern the present set of requirements as well as possible future extensions or changes. The latter are especially useful to assess the architecture with respect to structural aspects such as flexibility or modifiability. Well-known architecture assessment methods are SAAM (Software Architecture Analysis Method) [6] and its successor ATAM (Architecture Tradeoff Analysis Method) [7]. The emphasis in ATAM is on identifying interactions between various quality attributes in a system. So called tradeoff points, i.e. architectural elements to which multiple quality attributes are sensitive, require to be analyzed carefully. In later publications on ATAM, e.g. [8], attention has shifted from (ex-post) quality assessments to (ex-ante) architectural approaches with known quality properties, captured in ABASs. Goal-oriented requirements engineering. Early approaches to requirements engineering focussed on eliciting and documenting the requirements sec, and not the reasons for them. In goal-oriented requirements engineering, the relation between goals and requirements is represented explicitly. Since goals may conflict, this requires resolution strategies to obtain a satisfactory compromise [11, 12]. Recently, representation schemes used in goal-oriented requirements engineering have also been used to represent dependencies between quality goals and architectural styles [4]. In our approach, the generation of a software architecture is based on a rich feature-solution graph, which connects quality requirements with solution fragments at the architectural level. The structure of this feature-solution graph resembles that of the goal-hierarchy in goal-oriented requirements engineering. The solution fragments included in this graph have much in common with ABASs. This approach is made concrete as follows (see also Figure 1): Scenario-based architecture description. Software architectures are described using a scenario-based modeling technique called Use Case Maps (UCM) [3, 2]. UCM is a diagrammatic modeling technique to describe behavioral and to a lesser extent structural aspects of a system at a high (e.g., architectural) level of abstraction. UCM provides stubs (i.e., hooks) where the behavior of a system can be varied statically at construction time as well as dynamically at run time. These stubs provide the basis for generating alternative software architectures with so called architectural snippets, which are basically small, reusable UCM scenarios. Architecture generator. An architecture generator generates a candidate software architecture. It does so on the basis of the feature-solution graph that establishes the connection between quality requirements and solutions. The generator uses the graph to fill in UCM stubs with appropriate architectural snippets. This can be seen as the equivalent of an aspect weaver found in aspect-oriented programming systems [9]. Scenario-based evaluation. Once an architecture has been generated, it must be evaluated on the basis of UCM scenarios to assess whether they meet non-
functional requirements. For a number of quality attributes, this can be done automatically. Other attributes require the expert eye of a software architect.
Feature-Soulution Graph Features: Functional and Non-Functional Requirements Solutions: Scenario-Based Reference Architecture (UCM with Stubs), and Architectural Snippets (UCM Plug-Ins)
Generator no solution
Software Architect Expertise
Generated Software Architecture
Scenario-Based Evaluator done
Fig. 1. The process of generating and evaluating architectures.
But do not stop here. An interesting extension to the above scheme is to automatically refine architectures on the basis of evaluation outcomes. Suppose, for example, that a certain non-functional requirement has not been met in the current architectural solution. By consulting the feature-solution graph, we might come up with several solutions that can be applied to remedy the shortcoming. Thus, in principle, the outcome of the evaluation phase can be used to drive the architecture generation process in the next iteration. That is, the generator selects a solution and then generates a refined architecture, which is evaluated in its turn. This process is repeated until all requirements are met or we run out of potential solutions. The idea to generate architectures driven by functional as well as nonfunctional requirements is not new. Work in frame technology [1], the framework
for non-functional requirements discussed in [14], and aspect-oriented programming [9], have similar objectives. What sets our approach apart is that we use a scenario-based modeling technique in combination with a rich feature-solution graph. Generated architectures are evaluated using scenario-based evaluation techniques. The evaluations might trigger further optimizations in the generated architectures, using the knowledge captured in the feature-solution graph. These optimizations are then evaluated again using the same set of scenarios. In this way, we get a closed loop process, occasionally requiring the architect’s expertise. In this paper, we restrict ourselves mostly to behavioral aspects such as functionality, security, and performance. There are no principal reasons for not supporting structural aspects, such as flexibility, integrability, and modifiability, as well. However, the notation that we use for architecture description needs to be extended to cater for the latter aspects. This paper is organized as follows. Section 2 introduces a running example used to illustrate our approach. The major architectural design dimensions for this problem are discussed in section 3. A feature-solution graph for the example system is given in section 4. We discuss how the graph is used to generate and evaluate architectures. Section 5 then elaborates several candidate architectures for the example system, using the knowledge captured in the feature-solution graph. Section 6 gives our conclusions. Finally, a brief introduction to Use Case Maps can be found in Appendix A.
2
Running Example: Resource Management (RM) System
A generic Resource Management (RM) system is used as a running example. The conceptual model of the RM system is depicted in Figure 2. The basic idea is that a customer can reserve a resource that can be taken up later on. Resources are being described in resource types. The RM system can be seen as an abstraction for a collection of information systems that all share the concept of claiming resources. For instance, in a hotel reservation system, the resources are rooms, whereas in a car rental system, the resources are cars.
Customer 1
Reservation * 1 -period: DateRange -price: Money -serviceLevel: Agreement 1
*Resource * describes 1
*ResourceType
Fig. 2. Conceptual model of the Resource Management System.
Typically, a RM system provides the following, basic functionality: – Make/Cancel/Amend/Take-up Reservation; – Add/Remove/Amend Resource or ResourceType. A RM system is not necessarily restricted to serve one company. It is perfectly possible to share resources amongst companies, or alternatively to acquire resources from other companies as in the case of Business-to-Business (B2B) applications. A resource type object can then include functionality for locating resources outside the scope of a company. Yet another possibility is that a resource type object acts as a broker or connects to a broker to find the best offer amongst a number of resource providers.
3
Exploring Design Dimensions for the RM System
The 3-tier reference architecture is frequently used as a starting point in devising architectures for classes of information systems, such as the RM system. As the name suggests, the 3-tier reference architecture is composed of three layers: – User Interface (UI) layer, alternatively called presentation or medium layer; – Business Logic (BL) layer, alternatively called transaction or workflow layer; – Data Management (DM), alternatively called application or abstraction layer. The characteristics of the 3-tier architecture are flexibility, scalability, user independence, availability, and low upgrade costs. On the downside, the architecture can suffer from performance problems and may involve high initial costs [16]. Frequently, the layers are further divided, resulting in a n(> 3)-tier architecture. These decompositions depend on both functional and non-functional requirements. We will now discuss a number of alternatives for each layer. The intent is not to show every conceivable alternative, but rather to indicate that even in a relatively simple system, the design choices grow rapidly. In addition, we show that a decomposition in one layer might have an impact on other layers. Hence we need a kind of architecture generator to assure that the effects of a decomposition are properly effectuated in other layers as well. This can be seen as the counterpart of aspect weaving in aspect-oriented programming systems. 3.1
User Interface (UI) Layer
The UI layer is responsible for interacting with the user. The term user should be interpreted in a broad sense. It could be a real user, interacting with, for instance, a Graphical UI (GUI) or a Command Line Interface (CLI). In case of B2B interaction, it could also be another system that manipulates reservations for particular resources maintained by the system. A typical technique for B2B interaction is XML.
The logical UI layer may be split in two physical layers for WEB enabling. One side runs the WEB browser, whereas the other side generates HTML pages and reacts to HTTP requests. Offering public access to the system by using Internet technology (e.g., XML and HTML) typically imposes non-functional requirements in the areas of security and performance. As a result, the UI layer must be further refined to deal with these aspects. 3.2
Business Logic (BL) Layer
The BL layer manages the interactions between the UI and the DM layer. It can be thought of as a workflow layer, realizing the automated business processes. The BL layer abstracts away from media peculiarities, which are handled by the UI layer. It rather provides media independent workflow and dialogue handlers (sometimes called system services) with hooks to connect to the UI layer. The BL layer is built on the abstractions provided by the DM layer. Typically, the interface to the DM layer is composed of an OO class model (e.g., a slightly less abstract class model than shown in Figure 2) and a number of elementary, system services (e.g., elementary use cases for basic object manipulations). There is not always a real need for a BL layer. For simple applications that support only elementary services, the BL layer can be skipped. In that case, the UI layer calls on the OO abstractions provided by the DM layer directly, and vice versa. Even if complex services are provided by the system, the BL layer can be virtually non-existent. That is, the BL and DM layer are effectively merged into one layer. This is typically the case when a “pure” object-oriented approach is followed, where data and business logic are tightly integrated into objects. 3.3
Data Management (DM) Layer
Many degrees of freedom exist for realizing the DM layer, to name a few: – interface with a relational or object DBMS; – use the persistency features of a programming language or library; – read from and write to flat files. The objects in the DM layer do not necessarily reside in the same system. As discussed before, resources may be shared (temporarily) amongst a number of systems, as is the case in B2B applications. An object like resource type then fulfills the role of resource locator or broker. The extended interpretation of resource type has impact on other layers. For instance, a broker can request several resource providers to come up with an offer within a certain period. In that case, a user will not get an immediate response, but rather a notification (e.g., an e-mail) after the bidding period has been elapsed. To put it differently, implementing broker functionality crosscuts the functionality offered in the various layers.
4
Generating and Evaluating Architectures
The starting point for generating and evaluating architectures is first to derive feature dependencies, which in their turn spark of solutions in the form of architectural snippets to be placed in UCM stubs. The feature-solution dependencies are captured in the feature-solution graph. We make a clear distinction between features (i.e., requirements) and the design particles that provide solutions by defining the following two spaces: Feature space describes the desired properties of the system as expressed by the user. Solution space contains the internal system decomposition in the form of a reference architecture composed of components. In addition, the solution space may also contain general applicable solutions that can be selected to meet certain non-functional requirements. A feature-solution graph for the RM system is given in Figure 3. It is composed of the usual AND-OR decompositions to denote combinations and alternatives of features and solutions. We use an AND decomposition to denote that all constituents are included, an OR to select an arbitrary number of constituents, and an EXOR to select exactly one constituent. Besides the AND-OR relationships, the graph contains directed selection edges (represented by a solid curve that ends with a hollow pointer) to establish the connection between features and solutions. Thus, a feature in the feature space selects a solution in the solution space. A solution may be connected by selection edges to more detailed, general applicable solutions (e.g., design patterns). That is, solutions are found by determining the transitive closure of selection edges originating from the feature space. In some cases, it is useful to outrule a solution explicitly. This is done with negative selection edges (represented by a dashed curve that ends with a hollow pointer). For example, if we want high flexibility, then the BL layer should not be integrated in the DM layer, since merging both layers makes it more difficult to adapt the business logic. It is interesting to observe that the feature-solution graph contains tradeoff knowledge. For example, the features “high flexibility” and “medium and high performance” give rise to a clash in the sense that for flexibility reasons the BL and DM layer should be separated, whereas for performance reasons they should be integrated. Other indications of tradeoff points can be found when two or more solutions in an OR decomposition are selected simultaneously, that is, their selection stems from distinct feature choices. For understanding the process of generating and evaluating architectures, recall the scheme given in Figure 1. The architecture generator is driven by the feature-solution graph. Some features can be selected directly on the basis of the requirements. For instance, we might require a high level of flexibility. As a result, the non-functional requirement “Flexibility” in the feature space is set to “High”. The implication of this decision is that the BL and DM layer may
Fig. 3. Feature-Solution graph. AND
Prog. Lang./Lib. Persistency
EXOR
Low
Data Management
Flat Files
...
Standards/ Constraints
Supplier
OR
DBMS
Medium
Flexibility
Low
DEFAULT
EXOR
User Req.
High
EXOR
Medium
User Req.
High
EXOR
Medium
GUI
CLI
User Req.
WEB Enabled
Feature Space
*
High User Req.
WEB
EXOR
Multi Channel
Medium
EXOR
Channel
Security
Performance
Low
OR
Traits
Single Channel
Broker
B2B
AND
Functional
Add/Remove/Amend Resource or ResourceType
Make/Cancel/Amend/Take-up Reservation
AND
Use Cases
AND
Non-Functional
AND
Requirements
EXOR
Elementary Services (UCM)
System Services (UCM)
EXOR
BL Layer OR
Broker (UCM)
OR
Concurrent (UCM)
Serialized (UCM)
EXOR
Access
DBMS (UCM)
Prog. Lang./Lib. Persistency (UCM)
Flat Files (UCM)
EXOR
Storage
DM Layer
Integrated in DM Layer (UCM)
Encryption (UCM)
...
...
BL-DM Interface
Integrated
Service Level
OR
Security
EXOR
UI-BL Interface
AND
3-Tier Architecture (UCM)
Network
Firewall (UCM)
E-mailer (UCM)
WEB (UCM)
CLI (UCM)
GUI (UCM)
XML (UCM)
*
EXOR
WEB Enabled
Medium
*
UI Layer
Integrated
Solution Space
not be merged. For some requirements, the required level of support is harder to determine. Consider, for example, performance. A performance requirement might be that a “Make Reservation” takes less than a second. However, it is not clear from the outset which performance level in the feature-solution graph will satisfy the performance requirement. So as an initial guess, we set the performance to “Low”, since this results in less constraints on the design than higher performance levels. The software architecture then has to be evaluated in order to assess whether the performance requirement is satisfied or not. If not, the outcome of the evaluation process will result in setting the performance to a next level (i.e., “Medium”). The next step is to generate a new architecture, and so on, until all requirements are satisfied, or we reach the conclusion that the requirements are too strict. To summarize the closed-loop process: The non-functional features can be set to a required level, in our example ranging over “Low”, “Medium”, and “High”. A level for a particular feature selects solutions, providing the basis for generating a candidate software architecture. The required level of some features (e.g., flexibility in our example) can be determined directly from the requirements, whereas others must be determined from evaluations (e.g., performance). To put it differently, the feature levels are the knobs with which the architecture can be fine-tuned. Notice that the feature-solution graph is typically underspecified in the sense that not all (EX)OR decomposition are necessarily connected by selection edges. In this way, we have created degrees of freedom for generating design alternatives.
5
Elaborating Architectures for the RM System
In previous sections, we have sketched design dimensions and we have shown how requirements and design alternatives can be connected in a feature-solution graph. We are now in the position to show how the graph can be applied to actually generate architectures for the RM system. To this end, we need some kind of architectural description language, ideally a diagrammatic language that focuses on the larger, architectural issues. The Use Case Map (UCM) notation suits this purpose well1 . It is a scenario-based technique for capturing behavioral and to a lesser extent structural aspects of an architecture. UCMs can be used for analysis purposes. For instance, in [15] a method is discussed for performance evaluations, and [5] discusses a scenario-based approach for assessing behavioral system properties such as deadlock and reachability. In the solution space of the feature-solution graph, some solutions in the decomposition tree are marked as UCM. These solutions represent UCM stubs and plug-ins with which an candidate architecture is composed. The principles are demonstrated by taking the “Make Reservation” use case as an example. 1
For readers who are unfamiliar with UCMs, a short introduction can be found in Appendix A.
5.1
Filling in the Layers
The 3-tier reference architecture is described in terms of a UCM, which is composed of 5 stubs (see Figure 4). Three stubs correspond with the UI, BL, and DM layer, whereas the remaining two model the interface between the UI-BL and the BL-DM layer. As discussed before, a stub can be seen as a placeholder where architectural snippets (i.e., UCM fragments) can be plugged in. The default plug-ins for the stubs do no implement functionality, they simply pass information from their start points to their end points.
IN1
OUT2
UI Layer
OUT1
IN2
UI-BL IN1 OUT2
OUT1 Interface
IN2
IN1
IN1
BL layer
OUT2
OUT1
OUT2
IN2
UI
IN1 BL-DM
OUT1 Interface
IN2
IN1
DM layer
OUT1
OUT1
OUT2
IN2
.. . IN1
BL-DM
OUT2
IN1
OUT1
IN2
DM
OUT1
Fig. 4. Reference architecture.
UI layer We assume that a multi channel, WEB enabled UI is selected (see Figure 5). That is, multiple users may use the reservation system simultaneously.
BL layer The business logic for making a reservation is quite simple. It basically passes on requests from the UI layer to the DM layer and vice versa. To put it differently, the default BL plug-in can be used for the time being.
WEB Browser OUT1
IN1
IN1
OUT1
UI Layer’ OUT2
OUT2
IN2
IN2
Fig. 5. User Interface Layer.
DM Layer We will make use of a DBMS. For making a reservation, the DM layer first checks the database whether the resources can be acquired or not. If they can be acquired, the database is updated accordingly and the DM layer sends an acknowledgement as a result, otherwise a negative acknowledgement is returned immediately. These two scenarios are captured in the UCM shown in Figure 6.
IN1
Database Access
IN1
DM layer’ OUT1
OUT2
DBMS
OUT1 IN2
Fig. 6. Data Management layer.
5.2
Feature Interaction
Assume that we require a high level of security. According to the feature-solution graph, this translates into protecting access to the reservation system with a firewall and using encrypted messages between the UI layer and the rest of the system. The process of composing the UI-BL interface with encryption and a firewall is shown in Figure 7. In the first step, the UI-BL interface stub is replaced by encryption/decryption components and a stub called UI-BL interface’. The latter stub in its turn is replaced by a firewall component and the UI-BL interface” stub. The default behavior for a stub is to do nothing, that is, there is a path from IN1 to OUT1 and another one from IN2 to OUT2. Notice that the order of substitution is important. The architecture generator must be prepared to generate different sequences. The approach of recursively replacing stubs with plug-ins resembles the concept of composition filters used in the programming language SINA [13]. The composition filter model consists of input and output filters that surround an object and affect the messages sent
OUT1
IN1
UI-BL Interface IN2
OUT2
IN1
Encryptor/Decryptor 2
Encryptor/Decryptor 1 IN1
OUT2
UI-BL Interface’
OUT2
IN1
UI-BL Interface’’
OUT2
OUT1
Firewall
OUT1
IN2
IN2
OUT1
IN1 OUT2
IN1
IN2
IN2
OUT2
IN1
OUT1
OUT1
Encryptor/Decryptor 1
IN2
Firewall
Encryptor/Decryptor 2
OUT2
OUT1
IN2
Fig. 7. Composition of design solutions.
to and received by that object. Composition filters can be seen as objects in the role of proxies that perform additional pre- and post-processing. Now that the UI-BL interface layer is secured, the new architecture can be evaluated to assess other non-functional requirements. Suppose that because of the security measures that have been taken the performance degrades to an unacceptable level. This means that the architecture must be enhanced in order to improve the performance. One option is to skip the BL layer altogether and to integrate it with the DM layer. But this has a negative impact on flexibility, and this solution is explicitly prohibited if a high level of flexibility is required. Another option is to increase the amount of parallelism in the BL layer, so that it can handle multiple requests simultaneously, instead of serializing them. This solution is shown in Figure 8.
BL Layer IN1
OUT1
OUT2
IN2
Fig. 8. Parallelizing the Business Logic layer.
5.3
Crosscutting Layers
Suppose we want to extend the reservation system with B2B functionality in the sense that resources may be acquired from other parties if they cannot be obtained from the system itself (see Figure 9).
IN1
DM layer’ OUT1
IN1
DBMS
Database Access
IN1
OUT2
OUT1 IN2
OUT1 IN1
DM layer’’
OUT1
IN2 OUT2
OUT2
IN2
B2B Broker
B2B Parties
DBMS’
Fig. 9. Data Management layer extended with B2B broker functionality.
In this example, a broker is used to select a best offer amongst the parties involved. This takes time, and for this reason, an AND-fork is introduced, with one branch sending back a reply immediately indicating that the broker process is in progress, and the other branch doing the actual brokering followed by updating the database if a resource has been acquired. Notice that this splitting has impact on the BL and UI layer. An advance “brokering-in-progress” message can be sent as an immediate response to the user, whereas the actual result of the broker process can be used for sending a notification to the user, for instance, in the form of an e-mail (see Figure 10).
WEB Browser OUT1
IN1
IN1
OUT1
UI Layer’ OUT2
OUT2
IN1
OUT2
IN1
OUT2
UI Layer’’
IN2
OUT1
IN2
OUT1
IN2
IN2
e-mailer
Fig. 10. User Interface layer extended with an e-mailer.
6
Concluding Remarks and Future Work
We have discussed a closed loop process for generating and evaluating software architectures. At the heart of the process is the feature-solution graph, which combines AND-OR feature and solution decompositions with (negative) selection relationships. The feature-solution graph connects quality requirements with design alternatives. In addition, it can be used to pinpoint tradeoffs between quality attributes such as flexibility and performance, as shown in this paper. The architectural description language that is being used to specify architectures is actually of secondary importance. In this paper, we make use of Use Case Maps (UCM) because of its scenario-based, visualization, and abstraction properties. Especially its abstraction mechanism in the form of stubs and plugins provides the means to specify extensible software architectures. Although
UCMs are well-suited for modeling behavioral aspects of a system, they are less equipped for structural aspects. For this reason, the notation has to be extended, or alternatively other notations should be used beside UCM, to cover the full spectrum of architectural description. Nevertheless, in our present work, UCM serves our purpose well and, in our opinion, it is only a minor step to add new relationships between components along with appropriate viewpoints to cater for yet unattended structural aspects. In the near future, we want to investigate tool support for looping through the generate-evaluate cycle. One possible solution is to encode the feature-solution graph as Prolog facts, goals, and clauses. This requires that further attention is given to the precise semantics of the constructs in the feature-solution graph. We can use the resolution mechanism of Prolog to produce solutions, i.e., software architectures that satisfy the requirements set. To determine whether a certain Prolog goal is satisfied or not translates to architecture evaluation with respect to a corresponding quality attribute. In addition, intelligent help can be provided to guide the architect in preparing the next iteration. We envisage that the feature-solution graph can be further enriched with relationships and annotations to accurately capture domain and architectural knowledge and the connection between them. In this way, we build a body of knowledge that can be applied to similar problems.
References 1. Paul G. Basset. Framing Software Reuse: Lessons from the Real World. Prentice Hall, Upper Saddle River, New Jersey, 1996. Yourdon Press. 2. R.J.A. Buhr. Use Case Maps as architecture entities for complex systems. IEEE Transactions on Software Engineering, 24(12):1131–1155, December 1998. 3. R.J.A. Buhr and R.S. Casselman. Use CASE Maps for Object-Oriented Systems. Prentice Hall, Upper Saddle River, New Jersey, 1996. 4. L. Chung, D. Gross, and E. Yu. Architectural design to meet stakeholder requirements. In P. Donohue, editor, Software Architecture, pages 545–564. Kluwer Academic Publishers, 1999. 5. Hans de Bruin. Scenario-based analysis of component compositions. In Greg Butler and Stan Jarzabek, editors, Proceedings of the Second Symposium on Generative and Component-Based Software Engineering (GCSE’2000), Erfurt, Germany, Lecture Notes in Computer Science (LNCS), pages 1–18, Berlin, Germany, October 9–12, 2000. Springer-Verlag. 6. R. Kazman, G. Abowd, L. Bass, and P. Clements. Scenario-based analysis of software architecture. IEEE Software, 13(6):47–56, 1996. 7. R. Kazman, M. Klein, M. Barbacci, T. Longstaff, H. Lipson, and J. Carriere. The architecture tradeoff analysis method. In Proceedings of the 4th International Conference on Engineering of Complex Systems (ICECCS98), pages 68–78. IEEE CS Press, 1998. 8. R. Kazman, M. Klein, and P. Clements. ATAM: Method for architecture evaluation. Technical report, CMU/SEI-2000-TR-004, 2000. 9. Gregor Kiczales, John Lamping, Anurg Mendhekar, Chris Maeda, Cristina Videira Lopes, Jean-Marc Loingtier, and John Irwin. Aspect-oriented programming. In
10.
11.
12.
13. 14.
15.
16.
M. Askit and M. Matsuoka, editors, Proceedings of 11th European Conference on Object-Oriented Programming (ECOOP’97), Finland, volume 1241 of Lecture Notes in Computer Science (LNCS), pages 220–242, Berlin, Germany, June 9– 13, 1997. Springer-Verlag. M.H. Klein, R. Kazman, L. Bass, J. Carriere, M. Barbacci, and H. Lipson. Attribute-based architectural styles. In P. Donohue, editor, Software Architecture, pages 225–244. Kluwer Academic Publishers, 1999. Axel van Lamsweerde. Requirements engineering in the year 00: A research perspective. In Conference Proceedings ICSE’00, pages 5–19, Limerick, Ireland, 2000. ACM. John Mylopoulos, Lawrence Chung, Stephen Liao, Huaiqing Wang, and Eric Yu. Exploring alternatives during requirements analysis. IEEE Software, 18(1):92–96, January 2001. TRESE project. WWW: http://trese.cs.utwente.nl/sina/. Nelson R. Rosa, George R.R. Justo, and Paulo R.F. Cunha. A framework for building non-functional software architectures. In Proceedings of the 16th ACM Symposium on Applied Computing (SAC’2001), pages 141–147, Las Vegas, Nevada, USA, March 11–14, 2001. W.C. Scratchley. Evaluation and Diagnosis of Concurrency Architectures. PhD thesis, Department of Systems and Computer Engineering, Carleton University, 2000. A. Umar. Object-Oriented Client/Server Internet Environments. Prentice Hall, Englewood Cliffs, New Jersey, 1997.
A
A Brief Introduction to Use Case Maps
A UCM is a visual notation for humans to use to understand the behavior of a system at a high level of abstraction. It is a scenario-based approach showing cause-effects by traveling over paths through a system. UCMs do not have clearly defined semantics, their strong point is to show how things work globally. The basic UCM notation is very simple. It consists of three basic elements: responsibilities, paths and components. A simple UCM exemplifying the basic elements is shown in Figure 11. A path is executed as a result of the receipt of an external stimulus. Imagine that an execution pointer is now placed on the start position. Next, the pointer is moved along the path thereby entering and leaving components, and touching responsibility points. A responsibility point represents a place where the state of a system is affected or interrogated. The effect of touching a responsibility point is not defined since the concept of state is not part of UCM. Typically, the effects are described in natural language. Finally, the end position is reached and the pointer is removed from the diagram. A UCM is concurrency neutral, that is, a UCM does not prescribe the number of threads associated with a path. By the same token, nothing is said about the transfer of control or data when a pointer leaves one component and (re-)enters another one. The only thing that is guaranteed is the causal ordering of executing responsibility points along a path. However, this is not necessarily a temporal ordering, the execution of a responsibility point may overlap with the execution of subsequent responsibility points. Start Components End r5
r1
r2
r4
Pointer
r3
Path
Fig. 11. UCM basic elements.
A more realistic example is shown in Figure 12 depicting a distributed clientserver system. Because the client communicates with the server over a network that can fail occasionally, a proxy server is included to provide transparent access to the real server. The proxy server is modeled as a stub for which two implementations are given: a transparent proxy server which passes the requests to and the replies from the server unaltered thereby denying the possibility of network failures, and a proxy server with a timeout facility with which failures are detected. The notation used in the figure is supposed to be self-explanatory.
Client
Proxy Server a
Network
Server
b
Notation
Proxy Server Stub
OR-join c
d
Watchdog Proxy Server a
b
d
c
OR-fork
b
a
continuing path
continuing paths waiting place (with timeout)
timeout path
clearing path
null c
Transparent Proxy Server
entering path
d
Fig. 12. Distributed Client-Server UCM.
AND-fork failure point (possible failure)