Eurographics Symposium on Point-Based Graphics (2007) M. Botsch, R. Pajarola (Editors)
Self-Similarity-Based Compression of Point Clouds, with Application to Ray Tracing Erik Hubo † Tom Mertens† Tom Haber† Philippe Bekaert† Hasselt University, Expertise Centre for Digital Media, transnationale Universiteit Limburg , Wetenschapspark 2, BE-3590 Diepenbeek, Belgium
Abstract Many real-world, scanned surfaces contain repetitive structures, like bumps, ridges, creases, and so on. We present a compression technique that exploits self-similarity within a point-sampled surface. Our method replaces similar surface patches with an instance of a representative patch. We use a concise shape descriptor to identify and cluster similar patches. Decoding is achieved through simple instancing of the representative patches. Encoding is efficient, and can be applied to large datasets consisting of millions of points. Moreover, our technique offers random access to the compressed data, making it applicable to ray tracing, and easily allows for storing additional point attributes, like normals. Categories and Subject Descriptors (according to ACM CCS): I.3.5 [Computer Graphics]: Computational geometry and object modeling - Curve, surface, solid and object representations; E.4 [Data]: Coding and information theory - Data compaction and compression
1. Introduction With the increasing capability of 3D data scanning devices, point set surfaces are increasingly popular. The amount of acquired geometric information gives rise to an equally growing demand for data that needs a compressed representation to be stored, transmitted, processed and rendered efficiently. Even though using points lessens storage requirements (connectivity information is not needed), compression of massive models is still required to facilitate efficient rendering [RL00, KSW05, HMHB06, YLM06]. We present a compression technique that is particularly useful in the context of rendering massive datasets. In particular, we focus on ray tracing, as its performance is less dependent on scene complexity compared to forward rendering algorithms based on rasterization or splatting [Wal04]. The size of datasets we are interested in may exceed main memory. As a result, performance sporadically and unexpectedly stalls when data is needed that still resides on
†
[email protected] c The Eurographics Association 2007.
disk [PKGH97, YLM06]. Our compression reduces the size of such a dataset in order to fit in main memory. Research on geometry compression, including point clouds, has mainly focused on high compression rates so far. Most of the existing point cloud compression strategies perform decoding in a streaming or sequential fashion, which is suitable for rasterization-based display algorithms, and also enables progressive transmission (e.g. [BWK02, KSW05]). On the other hand, little attention has been given to the property of random accessibility [KCL06], which enables decoding a local part of the compressed data without having to decode the full dataset. This is similar to audio and video compression [MPFL96], where the data stream has to be reconstructed from any given point in time. The random access property is essential in combination with ray tracing, as point information has to be queried locally [HMHB06]. We introduce a compression technique based on geometric self-similarity. Many real-world surfaces consist of repetitive patterns and similar structures, such as creases, ridges, bumps, smooth parts, etc. A similar assumption was also used in a recent image processing algorithm [BM05]. Also, the typically uniform sampling rate of scanned objects con-
Erik Hubo / Self-Similarity-Based Compression of Point Clouds,with Application to Ray Tracing
tributes to self-similarity. To exploit repetitiveness, we segment the object into well-chosen patches and we cluster patches that “look alike”. Similar patches can then be represented by a single patch. Finally, the decoding process simply boils down to instancing. This can be viewed as an extension to the idea of vector quantization [LBG80]. The main difficulty is to efficiently describe and search these similar patches in the huge data set. Therefore we introduce a compact geometric patch descriptor, which will guide the clustering process. An important feature of our compression scheme is that it easily affords random access, which makes ray tracing possible without the need of a full decoding step. Our method is designed for compressing real-world surfaces, ideally with a uniform sampling rate, like those obtained from a laser scanner. Its performance is dependent on the degree of geometric self-similarity, and assumes that the point cloud represents a 2D surface (as opposed to a 3D scatter plot, for instance). 2. Related Work Compression: We restrict our discussion to point cloud compression. A good overview of recent mesh compression techniques is given by Alliez and Gotsman [AG05]. In the QSplat framework [RL00], compactness is achieved by quantizing the offsets in each hierarchy node using a fixed length bit string. Botsch et al. [BWK02] propose to quantize points onto an integer lattice, and represent them in a sparsely populated octree. Gandoin et al. [GD02] propose a similar coding technique, but employ a kD-tree instead. Huang et al. [HPKG06] and Schnabel et al. [SK06] discuss an improved octree-based coder by incorporating prediction. Fleishman et al. [FCOAS03] using Moving Least Squares (MLS) in conjunction with progressive coding. Waschbüsch et al. [WGE∗ 04] proposed multi-resolution predictive coding. Krüger et al. [KSW05] quantize onto a 3D hexagonal grid. The model is sliced into 2D contours which are coded linearly as the trajectory throughout the hexagonal grid, and can be decoded efficiently on graphics hardware. Gumhold et al. [GKIS05] and later Merry et al. [MMG06] use an approach based on spanning trees to sequentially encode points. Ochotta et al. [OS04] partition points into nearplanar segments in which the surface is regularly resampled and stored as a height field. Each height field is compressed using wavelets. Our technique also segments the surface, but we replace similar patches by a single representative patch. Unfortunately, previous techniques do not allow random accessibility, needed for ray tracing (see Section 1), without decompressing the full dataset in main memory. Predictive coding approaches [WGE∗ 04, KSW05, GKIS05, MMG06] always rely on previous points in the sequence during decompression. The techniques based on hierarchical spatial subdivision [RL00,BWK02,GD02,HPKG06,SK06] also require to decode the full set because the trees do not contain pointers anymore to reduce memory footprint. To our knowledge the only point cloud compression tech-
nique that allows random accessibility is the Quantized kD-tree [HMHB06]. It achieves compression by quantizing the splitting planes of a kD-tree which contains the data set. However, the Quantized kD-tree only stores positions, whereas our technique can easily compress additional attributes like normals. Ray Tracing: Most of the work in ray tracing is focused on displaying triangle meshes. A discussion of these methods is beyond the scope of this paper and we refer to Wald’s Ph.D thesis for an overview [Wal04]. Several authors have proposed methods to compute intersections with a pointsampled surface. Key in ray tracing points is to “fill in the gaps” between points. This can be done either based on heuristics [SJ00], or using a formal surface definition. The latter is usually realized using Moving Least Squares (MLS) [Lev03, AA03], which locally fits a high order polynomial surface to the points. Simple variants of MLS can be very efficient [AA04, AKP∗ 05, WS05, HMHB06]. We will also use an MLS-based surface intersection in our implementation. Ray tracing extremely complex scenes can be realized through out-of-core techniques, i.e., by dynamically loading required parts of the dataset into main memory. To this end, Pharr et al. [PKGH97] and later Wald et al. [WDS04] developed an efficient technique that caches scene parts in main memory. Level-of-detail (LOD) techniques are also useful to speed up ray tracing massive data sets. Sung et al. [YLM06] use an LOD representation to reduce memory access. Even though these schemes are efficient, in the end disk access is still required, and stalls are unavoidable. Like the Quantized kD-tree [HMHB06], our compression scheme can further alleviate such problems by significantly reducing the memory footprint. Shape Matching: Our algorithm establishes similarities between patches using techniques inspired by shape matching. Shape matching is a well studied problem, with applications to surface registration [BM92] and 3D model retrieval [F∗ 03]. Two shapes can be compared directly using their geometry, e.g., using the Hausdorff distance. This turns out to be expensive if many shapes need to be compared. Researchers have therefore developed more concise geometric descriptors, which can be computed efficiently on a pershape basis, and compared afterward using a suitable norm. The simplest descriptors measure geometry-related statistics, such as moments [PR92], normal distributions [Hor84], and histograms of pairwise distances [AKKS99, OFCD02]. More elaborate descriptors automatically ignore the difference in rotation [F∗ 03], and explicitly analyze topology [HSKK01]. An important difference with existing work is that we do not wish to match entire surfaces, but only small surface patches. The topology of a patch is much simpler than typical full 3D models. We already achieve successful results with using a relatively simple descriptor based on the normal distribution of a patch [Hor84]. c The Eurographics Association 2007.
Erik Hubo / Self-Similarity-Based Compression of Point Clouds,with Application to Ray Tracing
e
D
P
a
t
c
h
S
e
g
m
e
n
t
a
t
i
o
P n
a
t
c
h
D
e
s
c
r
i
p
t
o
r
s
c
r
i
p
t
o
r
s
p
a
c
e
s G
r
o
u
p
S
i
m
i
l
a
r
P
a
t
c
h
e
s
C
o
d
e
B
o
o
k
I
n
s
t
a
n
c
i
n
g
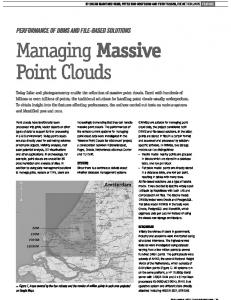
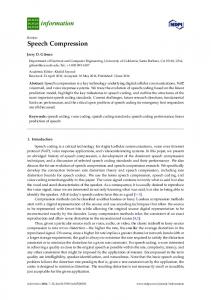
Figure 1: Overview of the compression scheme: we construct equally-sized patches (illustrated as different colors) and compute a shape descriptor for each patch. Next, we group patches with similar descriptors, pick a representative patch within each group and store it in a code book. Finally, we replace all patches by a reference to their corresponding representative patch.
3. Overview We give a short high-level overview of our compression technique (see Figure 1), before going on to the detailed description. The key idea is to exploit the typical repetitiveness of realworld surfaces, like recurring smooth parts, bumps, ridges, etc. To this end, we divide the surface into patches, and replace each one by a reference to an entry in a concise list of representative patches. We obtain patches by segmenting the surface. This segmentation favors patches that are equallysized, which makes the comparison more meaningful. Also, patches are encouraged to lie on salient geometric features, in order to improve the likelihood of finding a similar and well-aligned match. Similar patches are then clustered in order to form a compact code book, in the same spirit as vector quantization [LBG80]. We create clusters by selecting a representative patch, and adding all similar candidates. Unsuitable candidates are re-clustered. We repeat this process on the remainder of the patches until all belong to a cluster. Finally, each representative patch will form an entry (or word) in the code book, while replacing all cluster members by a reference to this entry. The clustering process requires a means of comparing patches against each other for measuring similarity. Comparison should be implemented efficiently, in order to deal with large datasets. Patches consist of a small set of points, which could be compared using the Hausdorff distance, for instance. However, this is cumbersome and slow, and it is not clear how to use this distance measure in conjunction with an efficient nearest neighbor acceleration structure. We therefore compute a simple statistical shape descriptor for each patch, which essentially translates the patch to a representative vector that can be compared directly. We also take care in aligning the patches. First, we normalize the orientation of each patch before clustering. c The Eurographics Association 2007.
Once a patch has been assigned to a cluster, we further refine alignment using a surface registration algorithm [BM92]. 4. Self-Similarity-Based Compression In this section we discuss every phase of the algorithm in more detail. We first segment the surface to obtain patches, we compute patch descriptors, and cluster them to construct the code book. 4.1. Patch Creation Patch creation is driven by a simple segmentation strategy, which respects two objectives: 1. Equal size, convexity and isotropy The matching process becomes more meaningful if patches have equal area, are similarly shaped (i.e. round), and have no holes. For instance, it does not make sense to compare a slivery patch to a round one, since they cannot be replaced by each other in the first place. 2. Feature Attraction Two patches may contain the same geometric feature (e.g., ridges and bumps), but the feature itself may not necessarily be aligned with respect the the patch centers. We therefore encourage patch centers to lie on salient features. We now define each patch Pk with center ck as the subset of points that lie within a sphere of radius R. Given a well-chosen radius and patch centers ck , we can meet objective (1). We want to minimize overlap on one hand, but also ensure a tight packing. We must therefore find a set of evenly distributed ck ’s. More precisely, we optimize the ck ’s such that they lie at a fixed distance from their neighbors, and take radius R as this distance. To achieve this goal, we use Pauly et al.’s particle simulation technique [PGK02], which was originally developed for point cloud simplification. Their method starts with a random distribution of point samples on the point cloud (the ck ’s in our case), and subsequently applies repulsion Turk’s repulsion algorithm [Tur92] to evenly spread them. Repulsion is an iterative procedure
Erik Hubo / Self-Similarity-Based Compression of Point Clouds,with Application to Ray Tracing
Patch
X histogram
Y histogram
4.2. Measuring Similarity Among Patches Before we can group similar patches (see Section 4.3), we need a way to measure how similar they are to each other. The challenge in comparing two patches is to first make sure they are well-aligned. Next, we compute a concise patch descriptor, and discuss how these can be compared in a meaningful way. 4.2.1. Translation and Orientation Normalization Before two patches can be compared, we need to discount any differences in translation and orientation. Scale and anisotropy [KFR04] are irrelevant, since patches are equally sized and isotropic. Translation can be easily disregarded by moving each patch so that its centroid lies at the origin. Orientation-invariant descriptors [KFR03, F∗ 03] exist, but they rely on a fairly complicated volumetric analysis using Spherical Harmonics. Instead, we estimate orientation separately, and rotate them to a canonical frame before comparison [SV01]. We will reuse the orientation information afterward as an initial guess for exact alignment (see Section. 4.3).
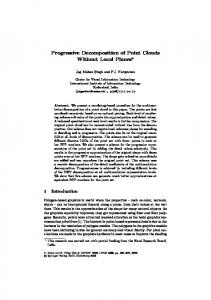
Figure 2: Example patches with their corresponding descriptors, taken from the David model. Patch shapes range from flat to curved, and their different shapes are reflected by the histograms of the normals’ X and Y coordinate. that pushes surface points within a specified radius away from each other, while constraining them to remain on the surface defined by the underlying point cloud [PGK02]. This process is repeated until convergence. We extend this method further to meet objective (2). We alternate the repulsion iteration with a “feature attraction” step, which basically updates patch centers toward salient surface points: 1 ck := ∑ Cp p ∑ p∈Pk C p p∈Pk Here, we perform a normalized weighted summation over all points p in patch Pk . Each weight C p measures how “salient” point p is. Mean curvature is a viable candidate, which can be approximated well via local covariance analysis [PGK02]. However, for efficiency, we use a simple measure based on local normal variation. At each point p, we compute the standard deviation of the dot products n p · nq with the normals from neighboring points q. See Figure 1 for an example of our segmentation.
In contrast to full 3D objects, a patch only represents a small part of a surface. It looks like a distorted disk (see Figure 2), and is often flat. General shapes can be aligned using Principal Component Analysis [SV01]. However, this technique is less meaningful on isotropic and flat shapes (like our patches), and does not work well in practice [KFR03, F∗ 03]. We use a simple but robust heuristic, which exploits the particular morphology of our patches’ shape. Since patches are usually close to flat, they all can be oriented such that their supporting planes coincide. To do so, we find a rotation that makes the mean patch normal aligned with the Z axis. However, this rotation is not unique, leaving us with one degree of freedom, i.e. the rotation around the Z-axis. We compute the spherical coordinates of each normal in the patch (with respect to the Z-axis and some freely chosen orthonormal X and Y axes), but only keep the azimuthal component θ . The patch is then rotated around the Z-axis by −θµ , where θµ is the mean azimuthal angle θ within the patch. 4.2.2. Computing and Comparing Descriptors For efficiency reasons, we use a simple statistical descriptor. Inspired by Extended Gaussian Images [Hor84], we compute a histogram from a patch’s normal directions. Since patches are fairly flat, we do not have to compute a full spherical histogram, but only consider (upward) hemispherical directions. This allows for a simple 2D parameterization based on a normal’s X and Y coordinate, both conveniently bounded to [−1, 1]2 . The similarity between two patches can then be evaluated using any distance measure suitable for histograms. We can classify such measures into bin-by-bin and cross-bin measures [RTG00]. Bin-by-bin techniques, like the Minikowski (LN ), Kullback-Leibner or Bhattacharyya distance [Bha43], only compare corresponding histogram bins, disregarding c The Eurographics Association 2007.
Erik Hubo / Self-Similarity-Based Compression of Point Clouds,with Application to Ray Tracing
information in nearby bins. In contrast, cross-bin techniques take into account non-corresponding bins as well, and are thus more powerful [RTG00]. A popular cross-bin measure is the Earth Mover’s Distance (EMD) [WPR85, RTG00], which computes the minimal cost for flowing “bin matter” from one histogram to form the other. Unfortunately, EMD requires solving the transportation problem [Hit41], which involves a costly optimization step. To retain efficiency, we will use the match distance, a simple cross-bin dissimilarity measurement designed for 1D histograms [SW83, WPR85]: d(H, G) = ∑ |Hˆ i − Gˆ i |
(1)
i
where Hˆ i = ∑ j≤i H j is the cumulative histogram of H, and similarly for histogram G. The match distance is defined as the L1 distance between their corresponding cumulative histograms, which can be computed very efficiently. For 1D histograms with an equal number of bins, this distance is in fact a special case of EMD [RTG00]. The match distance cannot be extended to multi-variate histograms, like the one we compute for the X and Y coordinate. We therefore compute two 1D histograms for each coordinate separately. This approximation turns out to work well in practice. A comprehensive visual example of the histograms is given in Figure 2. The X and Y histograms are converted to their cumulative version, and concatenated into a single descriptor vector. Finally, we can simply perform a comparison on this vector using the L1 distance, in conjunction with an efficient data structure like the kD-tree. In practice we apply a nonlinear transformantion to each coordinate, which “stretches” the range around 0. The tanhfunction does a good job at this. This technique increases bin resolution near the origin, which is useful for capturing fine normal variations close to the Z-axis. This is improves discrimination performance, since many normals tend to point upward. Even though our normal-based descriptor [Hor84] may lack discriminative power, and was simplified to 1D histograms, it does a reasonable job. Patches that are wrongfully considered similar can still be discriminated later on in the registration step 4.3. 4.3. Code Book Generation Similar patches are clustered and replaced by a reference to a representative patch. All representatives or code words are stored in the code book, as in standard vector quantization. The overhead of replacing the patch by a code word is the code book index (1 integer) and the patch orientation and translation (6 real values). Compression is achieved when the code book size and overhead are much smaller than the original patch set, which is usually the case. Code book generation boils down to grouping similar items (patch descriptors) together, which can be seen as a clustering process. Various clustering algorithms exist, and c The Eurographics Association 2007.
have been applied to vector quantization [LBG80, Llo82]. However, we will use a non-iterative greedy approach, which will give us some control over how representatives are chosen. We start off by selecting a representative patch P, and look for a set of all similar patches. P is put in the code book and we replace each similar patch by a reference to P, along with its orientation and translation. This process then continues until all patches have been replaced. We always select the patch P which has the smallest curvature in the pool of the remaining patches. This ensures that patches are always replaced by a conservative candidate, i.e. a smooth one. Replacing a slightly curved patch with smooth one is visually not as disturbing as replacing a smooth patch with slightly curved one. This way, the compression introduces over-smoothing instead of more salient artifacts. The set of similar patches reduces to a nearest neighbor query in the space of descriptor vectors (see Section 4.2). To make this process tractable, we use a kd-tree that performs queries with the L1 norm. The radius of the query determines how many code words will be created. In each cluster, we need to compute the relative alignment of each patch, i.e. translation and rotation, with respect to its representative patch. This has already been accomplished partially, since all patches were already transformed to the canonical frame in the normalization process (Sec. 4.2.1). However, this was only an approximate estimate of alignment. We therefore refine the orientation and translation parameters via the Iterated Closest Point algorithm [CM92, RL01]. It usually only takes a couple of iterations to convergence. The descriptor does a reasonable job at assessing similarity. Unfortunately, it may happen that a patch is wrongfully assigned to a representative. We therefore measure error using MLS [Lev03, AA04] after the final alignment step. If the error exceeds a threshold, it is put back in the list of to-beclustered patches. 5. Ray Tracing the Compressed Data In principle, any point cloud ray tracing method which supports instancing, can be applied to our algorithm. Here, we describe an efficient algorithm inspired by Wald and Seidel’s kd-tree-based technique [WS05]. We start by building a kD-tree to perform ray-patch intersections, based on patches’ bounding spheres. Compared to ray tracing with the Quantized kD-tree, we can afford to apply the SAH heuristic, which offers more efficient intersection queries [WS05]. Once a candidate sphere has been found, we load the corresponding representative patch from the code book. Finally, we intersect the patch surface using MLS [AA03, AA04], taking into account its locally stored translation and rotation. As seen in Section 4.1, the patches overlap to avoid holes. To avoid seams, overlapping patches are blended together along the ray [OBA05]. More precisely, we compute intersections with every intersected patch, and
Erik Hubo / Self-Similarity-Based Compression of Point Clouds,with Application to Ray Tracing
(a)
(a)
(b)
(c)
(d)
(b)
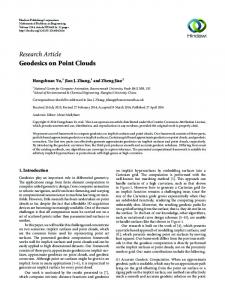
Figure 3: (a)plot of compression ratio vs. code book ratio for the David model. This plot indicates the overhead introduced by our method. (b) illustrates a theoretical plot of the maximum code book ratio vs. the patch size for a model. The plot is model dependent. simply compute a normalized weighted summation of the intersections. Weights are defined using a simple Gaussian curve, based on the distance to the patch centers, with standard deviation equal to the patch radius. 6. Results As suggested by Waschbuch et al. [WGE∗ 04] we use the peak signal to noise ratio (PSNR) to measure the loss of dB . U is the quality, given as 20log10 max(RMS(U,C),RMS(C,U)) original uncompressed point cloud and C the compressed point cloud, dB is the bounding box diagonal of U and RMS is the symmetric root mean square distance. When taking the RMS as error measure, it is preferable to measure the RMS between the surfaces as the distance between discrete pointpairs (e.g Hausdorff distance). This takes into account the difference of the sampling as well. An MLS error, on the other hand, only gives the distance between the surfaces, but ignores the underlying sampling, which plays an important role for point clouds [WGE∗ 04, SK06]. First, we show the difference between the compression ratio and the code book ratio. This is the ratio of the original number of patches vs. the number of patches in the code book. We can influence the code book ratio by changing the maximal search distance of the nearest neighbor query in the patch space. As shown in Figure 3(a), these two ratio’s are not the same indicating the overhead introduced by our algorithm. This overhead is a natural result of the transformation information which is stored for each patch. The transformation overhead is inversely proportional to the number of patches. This means, patches should be as big as possible to reduce this overhead. However, using big patches results in very low patch compression ratios (see Figure 3(b)) because big patches can not be replaced as easy as small patches. We have tested our compression scheme on several models of the Stanford scanning repository: Bunny (32 K points), Night (11 M points), Lucy (14M points) and David (28 M points). In practice we take #points 10 patches for a small model for big models like David. like the Bunny, and #points 100
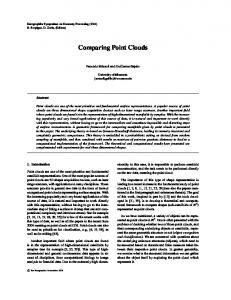
Figure 4: R-D curves of our compression scheme for (a) David (b) Lucy (c) and bunny. The normals are compressed with the same amount of bits. In Figure (d) we give an R-D comparison of our method vs. the quantized kd-Tree [HMHB06]. In Figure 4, the R-D (compression rate vs. distortion) curves are plotted for the David, the Lucy and the bunny model. In these figures, the horizontal axes and vertical axes give the position/normal coding bit rates and the corresponding PSNR values, respectively. The plots indicate that our algorithm has very good PSNR values for low bit rates for big data sets. Our technique performs not as well at compressing small models, like the bunny, because the transformation overhead dominates in that case. In Figure 4(d) we compare with the quantized kDtree [HMHB06], which also aims at random access compression. However, this comparison should not be overinterpreted. Quantization techniques [RL00,BWK02,KSW05] reduce real-valued information like coordinates to integers, and thus generally have a lower PSNR, even though visually they might still produce acceptable results. However, it is important to notice in Figure 4(d) that our technique seems to behave fairly well in terms of quality loss as the compression is increased. A comprehensive visual example of different compression rates on the same model (David) is shown in Figure 6. The colors represent the used code book patches. Our technique always instances uncompressed data. It is therefore less sensitive to unnatural banding artifacts, as often seen with quantization-based methods [BWK02, KSW05]. Our technique was also tested on different models, see Figure 7 for some examples. We compared the rendering times of a compressed and uncompressed David model. Since the uncompressed model could not fit entirely in main memory, disk access was needed during rendering, leading to performance stalls. On average the rendering times dropped 2 to 10 times when compared with the compressed one, see Figure 5. Most sigc The Eurographics Association 2007.
Erik Hubo / Self-Similarity-Based Compression of Point Clouds,with Application to Ray Tracing
Acknowledgments We thank the graphics group at Stanford University for sharing their 3D models. All authors acknowledge structural research funding at the Expertise center for Digital Media by the ERDF (European Regional Development Fund), the IBBT (Flemish Interdisciplinary institute for BroadBand Technology) and the Flemish government. References [AA03] A DAMSON A., A LEXA M.: Ray tracing point set surfaces. In SMI ’03: Proc. of the Shape Modeling International 2003 (2003), IEEE Computer Society, p. 298.
Figure 5: This plot shows the rendering time per frame in seconds for a prerecorded camera sequence for a compressed and an uncompressed model David model. The compressed model fitted in the main memory while the uncompressed did not fit into the main memory and required disk access during rendering, leading to a decreased performance. The peaks are caused by significant camera movements, and small rotations, in these cases large parts of the model needed to be loaded from disk into main memory. nificant decreases were measured when the model was rotated, or when the camera switched to a new view. The total processing time of our algorithm can be divided in two parts: the segmentation phase and the clustering phase. The first phase may take up to several hours until convergence, but its result can be reused to achieve different compression ratios. The clustering phase, on the other hand, already finishes in 30 minutes (David model). Note that this is measured on an unoptimized implementation. 7. Conclusion and Future Work In this paper, we introduced a compression method for point sampled models. It exploits the repetitive structure often encountered in real-world, scanned surfaces. Our technique can be seen as an extension of vector quantization for the case of point clouds: the surface is divided into small patches, which are then clustered. Decompression is realized by instancing a representative patch of each cluster. A particular advantage of our appoach is the ability of randomly accessing parts of the data without having to reconstruct the full model. It can therefore be used in conjunction with ray tracing [HMHB06]. By decreasing the size of the patches, we trade compression ratio for an increased likelihood of finding suitable matches. So far, patches are all equally sized and fairly small (100 to 1000 points). We would like experiment with differently sized patches. We also plan to include additional point attributes in the algorithm, like colors and material parameters, and introduce Level-of-Detail [YLM06, HMHB06]. Finally, we wish to apply our method to forward rendering, by exploiting instanced rendering using graphics hardware. c The Eurographics Association 2007.
[AA04] A LEXA M., A DAMSON A.: On normals and projection operators for surfaces defined by point sets. In Symposium on Point-Based Graphics (2004), pp. 149–155. [AG05] A LLIEZ P., G OTSMAN C.: Recent Advances in Compression of 3D Meshes. Springer-Verlag, 2005. [AKKS99] A NKERST, K ASTENMULLER , K RIEGEL , S EIDL: 3D shape histograms for similarity search and classification in spatial databases. In SSD: Advances in Spatial Databases (1999), LNCS, Springer-Verlag. [AKP∗ 05] A DAMS B., K EISER R., PAULY M., J. G UIBAS L., G ROSS M., D UTRE P.: Efficient raytracing of deforming pointsampled surfaces. Computer Graphics Forum 24 (2005), 677– 684. [Bha43] B HATTACHARYYA A.: On a measure of divergence between two statistical populations defined by their probability distributions. Bulletin of the Calcutta Mathematics Society 35 (1943), 99–110. [BM92] B ESL P. J., M C K AY N. D.: A method for registration of 3-D shapes. PAMI 14, 2 (1992), 239–258. [BM05] B UADES A., M OREL J. M.: A non-local algorithm for image denoising. In CVPR (2005), pp. II: 60–65. [BWK02] B OTSCH M., W IRATANAYA A., KOBBELT L.: Efficient high quality rendering of point sampled geometry. In EGRW ’02: Proc. of the 13th Eurographics workshop on Rendering (2002), pp. 53–64. [CM92] C HEN Y., M EDIONI G.: Object modelling by registration of multiple range images. Image Vision Comput. 10, 3 (1992), 145–155. [F∗ 03] F UNKHOUSER T., ET AL .: A search engine for 3d models. ACM Trans. Graph. 22, 1 (2003), 83–105. [FCOAS03] F LEISHMAN S., C OHEN -O R D., A LEXA M., S ILVA C. T.: Progressive point set surfaces. ACM Trans. Graph. 22, 4 (2003), 997–1011. [GD02] G ANDOIN P.-M., D EVILLERS O.: Progressive lossless compression of arbitrary simplicial complexes. In SIGGRAPH (2002), ACM Press, pp. 372–379. [GKIS05] G UMHOLD S., K ARNI Z., I SENBURG M., S EIDEL H.P.: Predictive point-cloud compression. In Siggraph Sketches (2005). [Hit41] H ITCHCOCK F.: The distribution of a product from several sources to numerous localities. Journal of Mathematical Physics 20 (1941), 224–230.
Erik Hubo / Self-Similarity-Based Compression of Point Clouds,with Application to Ray Tracing
(a) Uncompr. bpp 96;
(b) bpp 10.9, PSNR 86,7
(c) bpp 5.5, PSNR 86.5
(d) bpp 3.1, PSNR 85.7
(e) bpp 1.44, PSNR 85.4
Figure 6: Overview of compression rates on the 28M point David model. The different colors represent the different used code book patches. The compression ratio increases from left to right. Images are vertically aligned per compression ratio. Used abbreviations: bpp (bits per point), PSNR (Peak Signal To Noise Ratio) in Decibel. Note that the normals are compressed at the same bit rates as the points. [HMHB06] H UBO E., M ERTENS T., H ABER T., B EKAERT P.: The quantized kd-tree: Efficient rendering of compressed point clouds. In IEEE Symposium on Interactive Ray Tracing (2006), vol. 1, pp. 105–113. [Hor84] H ORN B.: Extended gaussian images. Proc. of the IEEE 72(12) (1984), 1671–1686. [HPKG06] H UANG Y., P ENG J., K UO C.-C. J., G OPI M.: Octree-based progressive geometry coding of point clouds. In Symposium on Point-Based Graphics (2006), Eurographics. [HSKK01] H ILAGA M., S HINAGAWA Y., KOHMURA T., K UNII T. L.: Topology matching for fully automatic similarity estimation of 3D shapes. In SIGGRAPH (2001), pp. 203–212. [KCL06] K IM J., C HOE S., L EE S.: Multiresolution random accessible mesh compression. Computer Graphics Forum (Eurographics 2006) 25 (2006), 323–332. [KFR03] K AZHDAN M., F UNKHOUSER T., RUSINKIEWICZ S.: Rotation invariant spherical harmonic representation of 3d shape descriptors. In Symposium on Geometry Processing (2003), pp. 167–175. [KFR04] K AZHDAN M., F UNKHOUSER T., RUSINKIEWICZ S.: Shape matching and anisotropy. In SIGGRAPH (2004), ACM Press, pp. 623–629.
[KSW05] K RÜGER J., S CHNEIDER J., W ESTERMANN R.: Duodecim - a structure for point scan compression and rendering. In Symposium on Point-Based Graphics (2005). [LBG80] L INDE Y., B UZO A., G RAY R. M.: An algorithm for vector quantizer design. IEEE Trans. on Communications 28, 1 (1980), 84–95. [Lev03] L EVIN D.: Mesh-independent surface interpolation. In Geometric Modeling for Scientific Visualization (2003). [Llo82] L LOYD S. P.: Least squares quantization in PCM. IEEE Transactions on Information Theory 28 (1982), 128–137. [MMG06] M ERRY B., M ARAIS P., G AIN J.: Compression of dense and regular point clouds. In AFRIGRAPH (2006), ACM Press, pp. 15–20. [MPFL96] M ITCHELL J. L., P ENNEBAKER W. B., F OGG C. E., L EGALL D. J. (Eds.): MPEG Video Compression Standard. Chapman & Hall, Ltd., 1996. [OBA05] O HTAKE Y., B ELYAEV A., A LEXA M.: Sparse lowdegree implicit surfaces with applications to high quality rendering, feature extraction, and smoothing. In Eurographics Symposium on Geometry Processing (2005), pp. 149–158. [OFCD02]
O SADA R., F UNKHOUSER T., C HAZELLE B., c The Eurographics Association 2007.
Erik Hubo / Self-Similarity-Based Compression of Point Clouds,with Application to Ray Tracing
(a) Uncompressed
(b) Lucy: bpp 5.3, PSNR 81.1
(c) Uncompressed
(d) Night: bpp 10.4, PSNR 78.2
Figure 7: For abbreviations see Figure 6. (a)(b) Lucy (14 M Points), (c)(d) Night (11 M points) D OBKIN D.: Shape distributions. ACM Transactions on Graphics 21, 4 (2002), 807–832. [OS04] O CHOTTA T., S AUPE D.: Compression of point-based 3d models by shape-adaptive wavelet coding of multi-height fields. Proc. Symposium on Point-Based Graphics (2004), 103–112. [PGK02] PAULY M., G ROSS M., KOBBELT L. P.: Efficient simplification of point-sampled surfaces. In VIS (Washington, DC, USA, 2002), IEEE Computer Society, pp. 163–170.
[SV01] S AUPE D., V RANIC D. V.: 3d model retrieval with spherical harmonics and moments. In Proc. of the 23rd DAGMSymposium on Pattern Recognition (2001), pp. 392–397. [SW83] S HEN H. C., W ONG A. K. C.: Generalized texture representation and metric. Computer Vision, Graphics, and Image Processing 23, 2 (1983), 187–206. [Tur92] T URK G.: Re-tiling polygonal surfaces. Graphics 26, 2 (1992), 55–64.
Computer
[PKGH97] P HARR M., KOLB C., G ERSHBEIN R., H ANRAHAN P.: Rendering complex scenes with memory-coherent ray tracing. In SIGGRAPH (1997), pp. 101–108.
[Wal04] WALD I.: Realtime Ray Tracing and Interactive Global Illumination. PhD thesis, Computer Graphics Group, Saarland University, 2004.
[PR92] P ROKOP R. J., R EEVES A. P.: A survey of moment-based techniques for unoccluded object representation and recognition. CVGIP: Graph. Models Image Process. 54, 5 (1992), 438–460.
[WDS04] WALD I., D IETRICH A., S LUSALLEK P.: An interactive out-of-core rendering framework for visualizing massively complex models. In Rendering Techniques 2004 : EGSR (2004), Keller A., Jensen H. W., (Eds.), pp. 81–92.
[RL00] RUSINKIEWICZ S., L EVOY M.: QSplat: A multiresolution point rendering system for large meshes. In Siggraph 2000 (2000), pp. 343–352. [RL01] RUSINKIEWICZ S., L EVOY M.: Efficient variants of the ICP algorithm. In Proc. of the Third Intl. Conf. on 3D Digital Imaging and Modeling (2001), pp. 145–152. [RTG00] RUBNER Y., T OMASI C., G UIBAS L. J.: The earth mover’s distance as a metric for image retrieval. Int. J. Comput. Vision 40, 2 (2000), 99–121. [SJ00] S CHAUFLER G., J ENSEN H. W.: Ray tracing point sampled geometry. In Eurographics Workshop on Rendering Techniques 2000 (2000), Springer-Verlag, pp. 319–328. [SK06] S CHNABEL R., K LEIN R.: Octree-based point-cloud compression. In Symposium on Point-Based Graphics (July 2006), Botsch M., Chen B., (Eds.), Eurographics. c The Eurographics Association 2007.
[WGE∗ 04] WASCHBÜCH M., G ROSS M., E BERHARD F., L AMBORAY E., W ÜRMLIN S.: Progressive compression of point-sampled models. In Eurographics Symposium on PointBased Graphics (2004), pp. 95–102. [WPR85] W ERMAN M., P ELEG S., ROSENFELD A.: A distance metric for multidimensional histograms. Comput. Vision, Graph., Image Processing 32 (1985), 328–336. [WS05] WALD I., S EIDEL H.-P.: Interactive Ray Tracing of Point Based Models. In Proc. of 2005 Symposium on Point Based Graphics (2005), pp. 9–16. [YLM06] YOON S.-E., L AUTERBACH C., M ANOCHA D.: Rlods: fast lod-based ray tracing of massive models. VIS 22, 9 (2006), 772–784.
Erik Hubo / Self-Similarity-Based Compression of Point Clouds,with Application to Ray Tracing
(a) Uncompressed;
(b) bpp 10.9, PSNR 86,7
(c) bpp 5.5, PSNR 86.5
(d) bpp 3.1, PSNR 85.7
(e) bpp 1.44, PSNR 85.4
Figure 6: Overview of compression rates on the 28M point David model. The different colors represent the different used code book patches. The compression ratio increases from left to right. Images are vertically aligned per compression ratio. Used abbreviations: bpp (bits per point), PSNR (Peak Signal To Noise Ratio) in Decibel. Note that the normals are compressed at the same bit rates as the points.
c The Eurographics Association 2007.