Semantic Video Annotation using Background Knowledge and Similarity-based Video Retrieval Ainhoa Llorente1,2 , Srđan Zagorac1 , Suzanne Little1 , Rui Hu1 , Anuj Kumar3,4 , Suhail Shaik5 , Xiang Ma6 , Stefan R¨ uger1 1 Knowledge Media Institute, The Open University Walton Hall, Milton Keynes, MK7 6AA, United Kingdom 2
INFOTECH Unit, ROBOTIKER-TECNALIA Parque Tecnol´ ogico, Edificio 202, Zamudio, E-48170, Bizkaia, Spain 3
Indian Institute of Information Technology and Management, Gwalior, India 4
Global Research Center for Consulting, Wipro Consulting Services, India 5
6
Btech-IT, Indian Institute Of Information Technology Allahabad, U.P-211012, India
Department of Electrical and Computer Engineering, University of Illinois at Chicago Chicago, Illinois 60607, U.S.A. {a.llorente, s.zagorac, s.little, r.hu, s.rueger}@open.ac.uk
[email protected],
[email protected],
[email protected]
Abstract. We describe our experiments for the High-level Feature Extraction (FE) and Search (SE) tasks. We submitted two automatic runs to the FE task, the first one (MMIS alexei) was based on a probabilistic approach while the second (MMIS ainhoa) was an enhanced version that used background knowledge in the form of statistical co-occurrence of annotation keywords. While previous applications of this approach to other datasets have performed quite well, our results in TRECVID 2008 are not so good. In particular, the performance of the second run was limited by the small vocabulary. For the SE task we submitted two runs: a similarity-based media search (MMIS media) and the required text-only search (MMIS text). The similarity search, using media content, had better precision than the text-only search but had difficulties with some types of queries (e.g., motion-based). Overall, participation in the TRECVID evaluation was a valuable learning experience for our group.
1
Introduction
This is our first year participating in TRECVID [15] since the MMIS group moved from Imperial College to The Open University. We participated in the High-level Feature Extraction (FE) and the Search (SE) tasks. We submitted two runs per task: “MMIS alexei” and “MMIS ainhoa” to the FE and “MMIS media” and “MMIS text” to the SE task. The paper is structured as follows. Section 2 describes the shot boundary algorithm we employed while Section 3 and 4 present, respectively, the experiments and results that we carried out for the High-level Feature Extraction and Search tasks. Finally, in Section 5 we analyse the conclusions and our intentions for future work.
2
Shot Boundary Detection Algorithm
The algorithm that we use to detect video shots was developed by our group and presented in the TREC 2002 proceedings paper [13]. The video shot boundary detection algorithm is broadly based on the colour histogram method. The colour histograms for consecutive frames are compared and a shot change is declared if their difference is greater than a given threshold. This method is extended based on the algorithm of Pye et al [14] for detection of gradual transitions that take place over a number of frames,
and for rejection of transients such as the effect of a flash-bulb. In order to determine the start and end points for gradual transitions, we employ a method similar to that described by Zhang [21], in which a lower threshold is used to test for the start and end of a gradual transition. The output of the shot boundary detector is the timing information for the start and end of the shot and a single keyframe to represent the shot.
3
High-level Feature Extraction Task
The objective of the High-level Feature Extraction (FE) task is, given the test collection, the common shot boundary reference, and the list of 20 high-level feature definitions, a list of at most 2000 shots from the test collection, ranked according to the highest possibility of detecting the presence of the feature, should be returned for each feature. Each feature is assumed to be binary, i.e., it is either present or absent in the given reference shot. The dataset used was provided by The Netherlands Institute for Sound and Vision and is a collection of MPEG-1 videos divided into 219 videos for development and 219 for test purposes. NIST provided 20 high-level features together with some interpretations drawn from the Large-Scale Concept Ontology for Multimedia (LSCOM) [12]. These concepts belong to the following categories: people (“two people”, “driver”); indoor scene (“kitchen”, “classroom”), human action (“singing”, “demonstration or protest”); outdoor scene (“night time”, “cityscape”, “harbour”, “bridge”,“mountain”, “street”); vehicle(“emergency vehicle”, “bus”, “boat”, “airplane”); artifact (“telephone”); animal (“dog”); plant (“flower”) and human part(“hand”).
3.1
Development Data
The development data realeased by TRECVID’s organisers did not contain any annotation consequently we make use of the work done by the MCG-ICT-CAS group [5] who annotated this year’s development data with the 20 LSCOM features. They also provided the keyframes that depending on their origin could be divided into two parts: the first set (21,532 keyframes) corresponds to TRECVID 2007 development keyframes extracted by Ayache and Qu´enot [2] and the other set (18,142 keyframes) were extracted by MCG-ICT-CAS using the middle I-frame as keyframe for each shot. Low-level features, such as colour and texture (see Section 3.2), were extracted from this collection of 39,674 keyframes in order to capture global image information. Each keyframe was partitioned into nine non-overlapping equal rectangular tiles which were concatenated to produce the final feature vector. After extracting the feature information we applied our two algorithms for annotation as described in Section 3.4. We did not use either the Automatic Speech Recognition (ASR) or the Machine Translation (MT) data.
3.2
Features
The features extracted in all of our submitted runs for this task were a combination of a colour feature, CIELAB, and a texture feature, Tamura. CIE L∗a∗b∗ (CIELAB) [6] is the most complete colour space specified by the International Commission on Illumination (CIE). Its three coordinates represent the lightness of the colour (L∗), its position between red/magenta and green (a∗) and its position between yellow and blue (b∗). The Tamura texture feature is computed using three main texture features called “contrast”, “coarseness”, and “directionality”. Contrast aims to capture the dynamic range of grey levels in an image. Coarseness has a direct relationship to scale and repetition rates and it was considered by Tamura et al. [16] as the most fundamental texture feature and finally, directionality is a global property over a region.
3.3
System Training
Both runs submitted were based on the probabilistic framework deployed by Yavlinsky et al. [19] who used non-parametric density estimation. Consequently, as a first step in the training process we undertook an estimation of the optimal bandwidth h of the d-dimensional Gaussian kernel used. kG (t; h) =
d Y l=1
√
t 1 − 1 ( l )2 e 2 hl 2πhl
(1)
where t = x − x(i) being x = (x1 , ..., xd ) with xi ∈ R a vector of real-valued image features and d the dimension of the feature vector. The performance of the Gaussian kernel depends on the optimal bandwidth h which is also referred to as the width of the kernel. For our experiments we considered different bandwidths in different dimensions and sought to determine the optimal bandwidth in each dimension i.e. d1 , d2 , ... dk . The optimal bandwidth in each dimension is obtained by scaling the sample standard deviation of feature k by a scaling factor µ. The scaling factor µ was obtained by applying a six-fold cross validation using the training set T and hold-out set H. The hold-out data H is in practice a part of the original training data, which can be used for validation. In six-fold cross validation, the training set T was divided into six datasets randomly (i.e. T1 , T2 , T3 , T4 , T5 , T6 ), and the top three annotations were found out for the hold-out dataset by using each training set once. The precision and recall values were calculated on each training set Ti , and were averaged over the six training sets to calculate the final precision and recall for six-fold cross validation. Thus, in each dimension the optimal scaling factor was obtained that maximized the precision and recall figures (i.e. maximized the F1 measure) on the hold-out data. Keywords Two people Kitchen Singing Classroom Flower Nighttime Mountain Cityscape Demonstration Or Protest Harbor Hand Dog Bridge Emergency Vehicle Street Bus Boat Ship Airplane flying Telephone Driver
MMIS alexei MMIS ainhoa 0.485640135 0.485950946 0.075374438 0.080774938 0.030687141 0.030532031 0.040990478 0.043014457 0.114311017 0.11089702 0.47731329 0.468538502 0.233254933 0.22759957 0.305029733 0.304307318 0.013802722 0.013394201 0.014752756 0.011827444 0.340171392 0.332715888 0.416706429 0.421314579 0.024568691 0.024997723 0.031198032 0.031294618 0.390666946 0.393208725 0.022740442 0.024036118 0.069382186 0.067713695 0.069649754 0.058547041 0.070208146 0.078015948 0.011554057 0.011760563
Table 1. Average Precision per Keyword
After fixing the bandwidth of the Gaussian, we divided the development data into two groups: a training set with annotations (6,000 keyframes) and a test set without (2,731 keyframes) in order to
evaluate the performance of the system. We represented the average precision per keyword in Table 1 for both our submitted runs. In addition to that, we obtained the mean average precision (MAP) that were 0.1619 for the “MMIS alexei” run and 0.1610 for “MMIS ainhoa”. We used the training type A which means system trained only on common TRECVID development collection data including the annotations provided by the MCG-ICT-CAS team for the 2007 data. 3.4
Experiments
The test collection is made up of 219 videos which are divided into shots (non-overlapping video sequences) that were defined by NIST for this task. For each shot of each video, we took a representative keyframe, defined as the tenth frame of the shot using the algorithm developed by our group explained in Section 2. However, we experienced some problems with the four black & white videos of the collection (BG 8907.mpg, BG 11364.mpg, BG 9657.mpg and BG 10523.mpg) that obliged us to extract the frames manually. We submitted two runs, one called “MMIS alexei” and the other “MMIS ainhoa”. The obtained results, evaluated under different metrics, are shown in Table 2. For each run, we represent the following values: the number of shots retrieved, the number of relevant shots, the number of relevant shots that are retrieved, the mean average precision (MAP), the R-precision and the inferred average precision (Inferred AP) [20]. 3.5
Run “MMIS alexei”
This run corresponds to the probabilistic framework developed by Yavlinsky et al. [19] who used simple global features together with robust non-parametric density estimation and the technique of kernel smoothing. The results shown by Yavlinsky et al. were comparable with the Inference Network developed by Metzler and Manmatha [11] and the Cross-media Relevance Model by Lavrenko et al. [8] for the Corel dataset. Notably, Yavlinsky et al. showed that the Corel dataset proposed by Duygulu et al. [4] could be annotated remarkably well by just using global colour information. The process followed by their algorithm can be described as follows. First, images (keyframes) are segmented into nine rectangular equal tiles, and then, low-level features are extracted. The features used to model the visual concept densities are a combination of colour CIELAB and texture Tamura, as explained in Section 3.2. The next step is to extract the same feature information from an unseen keyframe in order to compare it with all the previously created models (one for each concept). The result of this comparison yields a probability value p(ω|x) of each concept ω being present in each keyframe represented by its corresponding feature vector x. Metric MMIS alexei MMIS ainhoa Num Retrieved 37780 37797 Num Relevant 4670 4670 Num Relevant Retrieved 324 297 MAP 0.0014 0.0014 R-Precision 0.0106 0.0102 Inferred AP 0.0027 0.0025 Table 2. MMIS Results
3.6
Run “MMIS ainhoa”
This run uses as a baseline the system described in the previous section (Section 3.5) in order to obtain the probability of each concept being present in each keyframe. The underlying idea described in [9]
is to modify these probability values using additional knowledge from the image context (background knowledge) in order to improve the accuracy of the final annotations. The context of the images is computed using a co-occurrence matrix of 20x20 dimension (see Table 3) where each cell represents the number of times two visual concepts appear together annotating an image of the training set. The final goal of this algorithm is to detect incoherence between the annotation words with the help of the co-occurrence matrix. Once incoherence between words has been detected, the probability of the word associated to the lowest probability will be lowered, as well as all the words which are related to it. After modifying these probability values, new annotations will be generated by selecting the keywords with the highest probability.
Two people Kitchen Singing ... Telephone Driver
Two people Kitchen Singing ... Telephone Driver 2 0 1 1 0 0 1 1 0 0 1 1 2 0 0 1 0 0 2 0 0 0 0 0 0 Table 3. Co-occurrence Matrix
3.7
Results
Around 200 runs from 42 groups have been submitted for the High-level Feature Extraction task (FE) this year. In Table 4 we present the following data per high-level feature –number of runs submitted, the minimum, the median and maximum inferred average precision and finally, the inferred average precision obtained with our two submitted runs. The best results were achieved while detecting concepts such as: “airplane flying”, “harbor”, “classroom” and “bus”. However, our algorithms failed to detect the following visual terms: “two people”, “kitchen”, “singing”, “flower”, “nighttime”, “hand”, “dog”, “emergency vehicle” and “driver”. In particular, it seems to have particular problems in detecting humans and consequently actions accomplished by humans or part of humans (“hand”). While previous applications of these approaches to other datasets such as the Corel 5k and ImageCLEF 2008 have performed quite well, our results for the FE task are not so good. In addition to that, our approach “MMIS ainhoa” failed to provide significant improvement over the automated image annotation method “MMIS alexei”. An explanation for this can be found in the small number of terms of the vocabulary that hinders the functioning of the algorithm and another in the nature of the vocabulary itself, where we have almost no semantically similar terms.
4 4.1
Search Task System
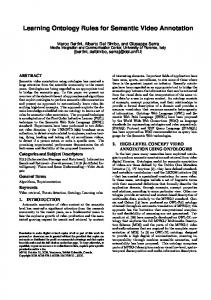
Our search engine is based on determining the distance from a query media object to a pre-indexed collection of media objects to build a list of results ordered by similarity [7]. The system consists of two parts – an indexing module and a search module – and is implemented in Java. The system architecture, shown in Figure 1, has been implemented as part of the PHAROS project as a web service within the wider PHAROS infra-structure. The interface to both modules of the search engine system is primarily through programming APIs at present. This enables rapid automatic batch processing of indexes and query sets but lacks the capability for interactive querying or user-driven iterative improvements through a graphical user interface.
Feature 1 2 3 4 5 6 7 8 9 10 11 12 13 14 15 16 17 18 19 20
Runs Min Median Max MMIS alexei MMIS ainhoa 200 0 0.008 0.152 0 0 200 0 0.004 0.117 0 0 200 0 0.003 0.065 0 0 200 0 0.101 0.275 0.008 0.008 200 0 0.01 0.165 0 0 200 0 0.029 0.278 0 0 200 0 0.05 0.174 0.002 0.002 199 0 0.004 0.119 0.001 0.001 200 0 0.046 0.324 0.003 0.003 199 0 0.059 0.258 0.012 0.01 199 0 0.008 0.182 0 0 198 0 0.011 0.136 0 0 199 0 0.113 0.413 0.004 0.003 199 0 0.013 0.233 0 0 199 0 0.095 0.377 0.002 0.002 199 0 0.041 0.246 0.004 0.005 199 0 0.102 0.323 0.002 0.001 199 0 0.093 0.394 0.014 0.013 199 0 0.058 0.161 0.001 0.001 199 0 0.014 0.258 0 0
Table 4. Comparison of results per high-level feature
The indexing module takes MPEG-7 documents describing each of the media objects. Each MPEG7 description contains the source descriptive metadata, such as video and media time point, and the extracted features for the keyframe image (described in Section 4.3) as mpeg7 : AttributeV alueP air elements. The media descriptions are stored in data structures based on the red-black tree algorithm [3] that guarantees log(n) efficiency. The permanent storage of this index is implemented using Apache Derby DBMS configured as an embedded system. To index a video collection, a keyframe is extracted for each shot detected using the algorithm described in Section 2. The selected features for this keyframe are extracted and the resulting MPEG-7 [17] descriptions used to populate the index. The search module takes queries by example using a signature or feature representation of the query media object in MPQF format [18]. MPQF (MPEG Query Format) is an XML-based query language developed in the context of the MPEG standards group that defines the format of queries and responses in a distributed multimedia search context. Each MPQF file describes the example or query media object using the same low-level feature set as those in the search engine index. The search engine uses the features from the MPQF to compute the normalised distance from each query object to each indexed object and produces an ordered list of media object references. The next section describes the functions used to calculate the distances, perform normalisation and to fuse ranked lists from multiple query objects for a single query topic. Section 4.3 defines the specific features used in the search engine for this SE task.
4.2
Calculating Distances, Normalisation and Result Set Fusion
To calculate the distance based on the features between the query media object (q) and the indexed media object (m) we use square chord distance. This is a geometric measure that treats objects as vectors in a multidimensional space and computes the distance based along pairwise comparisons on the dimensions.
Fig. 1. Search component of PHAROS project architecture
dqm =
n X √ √ ( qi − mi )2
(2)
i=1
When the search index is created a random subset (X) is selected to be used in normalising the distances. The following formula for normalisation is applied: ||dqm || =
dqm − µX σX
(3)
where mean (µX ) and standard deviation (σX ) are calculated from the pairwise distances of the random sample of the vectors (X) from the index. Submitting each query media object to the search engine produces a ranked list of media objects based on the normalised distance measure. When a query consists of a set of media objects a technique for aggregating or fusing these results lists is needed. To achieve this we have implemented the Borda algorithm [1] which treats each query media object as a “voter” who submits a fixed set of c candidates in order of preference. For each voter, the top ranked candidate is given c points, the second ranked candidate is given c − 1, and so on. If there are candidates left unranked by the voter, the remaining points are divided evently among the unranked candidates. Equation 4 describes how a candidate, ca , is ranked according to the ranks given by each of the n query media “voters”. Pn ca =
4.3
i=1 cai
n
(4)
Features
For the distance calculation in the search task (SE) we used three features– colour (CIELAB) and texture (Tamura and Gabor). The first two features are already described in Section 3.2.
Gabor One of the most popular signal processing based approaches for texture feature extraction is the use of Gabor filters. These enable filtering in the frequency and spatial domain. A range of filters at different scales and ordinations allows multichannel filtering of an image to extract frequency and orientation information. This is the used to decompose the image into texture features. Our implementation is based on that of Manjunath et al. [10]. 4.4
Experiments
Two runs were submitted to TRECVID - “MMIS media” and “MMIS text”. The “MMIS media” run was a completely automated run using a content-based query-by-example approach as described in Section 4.1 with no human input to the search process. A simple command-line interface was used to process the queries in a batch fashion without any iterative adjustments to the queries. First, the dataset was prepared to populate the search engine index with the feature set extracted from the keyframes of the test dataset. We used our shot-boundary detection algorithm in order to detect the shots in the training set and extracted a keyframe for each shot. Each keyframe was analysed using our feature extraction tool to generate the required features. Using a tool developed for the PHAROS project, the output from these two processes was converted into an MPEG-7 file describing the keyframe including the timestamp and the three chosen features. Each MPEG-7 file was then loaded into the search engine index resulting in an index of approximately 40,000 files. Second, the query descriptions were processed to generate the MPQF files. The video media examples for each query were processed to extract a frame from the beginning, middle and end of the example to improve the query coverage. The resulting keyframes for each video and the image media examples were processed to extract the required features. A set of MPQF files was produced for each of the 48 query topics. Each query was run in sequence through the system described in Section 4.1. All search runs were R XeonTM MP CPU 3.66GHz and 2GB RAM. performed on a Fujitsu-Siemens RX600S3 with 8 x Intel Timing information was calculated for each query topic. Once the search engine process had finished, it produced a text file containing an ordered list of keyframe references from the search index generated from the fused ranked list for each example media. This output file was then processed to determine which TRECVID shot the keyframe belonged to according to the keyframe timestamp and the TRECVID master shot boundary document. The required XML description was then generated for submission. As per the TRECVID submission guidelines we were also required to submit results from a purely text-based search (“MMIS text”) without any input from the content-based media component of our search tool. As we do not use the video transcript or textual annotations in any way or have a text-based search function within our search engine, we needed to build a separate tool to fulfil this requirement. A series of scripts using a very naive matching process were built to parse the transcript files and find occurrences of the key search words and return shots where the transcript contained two or more of the search words. Due to time limitations we didn’t attempt to use stem-matching or to parse the queries in any intelligent manner. This resulted in a very small number of shots being detected. The simplicity of the text-search is reflected in the very low precision results for this run. 4.5
Results
The results from the main automatic media run are approximately comparable with the median results achieved in TRECVID. On the whole though the precision rates are less than acceptable. This section discusses how the different styles of query performed, how our system performed for different queries and the limitations of the search approach used in our system. It also briefly discusses the relationship between the text-based search and our content-based media search. Three main styles of query can be found in the set of query topics provided by TRECVID: 1. queries for an action, movement or temporal relation (e.g., “person opening a door”, “car driving”)
Query 221 222 223 224 225 226 227 228 229 230 231 232 233 234 235 236
Min Median Max MMIS Query Min Median Max MMIS Query Min Median Max MMIS 0.000 0.001 0.045 0.001 237 0.000 0.003 0.058 0.001 253 0.000 0.000 0.059 0.000 0.000 0.005 0.144 0.003 238 0.000 0.000 0.008 0.000 254 0.000 0.003 0.150 0.003 0.000 0.002 0.031 0.000 239 0.000 0.005 0.048 0.005 255 0.000 0.000 0.018 0.003 0.000 0.004 0.050 0.005 240 0.000 0.001 0.021 0.000 256 0.000 0.006 0.143 0.002 0.000 0.002 0.067 0.002 241 0.000 0.010 0.119 0.008 257 0.000 0.020 0.228 0.007 0.000 0.034 0.180 0.005 242 0.000 0.000 0.028 0.028 258 0.000 0.002 0.056 0.001 0.000 0.004 0.259 0.004 243 0.000 0.000 0.073 0.000 259 0.000 0.009 0.173 0.004 0.000 0.009 0.513 0.005 244 0.000 0.011 0.093 0.001 260 0.000 0.020 0.217 0.003 0.000 0.007 0.143 0.002 245 0.000 0.001 0.337 0.001 261 0.000 0.011 0.147 0.002 0.000 0.013 0.150 0.008 246 0.000 0.002 0.080 0.011 262 0.000 0.001 0.070 0.004 0.000 0.015 0.387 0.006 247 0.000 0.004 0.063 0.001 263 0.000 0.052 0.417 0.002 0.000 0.001 0.035 0.001 248 0.000 0.033 0.337 0.013 264 0.000 0.002 0.032 0.000 0.000 0.002 0.064 0.004 249 0.000 0.002 0.117 0.002 265 0.000 0.017 0.230 0.006 0.000 0.003 0.105 0.001 250 0.000 0.022 0.229 0.004 266 0.000 0.005 0.043 0.010 0.000 0.000 0.042 0.000 251 0.000 0.001 0.071 0.002 267 0.000 0.006 0.092 0.007 0.000 0.001 0.025 0.000 252 0.000 0.003 0.062 0.001 268 0.001 0.006 0.113 0.005
Table 5. Minimum, Median, Maximum and MMIS media MAP for each search query topic
2. queries based on the presence of an item or the spatial composition of a scene (e.g., “item beside item” or “item without item”) 3. queries for a specific item or scene composition (e.g., “people sitting at table”, “person outdoors”) Table 5 shows the TRECVID topics divided into one of these three categories. The classification of each topic is not necessarily exact as several topics could be considered as more than one of the query styles described here. However, the general classification of each query topic as “temporal-based”, “spatial-based” (including queries that specified “without”) or “general” gives the distribution shown in Table 6. Query style TRECVID topic num MMIS media 1 221 224 230 232 234 235 236 238 239 0.0023 244 252 253 267 2 222 226 237 242 245 254 255 260 261 0.0025 263 265 3 223 225 227 228 229 231 233 240 241 0.0053 242 246 247 248 249 250 251 256 257 258 259 264 266 268
Overall 0.0037 0.0104 0.0083
Table 6. Average MAP for three categories of query
We anticipated that our search approach would perform best on query style 3 but would likely perform less successfully on queries of style 1. Queries based on identifying an action within a shot are not well served by looking at single keyframes in isolation from their temporal context. Our results generally reflect this. We also found that queries where an object was required to be absent or have a specific spatial relationship (style 2) also performed less well. The lack of options for specifying exclusions in our query and the absence of opportunities for iterative search refinement reduced the effectiveness in these cases.
Interestingly the overall results for this query style were slightly higher. The median performance of query number 263 (“Find shots of one or more ships or boats, in the water”) was relatively higher and improves the overall average for this style. This query was classified as style 2 because of the requirement for the ships or boats to be in water but could equally well have been classified as style 3. The search in which our system performed best was 242 (“Find shots of one or more people, each in the process of sitting down in a chair”) where we equalled the best performance. The style of query that focusses on static objects being present in a scene is favoured by the fusion approach to merging results from a set of media-based queries as it finds examples that are most similar to common elements of the set of query media objects. Due to the relatively arbitrary classification of the queries into the different styles and the frequent overlap, it is difficult to make any conclusive judgements about the performance of our system for different styles of queries. However, the initial examination indicates that the capability to handle queries with motion and queries with specific spatial requirements would improve the system’s performance. The text search results were, as anticipated, very poor. However, this demonstrates the very real need for content-based media search and retrieval and the difficulty in achieving any useful results through automatic querying of video transcripts without any human input or processed annotation of the media.
5
Conclusions and Future Work
Our results for the FE task have not been quite promising while previous applications of these approaches to other datasets such as the Corel 5k and ImageCLEF 2008 have performed quite well. In particular, our statistical co-occurrence approach failed to provide significant improvement over the probabilistic annotation framework. An explanation for this can be found in the small number of terms of the vocabulary that hinders the functioning of the algorithm and another in the nature of the vocabulary itself, where we have almost no semantically similar terms. With respect to the search task (SE), we are interested in improving the coverage of the search engine index by adjusting the selection process for the keyframe in the short-term. This would see the number of frames indexed by the search engine increase to approximately 120,000 media objects. By choosing a potentially more representative set of frames that cover the shots more completely it is hoped that a larger number of results with be found. We also hope that by taking a sequence of frames from each shot to improve the performance of the search engine for queries that include movement. In the longer-term, we are developing a more user-friendly interface to our search engine which will hopefully enable participation in future interactive search tasks. In addition we intend to investigate some options for amalgamating search results based on similarity and temporal proximity to improve both the precision and the quality of the search results. This temporal comparison may also be extended to enable better support for queries for actions. Overall, we found participation in the TRECVID evaluation to be a valuable learning experience for our group.
Acknowledgements: This work was partially funded by the Pharos project sponsored by the Commission of the European Communities as part of the Information Society Technologies programme under grant number IST-FP6-45035.
References 1. J. A. Aslam and M. Montague. Models for metasearch. In Proceedings of the 24th annual international ACM SIGIR conference on Research and development in information retrieval (SIGIR), pages 276–284. ACM, 2001. 2. S. Ayache and G. Qu´enot. TRECVID 2007 collaborative annotation using active learning. In TREC Video Retrieval Evaluation Proceedings, 2007.
3. T. H. Cormen, C. E. Leiserson, R. L. Rivest, and C. Stein. Introduction to Algorithms, 2nd edition. MIT Press, McGraw-Hill Book Company, 2000. 4. P. Duygulu, K. Barnard, J. F. G. de Freitas, and D. A. Forsyth. Object recognition as machine translation: Learning a lexicon for a fixed image vocabulary. In European Conference on Computer Vision, pages 97–112, 2002. 5. S. T. et al. TRECVID 2008 High-Level Feature Extraction by MCG-ICT-CAS. In TREC Video Retrieval Evaluation Proceedings, 2008. 6. A. Hanbury and J. Serra. Mathematical morphology in the CIELAB space. Image Analysis & Stereology, 21:201–206, 2002. 7. R. Hu, S. Ruger, D. Song, H. Liu, and Z. Huang. Dissimilarity measures for content-based image retrieval. Multimedia and Expo, 2008 IEEE International Conference on, pages 1365–1368, 2008. 8. V. Lavrenko, R. Manmatha, and J. Jeon. A model for learning the semantics of pictures. In Advances in Neural Information Processing Systems (NIPS), 2003. 9. A. Llorente and S. R¨ uger. Can a probabilistic image annotation system be improved using a co-occurrence approach? In Proceedings of the 3rd International Conference on Semantic and Digital Media Technologies (SAMT), 2008. 10. B. S. Manjunath, J. R. Ohm, V. V. Vinod, , and A. Yamada. Color and texture descriptors. IEEE Transactions On Circuits And Systems For Video Technology, 11(6):703–715, Jun 2001. 11. D. Metzler and R. Manmatha. An inference network approach to image retrieval. In Proceedings of the 3rd International Conference on Image and Video Retrieval (CVIR), pages 42–50, 2004. 12. M. Naphade, J. R. Smith, J. Tesic, S.-F. Chang, W. Hsu, L. Kennedy, A. Hauptmann, and J. Curtis. Largescale concept ontology for multimedia. IEEE MultiMedia, 13(3):86–91, 2006. 13. M. J. Pickering, D. Heesch, and D. Bull. Video retrieval using global features in keyframes. In Proceedings of the Eleventh Text REtrieval Conference (TREC-11), 2002. 14. D. Pye, N. J. Hollinghurst, T. J. Mills, and K. R. Wood. Audio-visual segmentation for content-based retrieval. In 5th International Conference on Spoken Language Processing, 1998. 15. A. F. Smeaton, P. Over, and W. Kraaij. Evaluation campaigns and TRECVID. In Proceedings of the 8th ACM international workshop on Multimedia information retrieval (MIR), pages 321–330, New York, NY, USA, 2006. ACM. 16. H. Tamura, T. Mori, and T. Yamawaki. Textural features corresponding to visual perception. IEEE Transactions on Systems, Man and Cybernetics, 8(6):460–473, June 1978. 17. I. .-. F. I. Technology. Multimedia content description interface – part 5: Multimedia description multimedia content description interface. Technical report, MPEG-7, 2001. 18. I. .-. F. I. Technology. Multimedia content description interface - part 12: Query format. Technical report, MPQF, 2008. 19. A. Yavlinsky, E. Schofield, and S. R¨ uger. Automated image annotation using global features and robust nonparametric density estimation. In International ACM Conference on Image and Video Retrieval (CIVR), pages 507–517, 2005. 20. E. Yilmaz and J. A. Aslam. Estimating average precision with incomplete and imperfect judgments. In Proceedings of the 15th ACM international conference on Information and knowledge management (CIKM), pages 102–111, New York, NY, USA, 2006. ACM. 21. H. J. Zhang, A. Kankanhalli, and S. W. Smoliar. Automatic partitioning of full-motion video. Multimedia Systems, 1(1):10–28, 1993.