Figure S3. SHAPE-Seq v1.0 library indexing strategy. Figure S4. SHAPE-Seq .... AGACCGTGCATCATGAGCACGAATCCTA. AACCTCAA. SAM I riboswitch, T.
Supporting Information for
SHAPE-Seq 2.0: Systematic Optimization and Extension of HighThroughput Chemical Probing of RNA Secondary Structure with Next Generation Sequencing. David Loughrey1, Kyle E. Watters1, Alexander H. Settle1 and Julius B. Lucks1* 1 – School of Chemical and Biomolecular Engineering, Cornell University, Ithaca NY 14850 Table/Figure Table S1 Table S2 Figure S1 Figure S2 Figure S3 Figure S4 Table S3 Figure S5 Figure S6 Figure S7 Figure S8 Figure S9 Figure S10 Figure S11 Figure S12 Figure S13 Figure S14 Table S4 Table S5 Table S6 Table S7
Description RNA sequences used in this study. RNA folding buffer conditions and ligand concentrations used in replicate experiments. SHAPE-CE Flowchart SHAPE-Seq v1.0 and Second Adapter Variation Library (Minimal, Inverted) Construction Schematics. SHAPE-Seq v1.0 library indexing strategy. SHAPE-Seq v2.0 Library Construction Schematic. List of barcoded reverse transcription primers used during the SHAPESeq v2.0 library generation. QuSHAPE vs. SHAPE-Seq (v1.0) detailed comparisons. SHAPE-Seq v1.0 vs. Minimal or Inverted adapter variations for RNase P and tRNA. Time course of CircLigase I ligation efficiency. Ligase comparison for addition of SHAPE-Seq second adapter. Modification and optimization of RT primer blocking groups for adapter ligation. Effect of 3’ blocking group on second adapter concatemerization and ligation efficiency. SHAPE-Seq v1.0 fragment distributions for different numbers of PCR cycles. SHAPE-Seq v2.0 vs. SHAPE-Seq v1.0. Choice of 5’ adenylated linker sequence for SHAPE-Seq 2.0 universal priming strategy. SHAPE-Seq v2.0 reactivities generated from the MiSeq and HiSeq platforms. RNA structure prediction accuracy using the RNAStructure fold algorithm with no SHAPE constraints RNA structure prediction accuracy using SHAPE-Seq v2.0 reactivity data (ρ’s) as constraints in the RNAStructure fold algorithm, m = 1.8, b = -0.6) RNA structure prediction accuracy using SHAPE-Seq v2.0 reactivity data (ρ’s) as constraints in the RNAStructure fold algorithm, m = 1.1, b = -0.3) Data deposition table.
1
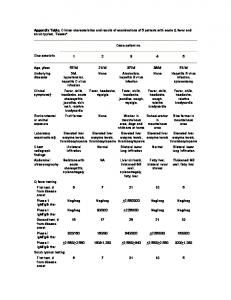
Table S1: RNA sequences used in this study. Sequences are listed as DNA sequence for convenient use in Spats. Blue lettering indicates the structure cassette sequence initially developed for SHAPE analysis using capillary electrophoresis (1), or the GG sequence required for T7 RNA polymerase in vitro transcription. Green lettering indicates an RNA-specific barcode used for multiplexing SHAPE-Seq v1.0 experiments (2, 3). Red lettering indicates reverse transcriptase (RT) priming site. Note that the SHAPE-Seq v2.0 uses an RT priming site that is introduced after linker ligation (Figure S4), so no explicit RT priming site is present in the RNA, although it is appended to the RNA sequence before Spats analysis. Name 5S rRNA, E. coli
Adenine riboswitch, V. vulnificus Cyclic diGMP riboswitch, V. cholerae P4-P6, Tetrahymena group I intron ribozyme
RNAse P, specificity domain, B. subtilis
tRNA coli
phe
, E.
Hepatitis C virus IRES domain
Sequence GGCCTTCGGGCCAAATGCCTGGCGGCC GTAGCGCGGTGGTCCCACCTGACCCCA TGCCGAACTCAGAAGTGAAACGCCGTA GCGCCGATGGTAGTGTGGGGTCTCCCC ATGCGAGAGTAGGGAACTGCCAGGCAT CCGATCCGCTTCGGCGGATCCAAATAAA TCGGGCTTCGGTCCGGTTC GGCCTTCGGGCCAAACGCTTCATATAAT CCTAATGATATGGTTTGGGAGTTTCTAC CAAGAGCCTTAAACTCTTGATTATGAAGT GCCGATCCGCTTCGGCGGATCCAAACA AATCGGGCTTCGGTCCGGTTC GGTGTCACGCACAGGGCAAACCATTCG AAAGAGTGGGACGCAAAGCCTCCGGCC TAAACCAGAAGACATGGTAGGTAGCGG GGTTACCGATGGCAAAATGCATACCCGA TCCGCTTCGGCGGATCCAAATCGGGCTT CGGTCCGGTTC GGCCTTCGGGCCAAGAATTGCGGGAAA GGGGTCAACAGCCGTTCAGTACCAAGT CTCAGGGGAAACTTTGAGATGGCCTTGC AAAGGGTATGGTAATAAGCTGACGGACA TGGTCCTAACCACGCAGCCAAGTCCTAA GTCAACAGATCTTCTGTTGATATGGATG CAGTTCAAAACCCCGATCCGCTTCGGCG GATCCAATAAAATCGGGCTTCGGTCCGG TTC GGTCGTGCCTAGCGAAGTCATAAGCTAG GGCAGTCTTTAGAGGCTGACGGCAGGA AAAAAGCCTACGTCTTCGGATATGGCTG AGTATCCTTGAAAGTGCCACAGTGACGA AGTCTCACTAGAAATGGTGAGAGTGGAA CGCGGTAAACCCCTCGACCGATCCGCT TCGGCGGATCCCTTGAAATCGGGCTTC GGTCCGGTTC GGCCTTCGGGCCAAGCGGATTTAGCTC AGTTGGGAGAGCGCCAGACTGAAGATC TGGAGGTCCTGTGTTCGATCCACAGAAT TCGCACCACCGATCCGCTTCGGCGGAT CCAAAGAAATCGGGCTTCGGTCCGGTTC
Experiments QuSHAPE, SHAPE-Seq v1.0
GGCCTTCGGGCCAACCATGAATCACTCC CCTGTGAGGAACTACTGTCTTCACGCAG AAAGCGTCTAGCCATGGCGTTAGTATGA
QuSHAPE, SHAPE-Seq v1.0
QuSHAPE, SHAPE-Seq v1.0
Figure Figure 2, Figure 3, Figure 5, SI Figure 5, SI Figure 11, SI Figure 12, SI Figure 14 Figure 2, Figure 5, SI Figure 5, SI Figure 12
QuSHAPE, SHAPE-Seq v1.0
Figure 5, SI Figure 12
QuSHAPE, SHAPE-Seq v1.0
Figure 2, Figure 5, SI Figure 5, SI Figure 12, SI Figure 14
QuSHAPE, SHAPE-Seq v1.0
Figure 2, Figure 5 SI Figure 5, SI Figure 6, SI Figure 12
QuSHAPE, SHAPE-Seq v1.0
Figure 2, Figure 3, Figure 5, SI Figure 5 SI Figure 6, SI Figure 11, SI Figure 12, SI Figure 14 Figure 5, SI Figure 12
2
SAM I riboswitch, T. tencongensis
TPP riboswitch, E. coli
5S rRNA, E. coli
Adenine Riboswitch, V. vulnificus Cyclic diGMP riboswitch, V. cholerae P4-P6, Tetrahymena group I intron ribozyme RNAse P, specificity domain, B. subtilis tRNA coli
phe
, E.
Hepatitis C virus IRES domain
GTGTCGTGCAGCCTCCAGGACCCCCCC TCCCGGGAGAGCCATAGTGGTCTGCGG AACCGGTGAGTACACCGGAATTGCCAG GACGACCGGGTCCTTTCTTGGATTAACC CGCTCAATGCCTGGAGATTTGGGCGTG CCCCCGCGAGACTGCTAGCCGAGTAGT GTTGGGTCGCGAAAGGCCTTGTGGTAC TGCCTGATAGGGTGCTTGCGAGTGCCC CGGGAGGTCTCGTAGACCGTGCATCAT GAGCACGAATCCTAAACCTCAACCGATC CGCTTCGGCGGATCCAAGCAAATCGGG CTTCGGTCCGGTTC GGCCTTCGGGCCAATTCTTATCAAGAGA AGCAGAGGGACTGGCCCGACGAAGCTT CAGCAACCGGTGTAATGGCGATCAGCC ATGACCAAGGTGCTAAATCCAGCAAGCT CGAACAGCTTGGAAGATAAGAACCGATC CGCTTCGGCGGATCCAACCAAATCGGG CTTCGGTCCGGTTC GGCCTTCGGGCCAAGACTCGGGGTGCC CTTCTGCGTGAAGGCTGAGAAATACCCG TATCACCTGATCTGGATAATGCCAGCGT AGGGAAGTTCCCGATCCGCTTCGGCGG ATCCATAAAAATCGGGCTTCGGTCCGGT TC GGATGCCTGGCGGCCGTAGCGCGGTG GTCCCACCTGACCCCATGCCGAACTCA GAAGTGAAACGCCGTAGCGCCGATGGT AGTGTGGGGTCTCCCCATGCGAGAGTA GGGAACTGCCAGGCAT GGACGCTTCATATAATCCTAATGATATG GTTTGGGAGTTTCTACCAAGAGCCTTAA ACTCTTGATTATGAAGTG GGTGTCACGCACAGGGCAAACCATTCG AAAGAGTGGGACGCAAAGCCTCCGGCC TAAACCAGAAGACATGGTAGGTAGCGG GGTTACCGATGGCAAAATGCATAC GGAATTGCGGGAAAGGGGTCAACAGCC GTTCAGTACCAAGTCTCAGGGGAAACTT TGAGATGGCCTTGCAAAGGGTATGGTAA TAAGCTGACGGACATGGTCCTAACCACG CAGCCAAGTCCTAAGTCAACAGATCTTC TGTTGATATGGATGCAGTTCAAAACC GGTCGTGCCTAGCGAAGTCATAAGCTAG GGCAGTCTTTAGAGGCTGACGGCAGGA AAAAAGCCTACGTCTTCGGATATGGCTG AGTATCCTTGAAAGTGCCACAGTGACGA AGTCTCACTAGAAATGGTGAGAGTGGAA CGCGGTAAACCCCTCGA GGCGGATTTAGCTCAGTTGGGAGAGCG CCAGACTGAAGATCTGGAGGTCCTGTGT TCGATCCACAGAATTCGCACCA GGCCATGAATCACTCCCCTGTGAGGAAC TACTGTCTTCACGCAGAAAGCGTCTAGC CATGGCGTTAGTATGAGTGTCGTGCAGC
QuSHAPE, SHAPE-Seq v1.0
Figure 5, SI Figure 12
QuSHAPE, SHAPE-Seq v1.0
Figure 5, SI Figure 12
SHAPE-Seq v2.0
Figure 5, SI Figure 12
SHAPE-Seq v2.0
Figure 5, SI Figure 12
SHAPE-Seq v2.0
Figure 5, SI Figure 12
SHAPE-Seq v2.0
Figure 5, SI Figure 12
SHAPE-Seq v2.0
Figure 5, SI Figure 12
SHAPE-Seq v2.0
Figure 5, SI Figure 12
SHAPE-Seq v2.0
Figure 5, SI Figure 12
3
SAM I riboswitch, T. tencongensis TPP riboswitch, E. coli
CTCCAGGACCCCCCCTCCCGGGAGAGC CATAGTGGTCTGCGGAACCGGTGAGTA CACCGGAATTGCCAGGACGACCGGGTC CTTTCTTGGATTAACCCGCTCAATGCCT GGAGATTTGGGCGTGCCCCCGCGAGAC TGCTAGCCGAGTAGTGTTGGGTCGCGA AAGGCCTTGTGGTACTGCCTGATAGGGT GCTTGCGAGTGCCCCGGGAGGTCTCGT AGACCGTGCATCATGAGCACGAATCCTA AACCTCAA GGTTCTTATCAAGAGAAGCAGAGGGACT GGCCCGACGAAGCTTCAGCAACCGGTG TAATGGCGATCAGCCATGACCAAGGTGC TAAATCCAGCAAGCTCGAACAGCTTGGA AGATAAGAA GGACTCGGGGTGCCCTTCTGCGTGAAG GCTGAGAAATACCCGTATCACCTGATCT GGATAATGCCAGCGTAGGGAAGTTC
SHAPE-Seq v2.0
Figure 5, SI Figure 12
SHAPE-Seq v2.0
Figure 5, SI Figure 12
4
Table S2. RNA folding buffer conditions and ligand concentrations used in replicate experiments. RNA Buffer / Ligand Reference 5S rRNA, E. coli 10 mM MgCl2, 100 mM NaCl and 100 mM (4) HEPES (pH 8.0)
Adenine riboswitch, V. vulnificus Cyclic di-GMP riboswitch, V. cholerae P4-P6, Tetrahymena group I intron ribozyme RNAse P, specificity domain, B. subtilis tRNA
phe
, E. coli
Hepatitis C virus IRES domain SAM I riboswitch, T. tencongensis TPP riboswitch, E. coli
10 mM MgCl2, 100 mM NaCl and 100 mM HEPES (pH 8.0), 5µM Ligand 10 mM MgCl2, 100 mM NaCl and 100 mM HEPES (pH 8.0), 5µM Ligand 10 mM MgCl2, 100 mM NaCl and 100 mM HEPES (pH 8.0) 10 mM MgCl2, 100 mM NaCl and 100 mM HEPES (pH 8.0) 10 mM MgCl2, 100 mM NaCl and 100 mM HEPES (pH 8.0) 10 mM MgCl2, 100 mM NaCl and 100 mM HEPES (pH 8.0) 10 mM MgCl2, 100 mM NaCl and 100 mM HEPES (pH 8.0), 5µM Ligand 10 mM MgCl2, 100 mM NaCl and 100 mM HEPES (pH 8.0), 5µM Ligand
(4) (4) (4) (2) (4) (5) (5) (5)
5
Legend RNA = SHAPE Reagent DNA Reverse se Transcription Tran Primers: rs:
5’3’
Input RNA Treated (+)
(+)
(-)
Untreated (-) (DMSO)
RNA Modification 5’ 5’
3’
Reverse Transcription
5’’ 5
3’
RNA Hydrolysis Output Outpu tpu ut ((+)) ssDNA 5’
Output p ((-)) ssDNA 3’
5’’
3’
Capillary Electrophoresis
(+) (-)
Signal Decay Correction, Peak Integration, and Subtraction
Theta
0.2
0.1
0
Nucleotide Position (5’ to 3’)
Single Nucleotide Resolution Reactivity Data
Figure S1. SHAPE-CE Flowchart. Like SHAPE-Seq, SHAPE-CE begins by modifying RNAs with a SHAPE reagent such as 1M7 (1). However, unlike SHAPE-Seq, reverse transcription (RT) is performed with fluorescent primers to create a pool of cDNAs (whose length distribution reflects the distribution of modification positions, like SHAPE-Seq). Two different fluorophores distinguish the modified and control reactions, which are detected with capillary electrophoresis (CE). The resulting CE traces are manually integrated and subtracted to obtain a reactivity spectrum for an RNA. An example with E. coli tRNAphe is shown. Not shown are additional dideoxy-terminated sequencing reactions that are used to align CE peaks to the RNA sequence.
6
a
Library Preparation Modified RNA Truncated due to modification
Index (+/- Handle)
RT P
A_
RT A_adapter_t
Index
ad
ap
RT P
Ligation
ter
Index
A_adapter_b
RT P
for priming off of the 3’ structure cassette
CUSTOM SEQUENCE
for priming off of the RNA sequence
(+) RRRY (-) YYYR
A_adapter_t
AATGATACGGCGACCACCGAGATCTACACTCTTTCCCTACACGACGCTCTTCCGATCT
PCR w/ PE_F and PE_R A_adapter_t
GAACCGGACCGAAGCCCG
Index = (+/-) Handle A_adapter_b
A_adapter_t
RT P = Reverse Transcriptase Primer or
_t
SHAPE-Seq v1.0
{Seq} = Reverse Complement of Seq
Index
A_adapter_b
RT P
A_adapter_b
/5Phos/AGATCGGAAGAGCGGTTCAGCAGGAATGCCGAGACCGATCTCGTATGCCGTCTTCTGCTTG/3SpC3/
Sequencing
Read 1 - Contains Handle Index Sequencing Primer Index
RT P
PE_F = A_adapter_t PE_R = {A_adapter_b}
CAAGCAGAAGACGGCATACGAGATCGGTCTCGGCATTCCTGCTGAACCGCTCTTCCGATCT
Read 2 (RevComp) Contains Modification Position Sequencing Primer
b
Library Preparation Modified RNA
SHAPE-Seq v1.0 Minimal
RT P = Reverse Transcriptase Primer
Truncated due to modification
RT P
Index (+/- Handle)
A_
RT A_adapter_t
Index
ad
ap
RT P
Ligation
ter
_t
for priming off of the 3’ structure cassette
CUSTOM SEQUENCE
for priming off of the RNA sequence
Index = (+/-) Handle (+) RRRY (-) YYYR
A_adapter_b
RT P
GAACCGGACCGAAGCCCG
or
A_adapter_b Index
A_adapter_t
A_adapter_t
AATGATACGGCGACCACCGAGATCTACACTCTTTCCCTACACGACGCTCTTCCGATCT
PCR w/ PE_F and PE_R A_adapter_t
{Seq} = Reverse Complement of Seq
Index
A_adapter_b
RT P
Sequencing
Read 1 - Contains Handle Index Sequencing Primer Index
A_adapter_b (Minimal)
/5Phos/AGATCGGAAGAGCGGTTCAGCAGGA/3SpC3/
RT P
PE_F = A_adapter_t PE_R = {Full A_adapter_b from SHAPE-Seq v1.0}
CAAGCAGAAGACGGCATACGAGATCGGTCTCGGCATTCCTGCTGAACCGCTCTTCCGATCT
Read 2 (RevComp) Contains Modification Position Sequencing Primer
c
Library Preparation Modified RNA Truncated due to modification
RT P
Index (+/- Handle) A_
RT A_adapter_b
Index
RT P
Ligation
ad
ter
_b
Index
RT P
for priming off of the 3’ structure cassette
CUSTOM SEQUENCE
for priming off of the RNA sequence
Index = (+/-) Handle (+) RRRY (-) YYYR
A_adapter_t
A_adapter_b (Inverted)
CAAGCAGAAGACGGCATACGAGATCGGTCTCGGCATTCCTGCTGAACCGCTCTTCCGATCT
PCR w/ PE_F and PE_R A_adapter_b Index
SHAPE-Seq v1.0 Inverted
GAACCGGACCGAAGCCCG
or
ap
A_adapter_t A_adapter_b
{Seq} = Reverse Complement of Seq RT P = Reverse Transcriptase Primer
RT P
Read 1 - Contains Modification Position
A_adapter_t
A_adapter_t (Inverted)
/5Phos/AGATCGGAAGAGCGTCGTGTAGGGAAAGAGTGTAGATCTCGGTGGTCGCCGTATCATT/3SpC3/
Sequencing
PE_F = A_adapter_b (without modifications) PE_R = {A_adapter_t}
CAAGCAGAAGACGGCATACGAGATCGGTCTCGGCATTCCTGCTGAACCGCTCTTCCGATCT Sequencing Primer
Read 2 (RevComp) Contains Handle Index Sequencing Primer Index
RT P
Figure S2. SHAPE-Seq v1.0 and Second Adapter Variation Library Construction Schematics. The left hand side shows adapter and primer orientations for library preparation (top), and which pieces of information are obtained from the library during the sequencing process (bottom), for (a) SHAPE-Seq v1.0, (b) the ‘Minimal’ adapter configuration, and (c) the ‘Inverted’ adapter configuration. The right hand side shows DNA sequences of primers and adapters (5’ to 3’ orientation), color-coded to match the schematic.
7
Library Preparation Modified RNA
SHAPE-Seq v1.0 Indexed
RT P = Reverse Transcriptase Primer
Truncated due to modification
RT P
Index (+/- Handle)
A_
RT A_adapter_t
Index
RT P
Ligation
ad
ap
A_adapter_t
Index
_t
for priming off of the 3’ structure cassette
CUSTOM SEQUENCE
for priming off of the RNA sequence
Index = (+/-) Handle A_adapter_b
RT P
(+) RRRY (-) YYYR
A_adapter_t
AATGATACGGCGACCACCGAGATCTACACTCTTTCCCTACACGACGCTCTTCCGATCT
PCR w/ PE_F and PE_R Index
GAACCGGACCGAAGCCCG
or
ter
A_adapter_b
A_adapter_t
{Seq} = Reverse Complement of Seq
A_adapter_b
RT P
A_adapter_b (Indexed)
/5Phos/AGATCGGAAGAGCACACGTCTGAACTCCAGTCAC/3SpC3/
Sequencing
Read 1 - Contains Handle Index Sequencing Primer Index
RT P
PE_F = A_adapter_t PE_R = 5’ of Illumina Adapter + Illumina Index + {A_adapter_b}
CAAGCAGAAGACGGCATACGAGATGTGACTGGAGTTCAGACGTGTGCTC
Index Read - Determines Illumina Index
Illumina Index Sequencing Primer
Read 2 (RevComp) - Contains Modification Position Sequencing Primer
Figure S3. SHAPE-Seq v1.0 library indexing strategy. The left hand side shows adapter and primer orientations for library preparation (top), and which pieces of information are obtained from the library during the sequencing process (bottom) for the SHAPE-Seq v1.0 Indexed library preparation strategy (compare to Figure S2A). The difference between SHAPE-Seq v1.0 and SHAPE-Seq v1.0 Indexed is the presence of Illumina indexing sequences that are added during PCR and sequenced separately during the Index Read. This allows multiple SHAPE-Seq libraries to be sequenced in the same lane following standard Illumina indexing strategies. The right hand side shows DNA sequences of primers and adapters (5’ to 3’ orientation), colorcoded to match the schematic.
8
Library Preparation
Modified RNA
{Seq} = Reverse Complement of Seq
SHAPE-Seq v2.0
Linker = 5’ Adenylated Linker (DNA) /5rApp/CACTCGGGCACCAAGGA/3ddC/
Linker Ligation
RT P = Reverse Transcriptase Primer GTCCTTGGTGCCCGAGTG
RT P
Truncated due to modification
RT A_adapter_t Index
Index (+/- Handle)
A_
ad
RT P
ap
ter
_t
Index = (+/-) Handle (+) RRRY (-) YYYR
A_adapter_t (v2.0)
CTTTCCCTACACGACGCTCTTCCGATCT
Ligation
A_adapter_b (Indexed)
A_adapter_b A_adapter_t Index
RT P
A_adapter_b
RT P
A_adapter_b
PE_F = Rest of Illumina Adapter + A_adapter_t
PCR w/ PE_F and PE_R A_adapter_t
Index
/5Phos/AGATCGGAAGAGCACACGTCTGAACTCCAGTCAC/3SpC3/
AATGATACGGCGACCACCGAGATCTACACTCTTTCCCTACACGACGCTCTTCCGATCT
PE_R = Rest of Illumina Adapter + Illumina Index + {A_adapter_b}
CAAGCAGAAGACGGCATACGAGATGTGACTGGAGTTCAGACGTGTGCTC
Sequencing
Read 1 - Contains Handle Index Sequencing Primer Index
RT P
Index Read - Determines Illumina Index
Illumina Index Sequencing Primer
Read 2 (RevComp) - Contains Modification Position Sequencing Primer
Figure S4. SHAPE-Seq v2.0 Library Construction Schematic. The left hand side shows adapter and primer orientations for library preparation (top), and which pieces of information are obtained from the library during the sequencing process (bottom) for the Indexed library preparation strategy. The right hand side shows DNA sequences of primers and adapters (5’ to 3’ orientation), color-coded to match the schematic. SHAPE-Seq v2.0 uses a ‘universal’ RT priming strategy as well as the standard Illumina library indexing strategy.
9
Table S3. List of barcoded reverse transcription primers used during the SHAPE-Seq v2.0 library generation. Illumina adapter sequences are in black, the (+/-) handles are in green, internal barcodes are in red, and the RT priming sites are in purple. Illumina TruSeq indexes can be found at: http://supportres.illumina.com/documents/myillumina/6378de81-c0cc-47d0-9281724878bb1c30/2012-09-18_illuminacustomersequenceletter.pdf RNA RT Primer Sequences Illumina Index# (TruSeq) phe /5Biosg/CTTTCCCTACACGACGCTCTTCCGAT tRNA 1,2,3
Adenine riboswitch, V. vulnificus 5S rRNA, E. coli P4-P6, Tetrahymena group I intron ribozyme RNAse P, specificity domain, B. subtilis TPP riboswitch, E. coli SAM I riboswitch, T. tencongensis Cyclic di-GMP riboswitch, V. cholerae Hepatitis C virus IRES domain
CTYYYRgtccttggtgcccgagtg /5Biosg/CTTTCCCTACACGACGCTCTTCCGAT CTRRRYgtccttggtgcccgagtg /5Biosg/CTTTCCCTACACGACGCTCTTCCGAT CTYYYRgtccttggtgcccgagtg /5Biosg/CTTTCCCTACACGACGCTCTTCCGAT CTRRRYgtccttggtgcccgagtg /5Biosg/CTTTCCCTACACGACGCTCTTCCGAT CTYYYRgtccttggtgcccgagtg /5Biosg/CTTTCCCTACACGACGCTCTTCCGAT CTRRRYgtccttggtgcccgagtg /5Biosg/CTTTCCCTACACGACGCTCTTCCGAT CTYYYRCCgtccttggtgcccgagtg /5Biosg/CTTTCCCTACACGACGCTCTTCCGAT CTRRRYCCgtccttggtgcccgagtg /5Biosg/CTTTCCCTACACGACGCTCTTCCGAT CTYYYRAgtccttggtgcccgagtg /5Biosg/CTTTCCCTACACGACGCTCTTCCGAT CTRRRYAgtccttggtgcccgagtg /5Biosg/CTTTCCCTACACGACGCTCTTCCGAT CTYYYRAgtccttggtgcccgagtg /5Biosg/CTTTCCCTACACGACGCTCTTCCGAT CTRRRYAgtccttggtgcccgagtg /5Biosg/CTTTCCCTACACGACGCTCTTCCGAT CTYYYRAgtccttggtgcccgagtg /5Biosg/CTTTCCCTACACGACGCTCTTCCGAT CTRRRYAgtccttggtgcccgagtg /5Biosg/CTTTCCCTACACGACGCTCTTCCGAT CTYYYRCCgtccttggtgcccgagtg /5Biosg/CTTTCCCTACACGACGCTCTTCCGAT CTRRRYCCgtccttggtgcccgagtg /5Biosg/CTTTCCCTACACGACGCTCTTCCGAT CTYYYRCCgtccttggtgcccgagtg /5Biosg/CTTTCCCTACACGACGCTCTTCCGAT CTRRRYCCgtccttggtgcccgagtg
4,5,6
1,2,3
1,2,3
4,5,6
4,5,6
10,11,12
7,8,9
10,11,12
10
55
a
50
tRNA phe 0.15
Theta
45
40
SHAPE-Seq QuSHAPE R = 0.88
0.10 0.05 0
35
10
20
30
40
50
60
70
80
90
100
110
120
130
Nucleotide
30
0.15
Theta
20
15
0.15 SHAPE-Seq Theta
25
0.10
0.05 10
0.05
0
5
30
32
34
36
38
40
42
44
46
48
50
52
0.01
0.10
0 0
0.01
0
54
0
Nucleotide
0.02
0.04
0.06 0.08 0.10 QuSHAPE Theta
0.12
0.14
0 0 55
5
b 0.4
50
10
15
20
25
30
Theta
40
40
45
50
55
Adenine Riboswitch SHAPE-Seq QuSHAPE R = 0.95
0.3 45
35
0.2 0.1 0
35
0
10
20
30
40
50
60
70
80
90
100
110
120
130
Nucleotide
30
0.4 SHAPE-Seq Theta
25
0.3
Theta
20
15
0.2 0.1
10
0
5
25
30
35
40
45
50
0.010
0.2 0.005
0.1 0 0
0.005 0.010
0
55
0
Nucleotide
0.05
0.10 0.15 QuSHAPE Theta
0.20
0.25
0 0 55
5
c
50
10
15
20
25
30
35
Theta
40
45
50
55
5S SHAPE-Seq QuSHAPE R = 0.34
0.15
45
40
0.10 0.05 0
35
0
20
40
60
80
100
120
140
160
180
Nucleotide
30
0.08
Theta
20
15
SHAPE-Seq Theta
25
0.05
10
0
5
0.06 0.02 0.04 0.02
0 0
0.01
0.02
0 40
45
50
55
60
65
70
0
Nucleotide
0.01
0.02
0.03
0.04
0.05
0.06
0.07
QuSHAPE Theta
0 0
5
10
15
20
25
30
35
40
45
50
55
11
55
d
P4-P6, Tetrahymena Group I Intron Ribozyme
50
SHAPE-Seq QuSHAPE R = 0.62
0.10
Theta
45
40
0.05 0
35
0
20
40
60
80
100
120
140
160
180
200
220
Nucleotide
30
25
0.10
Theta
20
15
SHAPE-Seq Theta
0.10
0.05
10
0.02 0.05
0 0
0
5
0.01
0.02
0 80
82
84
86
88
90
92
0
0.02
Nucleotide
0.04
QuSHAPE Theta
0 0
55
5
e
10
15
20
25
30
35
Theta
50
55
SHAPE-Seq QuSHAPE R = 0.70
0.10
40
45
RNase P
50
45
40
0.05 0
35
0
20
40
60
80
100
120
140
160
180
200
Nucleotide
30
SHAPE-Seq Theta
25
0.10
Theta
20
15
0.05
10
0
5
0.10 0.02 0.05 0 0
0.01
0.02
0 15
20
25
30
35
40
45
0
Nucleotide
0.01
0.02
0.03
0.04
0.05
0.06
QuSHAPE Theta
0 0
5
10
15
20
25
30
35
40
45
50
55
Figure S5. QuSHAPE vs. SHAPE-Seq (v1.0) detailed comparisons. For each RNA, SHAPESeq and QuSHAPE 𝜃’s are plotted on top, with a zoomed window on portions of the comparison shown on the bottom left. The bottom right shows SHAPE-Seq vs. QuSHAPE 𝜃’s plotted as a scatter plot, from which the Pearson’s correlation (R) between the two techniques is calculated. Gray boxes represent regions for which no QuSHAPE data is available. Due to difficulties encountered in the alignment step of the QuSHAPE data analysis pipeline, we often found that a single QuSHAPE experiment yielded only a fraction of the reactivities for an individual RNA. To remedy this, we performed replicate QuSHAPE experiments for each RNA, and calculated the average and standard deviation of the QuSHAPE reactivities for each nucleotide position. These QuSHAPE reactivities were then converted to QuSHAPE 𝜃 ’s by dividing by a normalization factor so that they summed to 1 over the range of nucleotides for which reactivity data was obtained. Overall, there was a strong degree of correlation between the two methods for each of the RNAs. Specifically, the Pearson correlations between θ’s for each RNA were: 0.88 (tRNAphe) 0.70 (RNase P), 0.62 (ribozyme) and 0.95 (adenine riboswitch aptamer). Only the historically difficult 5S rRNA had a poor correlation (0.34).
12
55
RNAseP SHAPE-Seq v1.0 vs. Minimal
a (+) Distribution
50
45
40
35
v1.0 (+) Minimal (+)
0.15
0.14
0.10 0.05
0
50
100
v1.0 Theta
0
30
150
Nucleotide 0.20
(-) Distribution
25
20
15
10
v1.0 (-) Minimal (-)
0.15
0.10 0.08 0.06 0.04
0.10
0.02
0.05
0
0 0
5
R=0.92
0.12
50
100
0
150
0.05
0.10
0.15
Minimal Theta
Nucleotide 0 5
10
15
20
b 0.20 tRNA phe SHAPE-Seq v1.0 vs. Inverted
50
(+) Distribution
0 55
45
40
35
25
30
0.14
0.05 40
60
80
v1.0 Theta
20
100
Nucleotide 0.30
(-) Distribution
10
v1.0 (-) Inverted (-)
0.25 0.20
55
0.10 0.08 0.06 0.04
0.15 0.10
0.02
0.05 0
0 0
5
50
0.12
0
15
45
R=0.68
0.10
0
20
40
v1.0 (+) Inverted (+)
0.15
30
25
35
20
40
60
80
0
100
0.05
0.10
0.15
Inverted Theta
Nucleotide 0 0
5
10
15
20
25
30
35
40
45
50
55
Figure S6. SHAPE-Seq v1.0 vs. Minimal or Inverted adapter variations for RNase P and tRNA. (+) and (-) fragment distributions are plotted for (a) v1.0 vs. Minimal for RNase P, and for (b) v1.0 vs. Inverted for tRNA. Pearson correlation values for these comparisons are summarized in Figure 2. Arrows denote specific places of discrepancy discussed in the text. Scatter plots show 𝜃 value comparisons between the two libraries for the RNAs with Pearson correlation values shown in the plots.
13
MW %Ligation
cDNA
1 hr 35%
2 hr 32%
3 hr 39%
6 hr 46%
Overnight 54%
200 nt
100 nt
Figure S7. Time course of CircLigase I ligation efficiency. A 126 nt cDNA (gray arrow) was ligated to the 61nt SHAPE-Seq v1.0 Illumina adapter (Figure S1, black arrow) for one, two, three, or six hours or overnight at 68 °C to generate a 187 nt ligation product (blue arrow). Slight ligation improvement is observable over time by integration of the disappearance of the primer band. Note, however, that the gel is stained with SYBR and only provides general trends and is not absolutely quantitative. Ligation was halted after 2 hrs because the improvement gained by further incubation was less important relative to the increase in protocol time.
14
MW Temperature Rel. Lig. Efficiency
Acceptor
Donor
CircLigase I 60 °C 68 °C 1.0 0.49
CircLigase II 60 °C 68 °C 0.82 0.17
500 nt 400 nt 300 nt 200 nt
100 nt
Figure S8. Ligase comparison for addition of SHAPE-Seq second adapter. CircLigase I and CircLigase II (Epicentre) were used to ligate the 50 nt RT primer (donor) to the 61 nt Illumina adapter (acceptor) at both 68 °C and 60 °C (manufacturer’s suggestion) for two hours. The expected ligation product is denoted by the black arrow (101 nt). We found the optimum ligation condition to be CircLigase I at 60 °C for two hours by determining the relative intensity of the ligated product band. Note, however, that the gel is stained with SYBR gold and is not absolutely quantitative.
15
Unblocked Blocked RT primer RT primer
CircLigase I
-
-
Illumina Adapter
-
+
Unblocked RT primer
Blocked RT primer
+
+
Figure S9. Modification and optimization of RT primer blocking groups for adapter ligation. Comparison of effect of blocking groups on the possible formation of RT primer concatemers. The top (blue) arrow shows the successfully ligated RT primer (gray arrow) + adapter (black arrow) (60 °C for 2 hours with Circligase I). The red arrow marks the location of adapter dimer formation (studied further below in Figure S9). No bands corresponding to RT primer concatemers were observed.
16
3 carbon spacer MW
5’ biotin
5’ unblocked
-
phosphate 5’ biotin
5’ unblocked
di-deoxy-cytosine
-
5’ biotin
5’ unblocked
-
500 nt 400 nt 300 nt
200 nt
100 nt
Figure S10. Effect of 3’ blocking group on second adapter concatemerization and ligation efficiency. Three modifications (3 carbon spacer, phosphate, and di-deoxy-cytosine) were added to the 3’ end of the adapter (black arrow), which was then ligated (60 °C for 2 hours with Circligase I) to an RT primer (gray arrow) that was either 5’ blocked (57 nt) with biotin or unblocked (54 nt). A third control lane for each 3’ modification consisting of the ligation of the adapter without RT primer is shown (-). Regardless of 3’ modification, some adapter form concatemers during the ligation, with concatemers showing up at 50 nt, near the size of the RT primers (gray arrow). However, this effect is the weakest for the 3 carbon spacer modification, which also shows the least amount of adapter concatemer ligated to the RT primer, seen as bands longer than the expected ligated product which is 79 nt or 82 nt (white arrow). While no modification stood out as the clear best, the 3’ 3-carbon spacer modification was chosen for its relative cleanliness and lower cost than di-deoxy-cytosine.
17
55
tRNA phe SHAPE-Seq v1.0 Fragment Distributions
a (+) Distribution
50
45
40
35
6x PCR 9x PCR 12x PCR 20x PCR
0.15 0.10 0.05 0 0
30
20
40
60
80
100
Nucleotide (-) Distribution
25
20
15
10
6x PCR 9x PCR 12x PCR 20x PCR
0.15 0.10 0.05 0 0
5
20
40
60
80
100
Nucleotide 0 0 55
5
b 0.20 (+) Distribution
50
45
40
35
10
15
20
25
30
35
40
45
50
55
5S rRNA SHAPE-Seq v1.0 Fragment Distributions 6x PCR 9x PCR 12x PCR 20x PCR
0.15 0.10 0.05 0 0
30
50
100
150
Nucleotide 0.25
(-) Distribution
25
20
15
10
6x PCR 9x PCR 12x PCR 20x PCR
0.20 0.15 0.10 0.05 0 0
5
50
100
150
Nucleotide 0 0
5
10
15
20
25
30
35
40
45
50
55
Figure S11. SHAPE-Seq v1.0 fragment distributions for different numbers of PCR cycles. (+) and (-) fragment distributions are plotted for SHAPE-Seq v1.0 with varying numbers of PCR cycles for (a) tRNAphe and (b) 5S rRNA (see Figure 4). Pearson correlation values for specific comparisons are shown in Figure 3.
18
55
a
50
tRNA phe 0.20
Theta
45
40
SHAPE-Seq (v2.0) SHAPE-Seq (v1.0) R = 0.92
0.15 0.10 0.05 0
35
0
10
20
30
40
50
60
70
80
90
100
110
120
130
Nucleotide
30
0.15 SHAPE-Seq (v1.0) Theta
0.20
25
0.15
Theta
20
15
0.10 0.05
10
0.10
0.05
0
5
30
32
34
36
38
40
42
44
46
48
50
52
0.01
0 0
0.01
0
54
0
Nucleotide
0.05 0.10 0.15 SHAPE-Seq (v2.0) Theta
0.20
0 0 55
5
b
10
15
20
25
30
Theta
45
50
55
SHAPE-Seq (v2.0) SHAPE-Seq (v1.0) R = 0.94
0.15
40
40
Adenine Riboswitch
50
45
35
0.10 0.05 0
35
0
10
20
30
40
50
60
70
80
90
100
110
120
130
Nucleotide
30
SHAPE-Seq (v1.0) Theta
0.15 25
0.10
Theta
20
15
0.05
10
0
5
25
30
35
40
45
50
0.010
0.2 0.005
0.1 0 0
0.005 0.010
0
55
0
Nucleotide
0.05
0.10 0.15 0.20 SHAPE-Seq (v2.0) Theta
0.25
0 0 55
5
c
50
10
15
20
25
30
35
Theta
40
45
50
55
5S SHAPE-Seq (v2.0) SHAPE-Seq (v1.0) R = 0.85
0.15
45
40
0.10 0.05 0
35
0
20
40
60
80
100
120
140
160
180
Nucleotide SHAPE-Seq (v1.0) Theta
30
25
Theta
20
15
0.05
10
0
5
40
45
50
55
60
65
70
0.06
0.04
0.02
0.02 0 0
0.01
0.02
0 0
Nucleotide
0.01
0.02
0.03
0.04
0.05
0.06
SHAPE-Seq (v2.0) Theta
0 0
5
10
15
20
25
30
35
40
45
50
55
19
55
d
P4-P6, Tetrahymena Group I Intron Ribozyme
50
SHAPE-Seq (v2.0) SHAPE-Seq (v1.0) R = 0.89
0.10
Theta
45
40
0.05 0
35
0
20
40
60
80
100
120
140
160
180
200
220
Nucleotide
25
SHAPE-Seq (v1.0) Theta
30
0.10
Theta
20
15
0.05
10
0
5
80
82
84
86
88
90
0.06
0.04
0.02 0.01
0.02 0 0
0.02
0
92
0
0.02
Nucleotide
0.04
0.06
SHAPE-Seq (v2.0) Theta
0 0
55
5
e 0.6
45
0.4
Theta
50
40
10
15
20
25
30
35
40
45
50
55
RNase P SHAPE-Seq (v2.0) SHAPE-Seq (v1.0) R = 0.80
0.2 0
35
0
20
40
60
80
100
120
140
160
180
200
Nucleotide
30
SHAPE-Seq (v1.0) Theta
0.20 25
0.15
Theta
20
15
0.10 0.05
10
0
5
15
20
25
30
35
40
0.10
0.05
0 0
0.01
0.02
0
45
0
0.01
Nucleotide
0.02
0.03
0.04
0.05
0.06
SHAPE-Seq (v2.0) Theta
0 0 55
5
f
10
15
20
25
30
35
Theta
50
55
SHAPE-Seq (v2.0) SHAPE-Seq (v1.0) R = 0.94
0.15
40
45
SAM Riboswitch
50
45
40
0.10 0.05 0
35
0
20
40
60
80
100
120
140
160
Nucleotide
30
SHAPE-Seq (v1.0) Theta
0.20 25
0.15
Theta
20
15
0.10 0.05
10
0
5
62
64
66
68
70
72
74
76
78
80
Nucleotide
0.010
0.2 0.005
0.1 0 0
0.005 0.010
0 0
0.05
0.10 0.15 0.20 SHAPE-Seq (v2.0) Theta
0.25
0 0
5
10
15
20
25
30
35
40
45
50
55
20
55
g
TPP Riboswitch
50
SHAPE-Seq (v2.0) SHAPE-Seq (v1.0) R = 0.91
0.15
Theta
45
40
0.10 0.05 0
35
0
10
20
30
40
50
60
70
80
90
100
110
120
130
Nucleotide
30
0.20
Theta
20
15
SHAPE-Seq (v1.0) Theta
0.15
25
0.10
0.05 10
0.10
0.005
0.05
0 0
0
5
25
30
35
40
45
50
0.010
0.15
0.005 0.010
0
55
0
Nucleotide
0.05 0.10 0.15 SHAPE-Seq (v2.0) Theta
0.20
0 0 55
5
h
50
10
15
20
25
30
35
Theta
40
45
50
55
cyclic-di-GMP Riboswitch 0.15
45
40
SHAPE-Seq (v2.0) SHAPE-Seq (v1.0) R = 0.83
0.10 0.05 0
35
0
10
20
30
40
50
60
70
80
90
100
110
120
130
140
150
Nucleotide
30
0.15 SHAPE-Seq (v1.0) Theta
0.10
25
0.10
Theta
20
15
0.05
10
0.010
0 0
0
5
66
68
70
72
74
76
78
80
82
0.005
0.05
0.005 0.010
0
84
0
Nucleotide
0.02
0.04 0.06 0.08 SHAPE-Seq (v2.0) Theta
0.10
0 0 55
5
i
10
15
20
25
30
35
40
Theta
55
SHAPE-Seq (v2.0) SHAPE-Seq (v1.0) R = 0.95
0.10
40
50
HepC IRES
50
45
45
0.05 0
35
0
50
100
150
200
250
300
350
Nucleotide
30
SHAPE-Seq (v1.0) Theta
0.04 25
0.03
Theta
20
15
0.02 0.01
10
0
5
180
185
190
195
200
205
0.06
0.04
0.02
0.02 0 0
0.01
0.02
0 0
Nucleotide
0.01
0.02
0.03
0.04
0.05
0.06
SHAPE-Seq (v2.0) Theta
0 0
5
10
15
20
25
30
35
40
45
50
55
Figure S12. SHAPE-Seq v2.0 vs. SHAPE-Seq v1.0. For each RNA, SHAPE-Seq v2.0 (blue) and SHAPE-Seq v1.0 (red) 𝜃’s are plotted on top, with a zoomed window on portions of the comparison shown on the bottom left. Error bars are calculated as standard deviations of reactivities at each nucleotide from three independent replicate experiments. The bottom right shows SHAPE-Seq v2.0 vs. v1.0 𝜃’s plotted as a scatter plot, from which the Pearson’s
21
correlation (R) between the two techniques is calculated. Gray boxes represent flanking structure cassette regions included in the RNAs for SHAPE-Seq v1.0, but not present in the RNAs for SHAPE-Seq v2.0 (see Table S1). MW
tRNA
phe
IDT 1
IDT 2
IDT 3
500 nt 400 nt 300 nt 200 nt
100 nt
Figure S13. Choice of 5’ adenylated linker sequence for SHAPE-Seq v2.0 universal priming strategy. Each linker choice was ligated onto an unmodified strand of tRNAphe using T4 RNA Ligase 2, truncated KQ overnight at room temperature. The gray arrow indicates the bands that correspond to the full-length, unligated tRNA, the blue arrow above shows the bands corresponding to the successfully ligated tRNA+linker, and the bands at the very bottom of the figure correspond to unligated linker. IDT1, IDT2 and IDT3 sequences are commercially available from Integrated DNA Technologies, Inc. at: http://www.idtdna.com/pages/products/mirna/mirna-cloning-products. IDT2 was chosen due to it having the highest melting temperature with its RT primer (Figure S4).
22
(+) Fragment Distribution
R values values:
(–) Fragment Distribution
vs. 5S 9x rRNAvs. 12x Tetrahymena vs. 20x Ribozyme vs. 9x
(+) Fragments (–) Fragments
0.99 0.99
0.99 1.0
phe
vs. tRNA 12x
vs.All 20x
1.0 1.0
0.99 1.0
Figure S14. SHAPE-Seq v2.0 reactivities generated from the MiSeq and HiSeq platforms. (+) and (-) fragment distributions for each RNA were compared between sequencing platforms as in Figure 2. Pearson correlation values for individual comparisons between fragment distributions, are shown on the bottom.
Table S4. RNA structure prediction accuracy using the RNAStructure (6) fold algorithm with no SHAPE-Seq constraints. RNA
Sensitivity
PPV
5S rRNA
10/35=28.6%
10/40=25.0%
Adenine Riboswitch
21/21=100%
21/21=100%
Cyclic di-GMP riboswitch
21/28=75.0%
21/27=77.8%
P4-P6, Tetrahymena group I intron ribozyme
46/48=95.8%
47/55=85.5%
RNAse P
23/42=54.8%
23/46=50.0%
20/21= 95.2%
20/20=100%
Hepatitis C IRES
41/104=39.4%
41/108=38.0%
SAM I riboswitch
29/39=74.4%
29/36=80.6%
TPP riboswitch
17/22=77.3%
17/20=85.0%
Total
228/360=63.3%
229/373=61.4%
tRNA
phe
23
Table S5. RNA structure prediction accuracy using SHAPE-Seq v2.0 reactivity data (ρ’s) as constraints in the RNAStructure (6) fold algorithm with m = 1.8 and b = -0.6. RNA
Sensitivity
PPV
5S rRNA
34/35=97.1%
34/37=91.9%
Adenine Riboswitch
21/21=100%
21/21=100%
Cyclic di-GMP riboswitch
19/28=67.9%
19/24=79.2%
P4-P6, Tetrahymena group I intron ribozyme
45/48=93.8%
46/51=90.2%
RNAse P
22/42=52.4%
22/44=50.0%
21/21= 100%
21/21=100%
Hepatitis C IRES
81/104=77.9%
81/96=84.4%
SAM I riboswitch
32/39=82.1%
32/37=86.5%
TPP riboswitch
17/22=77.3%
17/20=85.0%
Total
292/360=81.1%
293/351=83.5%
tRNA
phe
Table S6. RNA structure prediction accuracy using SHAPE-Seq v2.0 reactivity data (ρ’s) as constraints in the RNAStructure (6) fold algorithm with m = 1.1 and b = -0.3. RNA
Sensitivity
PPV
5S rRNA
34/35=97.1%
34/37=91.9%
Adenine Riboswitch
21/21=100%
21/21=100%
Cyclic di-GMP riboswitch
21/28=75.0%
21/28=75.0%
P4-P6, Tetrahymena group I intron ribozyme
44/48=91.7%
45/49=91.8%
RNAse P
33/42=78.6%
33/40=82.5%
tRNAphe
20/21= 95.2%
20/20=100%
Hepatitis C IRES
81/104=77.9%
81/90=90.0%
SAM I riboswitch
32/39=82.1%
32/37=86.5%
TPP riboswitch
17/22=77.3%
17/20=85.0%
Total
303/360=84.2%
304/342=88.9%
24
Table S7. Data deposition table. SHAPE-Seq reactivity spectra generated in this work are freely available from the RNA Mapping Database (RMDB) (7) (http://rmdb.stanford.edu/repository/), accessible using the RMDB ID numbers indicated below. Name 5S rRNA, E. coli
Library Type SHAPE-Seq v1.0
RMDB ID 5SSC_1M7_0001
5S rRNA, E. coli 5S rRNA, E. coli 5S rRNA, E. coli
SHAPE-Seq v1.0 Minimal SHAPE-Seq v1.0 Inverted SHAPE-Seq v1.0 Indexed Replicates 1-3
5SSC_1M7_0002 5SSC_1M7_0003 5SSC_1M7_0004 5SSC_1M7_0005, 5SSC_1M7_0006
5S rRNA, E. coli
SHAPE-Seq v2.0 Indexed Replicates 1-3
Adenine riboswitch, V. vulnificus
SHAPE-Seq v1.0
5SRRNA_1M7_0001, 5SRRNA_1M7_0002, 5SRRNA_1M7_0003 ADDSC_1M7_0001
Adenine riboswitch, V. vulnificus Adenine riboswitch, V. vulnificus Adenine riboswitch, V. vulnificus
SHAPE-Seq v1.0 Minimal SHAPE-Seq v1.0 Inverted SHAPE-Seq v1.0 Indexed Replicates 1-3
Adenine riboswitch, V. vulnificus
SHAPE-Seq v2.0 Indexed Replicates 1-3
Cyclic di-GMP riboswitch, V. cholerae
SHAPE-Seq v1.0 Indexed Replicates 1-3
Cyclic di-GMP riboswitch, V. cholerae
SHAPE-Seq v2.0 Indexed Replicates 1-3
P4-P6, Tetrahymena group I intron ribozyme P4-P6, Tetrahymena group I intron ribozyme P4-P6, Tetrahymena group I intron ribozyme P4-P6, Tetrahymena group I intron ribozyme
SHAPE-Seq v1.0
ADDSC_1M7_0002 ADDSC_1M7_0003 ADDSC_1M7_0004 ADDSC_1M7_0005, ADDSC_1M7_0006 ADDRSW_1M7_0001, ADDRSW_1M7_0002, ADDRSW_1M7_0003 GMPSC_1M7_0001 GMPSC_1M7_0002, GMPSC_1M7_0003 CIDGMP_1M7_0001, CIDGMP_1M7_0002, CIDGMP_1M7_0003 TRIBSC_1M7_0001
SHAPE-Seq v1.0 Minimal
TRIBSC_1M7_0002
Figure 2, SI Figure 5, Figure 2
SHAPE-Seq v1.0 Inverted
TRIBSC_1M7_0003
Figure 2
SHAPE-Seq v1.0 Indexed Replicates 1-3
Figure 5, SI Figure 12
P4-P6, Tetrahymena group I intron ribozyme
SHAPE-Seq v2.0 Indexed Replicates 1-3
RNAse P, specificity domain, B. subtilis
SHAPE-Seq v1.0
TRIBSC_1M7_0004 TRIBSC_1M7_0005, TRIBSC_1M7_0006 TRP4P6_1M7_0001, TRP4P6_1M7_0002, TRP4P6_1M7_0003 RNPSC_1M7_0001
RNAse P, specificity domain, B. subtilis RNAse P, specificity domain, B. subtilis RNAse P, specificity domain, B. subtilis
SHAPE-Seq v1.0 Minimal
RNPSC_1M7_0002
SHAPE-Seq v1.0 Inverted
RNPSC_1M7_0003
SHAPE-Seq v1.0 Indexed Replicates 1-3
RNPSC_1M7_0004 RNPSC_1M7_0005, RNPSC_1M7_0006
Figure Figure 2, SI Figure 5, Figure 2 Figure 2 Figure 3, Figure 5, SI Figure 11, SI Figure 12 Figure 5, SI Figure 12, SI Figure 14 Figure 2, SI Figure 5, Figure 2 Figure 2 Figure 5, SI Figure 12 Figure 5, SI Figure 12 Figure 5, SI Figure 12 Figure 5, SI Figure 12
Figure 5, SI Figure 12, SI Figure 14 Figure 2, SI Figure 5, SI Figure 6 Figure 2, SI Figure 6 Figure 2, SI Figure 6 Figure 5, SI Figure 12
25
RNAse P, specificity domain, B. subtilis
SHAPE-Seq v2.0 Indexed Replicates 1-3
tRNA
phe
, E. coli
SHAPE-Seq v1.0
RNASEP_1M7_0001, RNASEP_1M7_0002, RNASEP_1M7_0003 TRNASC_1M7_0001
tRNA
phe
, E. coli
SHAPE-Seq v1.0 Minimal
TRNASC_1M7_0002
tRNA
phe
, E. coli
SHAPE-Seq v1.0 Inverted
TRNASC_1M7_0003
tRNA
phe
, E. coli
SHAPE-Seq v1.0 Indexed Replicates 1-3
tRNA
phe
, E. coli
SHAPE-Seq v2.0 Indexed Replicates 1-3
TRNASC_1M7_0004 TRNASC_1M7_0005, TRNASC_1M7_0006 TRNAPH_1M7_0001, TRNAPH_1M7_0002, TRNAPH_1M7_0003
Hepatitis C virus IRES domain
SHAPE-Seq v1.0 Indexed Replicates 1-3
Hepatitis C virus IRES domain
SHAPE-Seq v2.0 Indexed Replicates 1-3
SAM I riboswitch, T. tencongensis
SHAPE-Seq v1.0 Indexed Replicates 1-3
SAM I riboswitch, T. tencongensis
SHAPE-Seq v2.0 Indexed Replicates 1-3
TPP riboswitch, E. coli
SHAPE-Seq v1.0 Indexed Replicates 1-3
TPP riboswitch, E. coli
SHAPE-Seq v2.0 Indexed Replicates 1-3
HEPCSC_1M7_0001 HEPCSC_1M7_0002, HEPCSC_1M7_0003 HCIRES_1M7_0001, HCIRES_1M7_0002, HCIRES_1M7_0003 SAMSC_1M7_0001 SAMSC_1M7_0002, SAMSC_1M7_0003 SAMRSW_1M7_0001, SAMRSW_1M7_0002, SAMRSW_1M7_0003 TPPSC_1M7_0001, TPPSC_1M7_0002, TPPSC_1M7_0003 TPPRSW_1M7_0001, TPPRSW_1M7_0002, TPPRSW_1M7_0003
Figure 5, SI Figure 12 Figure 2, SI Figure 5 SI Figure 6 Figure 2, SI Figure 6 Figure 2, SI Figure 6 Figure 5, SI Figure 12 Figure 3, Figure 5, SI Figure 11 SI Figure 12, SI Figure 14 Figure 5, SI Figure 12 Figure 5, SI Figure 12 Figure 5, SI Figure 12 Figure 5, SI Figure 12 Figure 5, SI Figure 12 Figure 5, SI Figure 12
References 1. Merino, E.J., Wilkinson, K.A., Coughlan, J.L. and Weeks, K.M. (2005) RNA structure analysis at single nucleotide resolution by selective 2'-hydroxyl acylation and primer extension (SHAPE). J. Am. Chem. Soc., 127, 4223–4231. 2. Lucks, J.B., Mortimer, S.A., Trapnell, C., Luo, S., Aviran, S., Schroth, G.P., Pachter, L., Doudna, J.A. and Arkin, A.P. (2011) Multiplexed RNA structure characterization with selective 2'-hydroxyl acylation analyzed by primer extension sequencing (SHAPE-Seq). Proceedings of the National Academy of Sciences, 108, 11063–11068. 3. Mortimer, S.A., Trapnell, C., Aviran, S., Pachter, L. and Lucks, J.B. (2012) SHAPE-Seq: HighThroughput RNA Structure Analysis. Curr Protoc Chem Biol, 4, 275–297. 4. Kladwang, W., VanLang, C.C., Cordero, P. and Das, R. (2011) Understanding the errors of SHAPE-directed RNA structure modeling. Biochemistry, 50, 8049–8056.
26
5. Hajdin, C.E., Bellaousov, S., Huggins, W., Leonard, C.W., Mathews, D.H. and Weeks, K.M. (2013) Accurate SHAPE-directed RNA secondary structure modeling, including pseudoknots. Proc. Natl. Acad. Sci. U.S.A., 110, 5498–5503. 6. Reuter, J.S. and Mathews, D.H. (2010) RNAstructure: software for RNA secondary structure prediction and analysis. BMC Bioinformatics, 11, 129. 7. Cordero, P., Lucks, J.B. and Das, R. (2012) An RNA Mapping DataBase for curating RNA structure mapping experiments. Bioinformatics, 28, 3006–3008.
27