Revista elektron, Vol. 2, No. 2, pp. 63-66 (2018)
Simple method to determine the resolution and sensitivity of systems for optoacoustic tomography M´etodo sencillo para determinar la resoluci´on y sensibilidad de sistemas para tomograf´ıa optoac´ustica M. G. Gonz´alez∗†1 , E. Acosta∗ , G. Santiago∗ ∗ Universidad
de Buenos Aires, Facultad de Ingenier´ıa, ´ Grupo de L´aser, Optica de Materiales y Aplicaciones Electromagn´eticas (GLOMAE) Paseo Col´on 850, C1063ACV, Buenos Aires, Argentina † Consejo Nacional de Investigaciones Cient´ıficas y T´ecnicas, (CONICET) Godoy Cruz 2290, C1425FQB, Buenos Aires, Argentina 1
[email protected]
Recibido: 09/08/18; Aceptado: 17/09/18
Abstract—In this paper we present a method to determine the spatial resolution and sensitivity of systems for optoacoustic tomography (OAT). The method consists of obtaining the image of a sample based on a transparent film embedded in agarose. The film has a certain pattern made with a laser printer that allows to obtain the system spatial resolution. Moreover, since the damage threshold of the ink pattern is similar to that of living tissue, it is also possible to determine if the system is sensitive enough to be applied on biological samples. The method is straightforward, fast and repeatable, and was tested in a OAT system for obtaining two-dimensional images developed in our laboratory. Keywords: sensitivity.
optoacoustic
tomography;
spatial
resolution;
Resumen— En este trabajo se presenta un m´etodo para determinar la resoluci´on espacial y la sensibilidad de ´ ´ sistemas para tomograf´ıa optoacustica (TOA). Este consiste en la obtenci´on de la imagen de una muestra basada en una l´amina transparente embebida en agarosa. La l´amina posee un determinado patr´on realizado con una impresora l´aser que permite determinar la resoluci´on espacial del sistema. ˜ es similar a del tejido Por otro lado, como su umbral de dano vivo, tambi´en es posible establecer si el sistema posee la suficiente sensibilidad para ser usado en muestras biol´ogicas. El m´etodo es directo, r´apido y repetible, y fue probado en un sistema TOA para obtenci´on de im´agenes bidimensionales desarrollado en nuestro laboratorio. ´ Palabras clave: tomograf´ıa optoacustica; resoluci´on espacial; sensibilidad.
I. I NTRODUCTION The optoacoustic (OA) phenomenon is the generation of acoustic waves due to thermoelastic expansion caused by absorption of short optical pulses, combining optical absorption contrast with high resolution of ultrasound. When the OA technique is used to perform tomography (OAT), the pressure profiles generated by the optical excitation are captured with ultrasonic sensors that surround the area of interest. This methods provides high resolution maps of optical absorption [1]. The OAT main goal is to obtain images from OA signals. This demands solving two inverse problems: one acoustic and the other optical [2]. In both cases, the ultrasonic signals
ISSN 2525-0159
are measured. In the acoustic inverse problem, the energy deposited in the sample is mapped, while the objective of the optical inverse problem is to obtain the image of the absorption coefficient. The OA effect applied to obtain images of living objects is the goal that presents the greatest challenges in order to solve both inverse problems. Optically, large variations in the dispersion and absorption coefficients of living tissues lead to very complex, non-linear inverse problems. On the other hand, acoustically, the geometry of the detection system, as well as the heterogeneity and losses usually present in the sample, lead to distortions and artifacts in the obtained images [2]. There are a several techniques for obtaining images in OAT systems. The approach that has had the best experimental results is the backprojection technique, a time domain algorithm very simple to implement. Algorithms in the time domain are based on projecting each one of the one-dimensional OA time signals into the threedimensional space in a way that is consistent with the flight time principle [2]. The width of OA signals in the time domain scales with the size of the OA source. The limiting factor for the achievable resolution is the highest detectable frequency. However, it also depends on other factors such as duration of the laser pulse, detection geometry, size, shape and number of the sensor elements and image formation technique [3]. To characterize the spatial resolution in a OAT system, it is possible to distinguish between the axial and the lateral resolution. The former is defined along the acoustic axis of each sensor intersecting the center of rotation of the detection surface (or arc in bidimensional schemes). It depends mainly on the bandwidth of the detection system. On the other hand, the lateral resolution is defined perpendicularly to the acoustic axis of the sensor. It is spatialy variant and depends both on the bandwidth and the aperture of the transducer element. The more the source approaches the center of rotation of the sensor array, the more the lateral resolution improves until it is only bandwidth limited [4]. The resolution of an imaging system can be assessed by the point spread function (PSF) which describes how the system represents an elementary volume. To determine the PSF experimentally, black polyethylene microspheres
63
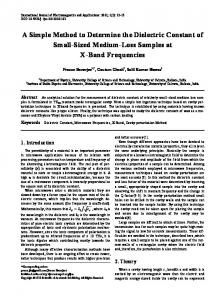
Revista elektron, Vol. 2, No. 2, pp. 63-66 (2018) oscilloscope beamsplitter
Nd:YAG Laser
pyroelectric
oscilloscope
with a second harmonic generator
lens
z x
y
sensor
amplifier sample
sensor
Computer
lens
cuvette XYZ stage
water
sample step motor
step motor
Fig. 1.
beamsplitter
amplifier
thermocouple
Scheme (left) and picture (right) of the experimental setup used in this work.
500 500
300
500
II. M ATERIALS AND METHODS 400
200 100
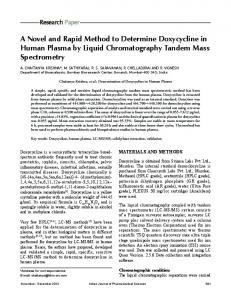
Fig. 2. Disc pattern used to determined the system spatial resolution. Each disc has a diameter of 100 µm. Distances are expressed in micrometers.
(or any very small object with known shape and size) are usually used to generate the OA signals [4]–[6]. The black coloration ensures high absorption and thus a strong OA signal. In order to avoid acoustic reflections, due to impedance mismatch, the phantom is made of a gel (e.g. agarose) with similar acoustic properties to water and with scattering properties that provide an homogeneous illumination. The dimension of the PSF is estimated comparing the full width at half maximum (FWHM) obtained from the reconstructed image with the known size of the object. The sensitivity of a OAT system is determined measuring the OA signal generated by a phantom with similar characteristics to those of living tissue and comparing its value with the signal to noise ratio (SNR) of the device. In this case, the SNR depends on various parameters: magnitude of the OA signal arriving at the detector, the ultrasonic sensor sensitivity, the detection aperture, the number of tomographic projections used in the reconstruction, the number of signal averages and, obviously, the noise floor of the system [7]. In this work we propose another method to determine the resolution and sensitivity performing only one measurement. It consists of obtaining the image of a sample based on a transparent film embedded in agarose. The film has a certain pattern made with a laser printer that allows to obtain the system spatial resolution. Since the damage threshold of the ink pattern is similar to that of living tissue, it is also possible to determine if the system is sensitive enough to be applied on biological samples. This last feature makes the method simpler than others since with a single measurement the values of two parameters are obtained. The method was tested in a 2-D OAT system based on an integrating line detector and a backprojection reconstruction algorithm.
ISSN 2525-0159
The experimental setup for the OA imaging system is shown in Fig. 1. The sensor and the sample were both immersed in a large cilindrical cuvette (115 mm of diameter and 90 mm of height) filled with deionized water. The size of the cuvette was chosen to avoid interference with the reflected waves from the walls of the cuvette, within the measurement time frame. The water temperature was measured with a calibrated thermocouple. This makes possible to determine the speed of sound in the water surrounding the sensor. A Nd:YAG laser with a second harmonic generator (Continuum Minilite I, 532 nm) with a pulse duration of 5 ns, and a repetition rate of 10 Hz, was used as the light source. In all the measurements carried out in this work, the laser pulse energy was less than 13 mJ. A diverging lens adapts the diameter of the laser beam to the size of the sample (12 mm of diameter), trying to achieve an homogeneous illumination. An ultrasonic sensor was fixed and pointed to the center of the rotating sample stage using a XYZ translation stage. Phantoms were fixed on the sample stage and rotated (Newport PR50CC) through 360 degrees over a circumference with a diameter of 8 mm. Full view data (360 degrees) minimizes the effect of a limited view detection [8]. The sensor output was amplified with a transimpedance amplifier (EG&G Optoelectronics Judson PA-400), digitized by an oscilloscope (Tektronix TDS 2024, 2 GS/s, 200 MHz) and processed on a personal computer. OA signals were recorded every degree and, at each angle, averaged 64 times. The laser Q-Switch pulse served as the trigger pulse. The value of the angular sampling period does not lead to aliasing artifacts such as streaks [4]. The main laser beam was sampled with a beamsplitter to measure the laser pulse energy with a pyroelectric detector (Coherent LMP10). The ultrasonic sensor used in this work consist of a PVDF film (25 µm of thickness) attached to an acrylic substrate with dimensions 30 mm x 30 mm x 10 mm. The active detection area is approximately 0.7 mm x 24 mm. These values allow to achieve a homogeneous resolution in the scanned region [9]. The frequency response of the system (sensor + amplifier) was measured using the method detailed in [10] obtaining a frequency cut-off of 20 MHz (-3 dB). Further details about the implementation and characterization can be found in references [10] and [11]. The projections of the initial pressure distributions into the xy plane were obtained using the backprojection algorithm described in [12].
64
http://elektron.fi.uba.ar
Revista elektron, Vol. 2, No. 2, pp. 63-66 (2018) 1 0.9
−1.5
y (mm)
0.7 −0.5
0.6 0.5
0
0.4
0.5
0.3
Fig. 3. Transparent film phantom embedded in agarose gel. The pattern (3 x 3 mm) on the film surface was made with a laser printer.
0.1
1.5 −1.5
−1
−0.5
0
0.5
1
0
1.5
x (mm) Fig. 4.
Image obtained with the TOA system. The phantom reads UBA.
1
1500
0.9 1000
0.8 0.7
500
y (μ m)
0.6 0.5
0
0.4 −500
0.3 0.2
−1000
0.1 −1500
−1000
−500
0
500
1000
0
1500
x (μm) Fig. 5. Imaging obtained with the OAT system used the phantom with the black discs pattern showed in Fig. 2.
0.9
First, we studied the general performance of the system. In this way, we made a measurement using the sample (phantom UBA) shown in Fig. 3. The phantom was made with the same procedure explained in the section II. The image obtained is shown in Fig. 4. In the imaging plane of the system (6 x 6 mm) any effect related to limited view detection, finite detector size or insufficient spatial sampling could be observed. However, there is a lack of homogeneity in the map of absorption in the letters U BA. This is not due to an error of the system, but to the imperfect adherence of the toner to the transparent film. This fact was visually checked using a microscope. The next step was to obtain the image of the phantom with the pattern detailed in Fig. 2. The results are shown in Fig. 5 where the contour (black solid line) of the discs were superimposed on the reconstructed image. From the figure, with the naked eye and taking into account the separation
0.8
Normalized amplitude
III. E XPERIMENTAL RESULTS
ISSN 2525-0159
0.2
Normalized amplitude
The method presented in this paper is based on the measurement of a phantom. This consists of transparent film embedded in agarose gel. On the film was drawn the pattern shown in the Fig. 2 with a laser printer. The pattern is a set of pairs of black disks (100 µm of diameter) at different distances. The agarose gel was prepared with 2.5% (w/v) agarose in distilled water. First, a cylindrical base of the agarose gel with a diameter of 15 mm and a height of approximately 25 mm was prepared. Then, the object (transparent film) was placed in the middle of the cylinder and fixed with a few drops of the gel. Finally, another layer of gel with a thickness of 1 mm was formed on top of the sample object. The production of the phantoms is straightforward,fast and they are stable for 15 days if stored at 4◦ C. The acoustical properties of the solidified agarose gel are comparable to those of water [13]. Scattering properties similar to tissue can be achieved by adding intralipid to the agarose solution before it solidifies [7]. It is important to remark that the damage threshold of the ink pattern is very close to the maximal permissible skin exposure value established by the American National Standards Institute [14] which, for a nanosecond laser in the visible range (400 - 700 nm) with a repetition rate up to 10 Hz, is 20 mJ/cm2 . Therefore, using this characteristic in combination with the noise equivalent pressure value of the detection system, it is possible to determine if the OAT system is sensitive enough to be applied on biological samples.
1
Normalized amplitude
0.8
−1
0.7 0.6 0.5 0.4 0.3 0.2 0.1 0 −500
−400
−300
−200
−100
0
100
200
300
x (μm)
Fig. 6. The line profile of the reconstructed image (Fig. 5 at different y values: -0.50 mm (dashed line), 0.06 mm (solid line), 0.65 mm (dash-dotted line) and 1.2 mm (dotted line).
65
http://elektron.fi.uba.ar
Revista elektron, Vol. 2, No. 2, pp. 63-66 (2018) between the discs, the resolution of the system is 200 µm. In order to obtain a more precise value, in Fig. 6 the line profile of the image of Fig. 5 for different values of y are presented. The width of all the discs in the profiles (FWHM) is approximately equal in all directions and its value is 190 ± 10 µm. Considering the finite size of the discs, this can be regarded as an upper limit of the resolution. It is interesting to compare the previous value with the theoretical maximal achievable resolution, Rbw , using the values of the sound speed (vs = 1480 m/s) and the cut-off frequency of the detection system (fco = 20 MHz), Rbw ≈ 0.8vs /fco = 60 µm [15]. The large difference is mainly due to that this expression assumes an idealized scenario, i.e. full view detection, point detector, continuous spatial sampling and constant sound speed. In order to obtain the image of Fig. 5, a minimum fluence of 10 mJ/cm2 was necessary. With this laser radiation value, the minimum detected OA signal had a mean value of 60 Pa. Taking into account that the measured noise equivalent pressure (NEP) of the detection system is 20 Pa [11], the minimum signal to noise ratio (SNR) was greater than 3 dB. Therefore, this OAT system is sensitive enough to be used in biological applications such as in-vivo tissue measurements. IV. C ONCLUSIONS In this paper we presented a method to determine the spatial resolution and sensitivity of systems for OAT in a single measurement. It is based on obtaining the OA image of a transparent film with a printed pattern and embedded in agarose. The method is straightforward, fast and repeatable, and allows to determine if the system is sensitive enough to be used on biological applications. In order to test the method, we measured the resolution and sensitivity of a homemade 2-D OAT system based on an integrating line detector and a backprojection reconstruction algorithm. The method determined that the spatial resolution is 190 µm. Moreover, using laser pulse energies lower than the sample damage threshold, an adequate SNR value has been achieved, which allows obtaining high quality images. In future work, we will carry out measurements using phantoms with optical scattering properties similar to living tissue adding intralipid to the agarose solution. Moreover, we will probe ink patterns with different optical absorption properties in order to study the dynamic range of the detection system.
[5] J. Bauer-Marschallinger, K. Felbermayer, and T. Berer, “All-optical photoacoustic projection imaging,” J. Biomed. Opt. Express, vol. 8, no. 9, pp. 3938–3951, 2017. [6] G. Paltauf, P. Hartmair, G. Kovachev, and R. Nuster, “Piezoelectric line detector array for photoacoustic tomography,” Photoacoustics, vol. 8, pp. 28–36, 2017. [7] R. Ma, A. Taruttis, V. Ntziachristos, and D. Razansky, “Multispectral optoacoustic tomography (msot) scanner for whole-body small animal imaging,” Opt. Express, vol. 17, pp. 21 414–21 426, 2009. [8] Y. Xu, L. Wang, G. Ambartsoumian, and P. Kuchment, “Reconstructions in limited-view thermoacoustic tomography,” Med. Phys., vol. 31, no. 4, pp. 724–733, 2004. [9] G. Paltauf, R. Nuster, and P. Burgholzer, “Characterization of integrating ultrasound detectors for photoacoustic tomography,” Journal of Applied Physics, vol. 105, 2009. [10] A. Abadi, L. C. Brazzano, P. Sorichetti, and M. G. Gonzalez, “Sensor piezoel´ectrico con geometr´ıa lineal para tomograf´ıa optoac´ustica: Implementaci´on y caracterizaci´on el´ectrica,” Revista Elektron, vol. 1, no. 2, pp. 53–57, 2017. [11] M. G. Gonz´alez B. Abadi, L. C. Brazzano, and P. Sorichetti, “Linear piezoelectric sensor for optoacoustic tomography: electroacoustic characterization,” in 2018 IEEE Biennial Congress of Argentina (ARGENCON), 2018. [12] P. M. Rocca, L. C. Brazzano, E. Acosta, and M. G. Gonzalez, “Reconstruccion de imagenes optoacusticas: Efecto de los sensores piezoelectricos de banda ancha,” Revista Elektron, vol. 1, no. 2, pp. 58–65, 2017. [13] K. Zell, J. Sperl, M. Vogel, R. Niessner, and C. Haisch, “Acoustical properties of selected tissue phantom materials for ultrasound imaging,” Phys. Med. Bio., vol. 52, no. 20, p. N475, 2007. [14] American National Standard for the Safe Use of Lasers in Health Care Facilities: Standard Z136.1-2000, ANSI, Inc., New York, 2000. [15] Y. Xu and L. Wang, “Analytic explanation of spatial resolution related to bandwidth and detector aperture size in thermoacoustic or photoacoustic reconstruction,” Phys. Rev. E, vol. 67, no. 5, p. 056605, 2003.
ACKNOWLEDGMENT This work was supported by the Universidad de Buenos Aires (UBACyT Grants 20020160100052BA and 20020170200232BA) and by the Agencia Nacional de Promoci´on Cient´ıfica y Tecnol´ogica (PICT Grant 2016-2204). R EFERENCES [1] L. Wang, Photoacoustic imaging and spectroscopy. Boca Rat´on, Florida, USA: CRC Press, 2009. [2] A. Rosenthal, V. Ntziachristos, and D. Razansky, “Acoustic inversion in optoacoustic tomography: A review,” Current Medical Imaging Reviews, vol. 9, pp. 318–336, 2013. [3] M. Xu and L. Wang, “Photoacoustic imaging in biomedicine,” Rev. Sci. Instrum., vol. 77, p. 041101, 2006. [4] A. Buehler, “Multi-spectral optoacoustic tomography: Methods and applications,” Ph.D. dissertation, Technische Universitaet Muenchen, Munich, Germany, 2014.
ISSN 2525-0159
66
http://elektron.fi.uba.ar