PNNL-SA-41618
1
Simulating Price Responsive Distributed Resources N. Lu Member IEEE, D. P. Chassin, Member IEEE, and S. E. Widergren, Sr. Member, IEEE
Abstract — Distributed energy resources (DER) include distributed generation, storage, and responsive demand. The integration of DER into the power system control framework is part of the evolutionary advances that allow these resources to actively participate in the energy balance equation. Price can provide a powerful signal for independent decision-making in distributed control strategies. To study the impact of price responsive DER on the electric power system requires generation and load models that can capture the dynamic coupling between the energy market and the physical operation of the power system in appropriate time frames. This paper presents modeling approaches for simulating electricity market price responsive DER, and introduces a statistical mechanics approach to modeling the aggregated response of a transformed electric system of pervasive, transacting DER. Index Terms—demand response, load model, load synthesis, thermostatically controlled appliance, system simulation, distributed energy resources.
I. INTRODUCTION
A
s market-based approaches have dominated changes in the operation of the bulk power system, initiatives have also begun to involve distributed energy resources (DER) in this process. Controllable load, distributed generation, and storage at the finger tips of the system hold promise to enhance cost effective operation and reliability. These resources represent half of the energy balance equation that traditionally exhibits uncontrolled, but generally predictable behavior. Though individually small contributors, by using appropriate signals or incentives the control of vast numbers of DER can have significant operational impact. Demand management programs have been implemented for some time, but more recently, initiatives that provide price incentives to DER operation have appeared. As these programs become more prevalent, the need to understand their impact on reliable system operation becomes important. The following discussion reviews work done to model price responsive load from the details of individual electric appliances interacting at the distribution feeder level, to price responsive feeder equivalent models appropriate for regional system level studies. Inherent in the price responsive DER modeling is the simulation of market-based systems that allow these resources to interact with bulk energy markets to drive decision-making in economically efficient directions.
This work is supported by the Pacific Northwest National Laboratory operated for the U.S. Department of Energy by Battelle under Contract DEAC06-76RL01830. N. Lu, D. P. Chassin, and S. E. Widergren are with the Energy Science and Technology Division, Pacific Northwest National Laboratory, P.O. Box 999, MSIN: K5-20, Richland, WA - 99352, USA (e-mail:
[email protected],
[email protected],
[email protected] )
Given a large penetration of price responsive DER with its associated market transactions, a new approach is also proposed, based upon more holistic statistical mechanic techniques. Such an approach holds promise in revealing the fundamentals of complex system behavior by elevating analysis from the overwhelming details to higher levels of abstract behavior. II. DEMAND RESPONSE MODEL FOR RESIDENTIAL LOADS As one example of price responsive DER, we investigated the models for appliances calibrated against a database of extensively monitored residential distribution feeders. The simulation of the dynamic response of residential loads for use in demand response programs requires models that can interact with price, voltage, and frequency input signals. The diversity of the appliances over time must be taken into account in the load models. Factors of diversity can be divided into two types: spatial and temporal. Spatial diversity is caused by differences in household characteristics, such as the size and type of the appliances. Temporal diversity is the result of the random behavioral variations among different households. Such variations may include occupancy schedule, likelihood and frequencies of opening doors and windows, thermostat settings, and other lifestyle-related factors [1]. Physically based load modeling methodologies have been widely used because they are able to predict the individual load dynamic response and allow one to obtain the aggregated response of these loads with reasonable accuracy [2].
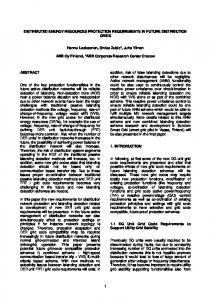
Fig. 1: A bottom-up approach
The load model we used for price responsive residential load simulation takes a bottom-up approach in which detailed physically-based models of each type of appliance are developed, as shown in Fig.1. An aggregated load model using a state queuing model (SQ) approach [4] was developed based on modeling group appliance behaviors to improve the computation speed. The SQ model serves as a simplified reduced order feeder equivalent model to the detailed household-based load model, as shown in Fig. 2.
© 2004 IEEE. Reprinted from Proceedings of 2004 PES PSCE Meeting
2
PNNL-SA-41618
Fig. 2: A feeder-level aggregated load modeling approach
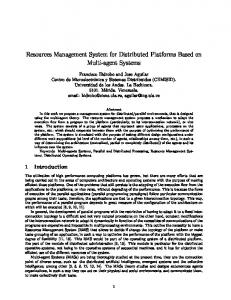
Residential appliances are categorized into those that are thermostatically controlled and those that are nonthermostatically controlled. There are three types of thermostatically controlled appliances (TCAs) allowed in the model: HVAC systems, electric water heaters, and refrigerators. Non-thermostatically controlled appliances include dishwashers, washers/dryers, and the like. A. Detailed Residential Load Models A simulation environment based on detailed residential demand models has been developed [3]. The thermal model used to simulate TCAs takes an equivalent thermal parameter (ETP) approach [4], [6]. Fig. 3 shows an ETP representation of an HVAC system. The heat transfer properties are represented by equivalent circuits with associated parameters for this type of thermally controlled appliance. The other types of TCAs are modeled with similar heat transfer models. Price of Power
Price of Power
Change in Therm ostat Setpoint
Thermostat Setpoint
Residential HVAC
Thermostat Setpoint
Q internal gains
Q solar
Q hvac 1/UA insul T air
T Am bient
C air 1/UA m ass T m ass
Heat Transfer Model Analog
C m ass
Solut ion to differential equat ions allows load to be calculated
Fig. 3: Model of residential HVAC systems [3]
To model the spatial diversities, the constants within each model for each house are randomly distributed within expected ranges. Temporal diversities, such as consumer consumptions, weather, system voltage and frequency, economic conditions, time of day, day type, and seasonal parameters, are considered as exogenous inputs to the model. The user can vary these inputs when initializing the
simulation. The price response of TCAs can be simulated by adjusting thermostat settings based on a price signal. The price-setpoint control curve is shown at the top of Fig. 3. Non-TCA loads are purely driven by human behavior. For this we use a technique of load deferral that is based on probability distributions. Given a period of increased prices, this approach computes the amount of load deferred for nonthermal loads. The calculation is analogous to a laundry system. Let the probability of doing a load of laundry follow a probability density function (PDF) curve, as well as the amount of laundry in the laundry basket (which represents the queue). Let the queue increase by a linear function (in the absence of better information), and let it drop each time when a load of laundry is done. A form of the Monte-Carlo method is used to determine if and when laundry will be done. A new curve is created called the ‘Likelihood’ curve. This function is the combination of the original PDF curve and the variable queue. The resulting PDF shape and amplitude represent the likelihood of doing a load of laundry on any particular day. Refer to [3] for details. B. Aggregated Feeder-level Load Model To analyze bulk system operating issues, reduced ordered, price sensitive, equivalents of distribution feeders are needed. These equivalents can bring insights into the influence of electrical and economic signal interactions between the transmission level and the distribution level of the system. The equivalents bring computational performance advantages over detailed appliance simulation to make regional simulation possible. Probabilistic calculations of aggregate storage loads [7] and duty cycle approach [8] have been developed for aggregate cycling load models. These models are based on the end-use data analysis. Historical data collected at the substation level are used to account for non-engineering factors such as weather patterns and customer behaviors. The drawback of these models is that they are empirically driven and noninteractive. The thermodynamic and cyclic character of the loads and their controls is also not considered. To address these shortcomings, we use SQ models to simulate each type of appliance at the feeder level. An SQ model describes TCA behavior by tracking the state of types of TCA devices over time. Consider a system containing N water heater units with the initial thermal states shown in Fig. 4(a). T+ and T– are the upper and lower temperature limit for a given setpoint T. A state is then defined by both the temperature and the on/off status of a unit. We subdivide the time cycle into N states of equal duration such that there are Non distinct “on” states (shown by shaded boxes in Fig. 4(a)) and N−Non distinct “off” states in a temperature range of [T–, T+]. Initially, we assume a uniformly diversified load and the units are distributed uniformly among all N states. At the end of each time step, units will move one state ahead, as shown in Fig. 4(b).
© 2004 IEEE. Reprinted from Proceedings of 2004 PES PSCE Meeting
PNNL-SA-41618
3 power system in quasi-equilibrium is adequate. In these scenarios, daily, hourly, and perhaps short period ancillary service markets set generation schedules that then impact the flow of energy in the system. Power system simulation tools currently exist that provide reasonable representations of system behavior for these slow dynamics. Called dispatcher or operator training simulators (DTS/OTS), these tools are built around a power flow solution engine that assures Kirchhoff’s current and voltage laws are satisfied at each step in time (on the order of 2 to 20 seconds, depending upon the nature of the study) [13]. In between these time steps, the dynamic aspects of power system equipment, particularly generators and their controls, but also transformer taps, capacitor banks, and the gross operation of protection relays are modeled.
(a)
(b)
Oper ation Schedules
operating schedules
operating schedules
(energy, switching, etc.)
AGC & Economic Dispatch
(c) Fig. 4: (a) The SQ model of aggregated water heater load. (b) A stand-by SQ model. (c) A SQ model considering uncertainties. [9]
Let vector Xk = (x1, x2, .., xN) represent the number of units in each state at the kth time interval and P represent the transition matrix [10] containing the transition probabilities pi,j, which represents the probability of a unit moving from State i to State j. We can then calculate the state evolution from the k-1 to the kth time interval using X k = X k −1 P
(1)
One can calculate the aggregated output by summing up the power consumption of all the units in the “on” states at each time step. The aggregated power output PL is then calculated by N on
PL = Pave ∑ xm
(2)
m =1
where Pave is the average power output of a unit, xm is the number of units in an “on” State m, and Non is the number of the “on” states. An SQ model considering the spatial and the temporal load diversities is shown in Fig. 4(c). For units in State i, we have N (3) p =1
∑ j =1
i, j
where pi,j follows certain PDF determined by the aggregated load diversities at the feeder end. For non-TCA loads, only two states are required: “on” or “off”. Poff and Pon are a function of the control objectives. III. REGIONAL SYSTEM SIMULATION Given a reasonable equivalent for price response demand at the distribution feeder, traditional steady-state load models can be replaced in transmission level analysis tools. To study the interaction of bulk power market dynamics with physical system operations, modeling the slow moving dynamics of the
system generation state
Load Model
system state demand
Power Flow Solver system state
measurements dispatch
Gener ation & Relay Dynamics
generation control
Networ k Analysis
switching control
SCADA measurements
Fig.5: Block diagram of the power system components of a DTS/OTS
Fig. 5 depicts a simplified view of the major components in a DTS/OTS. The generation and load models interact with the power flow engine. They are influenced by the area control algorithms used by a region to balance its supply, demand, and inter-area transfers in real-time. They are also influenced by maintenance schedules and by reliability criteria for secure operation as may be directed through SCADA measurements and the results of on-line network analysis tools. Energy markets interact with the DTS/OTS through the schedules for generation and load influenced by the price signals that the power producers, load serving entities, and consumers receive from wholesale and retail markets (see the Economics & Market Modeling section below). IV. FULLY TRANSACTING DEMAND RESPONSE SYSTEM Fig. 6 shows a block diagram of an electricity market. Multiple parties in the bulk power system engage in competitive markets to fulfill their own economic objectives. Examples include bilateral contracts, day-ahead markets, and hour-ahead markets. In the full transacting bid-based market model, the bulk market operator collects bids from generation companies (GenCos) and load servicing entities (LSEs). LSE bids are based on the expectation of demand Q and price B based on their arbitrage expectation considering the forward markets’ current prices. The market operator in turn calculates the bulk market clearing prices P needed to clear the bulk market, knowing that one or more GenCo bids will be marginal. The LSE however need not clear the local markets;
© 2004 IEEE. Reprinted from Proceedings of 2004 PES PSCE Meeting
PNNL-SA-41618
4
instead it develops the bulk market bid in such a way as to maximize its profit over time and fully meet demand. As a result, no bidder in the LSE market is ever required to operate as a marginal resource. Control Function P ($/MWh)
Q (MW)
LSE Bid B = {Q, P}
LSE LSE
ISO D S
• • •
GenCo GenCo
• • •
LSE
GenCo
Market Clearing Price P ($/MWh)
off-the-shelf, hardened set of software. The Distribution Feeder component includes the SQ feeder equivalent model [1], [9]. The other components are agent-based components. They are integrated together using a J2EE framework [10] that supports the exchange of messages between components. J2EE is an open specification for component-oriented system architecture [11]. It supports a flexible, distributed computing environment. Well defined interfaces allow integrators to “connect” components into the system and replace them with other components as long as the interface contracts remain honored. The adapters in the figure represent conversions that are necessary to “hook-up” a software component into the framework.
Fig. 6: Block diagram of an multi-layer electricity market
An LSE that provides a local market for price responsive DER can interact with the bulk market signals by adjusting the offer for generation based upon the price sensitivity of his DER, as shown in Fig. 6. The local market bid, B, to the bulk market is a function of all n local bids, b, which can be represented as,
B = f (b1 , b2 ,..., bn )
Power System Simulator (DT S)
Adapter
Qi = g i (B)
(5)
where Qi is the demand expected by the ith LSE. In principle, the control objective of an LSE is to maximize profit over a time period T. However, it is typical for today’s LSE to consider load as a given, and thus they seek only to minimize their costs, reducing the optimization problem T (6) min ⎡ ∫ Qi (t )P(t )dt ⎤ ⎢⎣ 0 ⎥⎦ where P is the bulk market clearing price. To determine the load Qi at a specific time t, two cases need to be studied. If the market penetration of the DER is low, an LSE will not have much control over P. The market is then considered to be a competitive power market, where the P(t) is insensitive to the power variation of a single load bidder. In this case, there are no feedback loops between the market price P and the load Qi in the simulation. The dotted line in Fig. 6 is then disconnected. At each time step, the LSE will calculate the bid price B and the load Qi iteratively based on (5) to meet the control objective (6), minimizing the load payment at t. When the price-responsive demand programs have a higher penetration, so that the load reduction or increase is significant at the transmission level, P is influenced by each individual bid Bi. In this case, the dotted line in Fig. 6 is then connected. At each time step, the LSE calculates the bid price B and the power Qi iteratively based on (4) and (5) to meet the control objective (6), minimizing the load payment at t. Fig. 7 depicts the software framework envisaged for designing, implementing, and integrating the simulation components. The Power System Simulator (DTS/OTS) is an
Reliability Authority
I/F
I/F
I/F
Adapter
Adapter
Adapter
Integration I nfrastruc ture Adapter I/F Adapter I/F I/F Distribution
Feeder
where bi is the supply bid of the ith DER. Similarly, each LSE bids the expected balance of power at an expected price B into the bulk market. The control function of the ith LSE is,
T ransmission Service Provider
I/F
Adapter
(4)
Load Serving Entity
Adapter
Adapter
I/F
I/F
I/F
Generation Merchant
Balancing Authority
Wholesale Market
Adapter
Fig.7: Simulation integration framework [12]
V. ADVANCED STATISTICAL MODELS The difficultly of predicting the aggregate behavior of large scale market-based power systems has forced modelers to reconsider whether the use of deterministic simulations such as agent-based (bottom up) or reduced-order (top down) is necessarily the most effective course [14] [15]. Fundamentally, we desire a statistical model that will permit the adopted risk-based planning and operation strategies. However, most of these statistical models rely on extensive data sets, either from historical records or from agent-based simulations, neither of which can be relied upon to provide a complete basis of conditions to consider. Alternatively, some researchers have recently turned to methods pioneered by statistical physicists in an effort to develop better ab initio models of power systems and power markets [16] [17]. The advantage is clear; statistical aggregate model are more likely to accurately predict aggregate behaviors that are heretofore unseen, and they often provide deep insights into the underlying and perhaps hidden critical phenomena extant in these systems. Nevertheless, the difficultly of obtaining these statistics must not be underestimated. They are all too often prohibitively difficult to derive. In part, the challenge of deriving aggregate properties of complex systems (based on the agent properties and the rules of interaction) is to know which properties actually matter. In one sense we take our lesson from statistical thermodynamics, in which the first-principles derivation itself instructs us as to which properties actually have significance. For example, it is in deriving the state statistics of devices transacting power
© 2004 IEEE. Reprinted from Proceedings of 2004 PES PSCE Meeting
PNNL-SA-41618
5
contracts in markets that one arrives at the critical importance of the system entropy, the log of the count of configurations with identical costs. Presumably, the most probable arrangement of agent states that satisfy a given total cost is the most probable cost. Any market clearing price having high entropy is intuitively more likely to be more stable than those prices corresponding to costs having low entropy. Furthermore, notions analogous to thermal temperature and electrochemical potential can be derived for market-based control systems by considering the change of entropy with respect the total value and the total number of agents, respectively. These have been variously termed as the value of activity [16] and migration potential [18], and provide system aggregate properties that can be used to predict how two systems are likely to interact when they come into contact. For example, the theory predicts that the net flow of value (e.g., trades) will always go from the system with the higher activity to the one with lower activity. Similarly, the net flow of agents (e.g., customers) will always go from the system with higher migration potential to the one with lower potential (given the same activity). -1
10
PJM (1998-2002) Northeast (1999-2002) New England (2001) California (2001-2003)
-2
Probability ρ (U)
10
-3
10
-4
10
-5
10
0
10
1
10
2
10
3
4
10 10 Value U of hourly trading activity
5
10
6
10
7
10
Fig.8: Probability density function of trading volume in some U.S. bulk power markets from 1998 to 2003. Note the unique discrepancy of the California market.
Consideration of how local power distribution markets interact with bulk power markets is one of the principle motivators for creating agent-based distribution system simulations and coupling them with bulk power system simulators. To properly address what the aggregate behavior of such systems might be using these modeling techniques, we must verify one key assumption: is there a value U that is a conserved quantity. At this point, no direct evidence in the data can support this assumption, but reasonable first principles assumptions lead us to conclude it must be so if all investments, profits, etc. are considered. However, we have observed in data collected on a number of well-behaved bulk power markets that the total trading volume of power seems to be normally distributed about a mean value, as shown in Fig. 8. This is very consistent with the ab initio expectation that the total value of the system is conserved but does not rise to the level of confirming evidence we desire. As an example of how this is used, we propose a
Hamiltonian for the total value of any market distribution system: U = −QP − 12 RB (7) where Q is the quantity of power purchased on the bulk market at the price P, and R is the responsive amount of power traded locally within the distribution at price B, found by summing the value of the pair-wise relationships between buyers and producers. If we make the additional simplification that the majority of agents consume or produce a fixed amount q of power, then we can show that the local market is in unconstrained equilibrium with the bulk market, when the local price B is the same as the bulk price P and
U=
(
1 2
)
N − 2m − 2m 2 Pq
(8)
where 2m is the difference between the number of power customers for q units of power and the number of local power producers of q units of power, such that Q = 2mq and R = 4m2–N. It is worth also noting that the condition of unitary elasticity η = dlogQ/dlogP = –1 in the bulk market is the same as the condition of invariant bulk power cost dQP/dt = PdQ/dt + QdP/dt = 0. This condition only occurs given sufficient response R in the local market. We know from linear programming that global cost minimization is the dual to the local profit maximization objective. Thus finding the minimum value of U leads to the solution for maximal profit
2 m = −1 ± 1 + N (9) In other words, the difference between the local numbers of buyers and sellers minimizes the total system value when the fractional deviation from exact match (m = 0) is roughly ±N½. Not coincidently this fractional deviation represents the range of most probable bulk market power purchases, which tends to support the belief of proponents of distributed generation that its widespread use will promote cost minimization and maximize profitability of distribution systems. One interesting extension to this model is the Ising model, which draws its name from the Ising model of antiferromagnetism. This model has the additional feature that it permits consideration of distance effects, i.e., it is less likely that remote agents will trade power than immediate neighbors. For one thing the costs of trading over great distances are neither necessarily considering all true costs, nor are they very favorable to trading at all. For another, the information systems infrastructure required to support this capability is unwieldy and thus unlikely to find its way into residential agents. The two-dimensional Ising model presumes that each agent has four neighbors with whom it interacts and that its buy/sell state is influenced exclusively by the states of those four trading partners. The system forms a two dimensional lattice structure, the properties of which have been explored in papers since the first solutions were identified in the 1940s [19] [20]. What is compelling about the solution to the Ising model (and the Potts extension, which supports more than two states) is that it reveals the existence of a critical threshold of activity below which the system cannot sustain a fully functional local market. This critical threshold of activity is analogous to the Curie temperature for ferromagnetism. We expect that systems for which the market
© 2004 IEEE. Reprinted from Proceedings of 2004 PES PSCE Meeting
PNNL-SA-41618
6
activity is below the critical threshold, large-scale (in both time and space) highly ordered structures of buyers and sellers emerge and persist and all trading for power takes place between these large blocks. However, as local market activity increases, these large-scale structures break down and disappear and local less ordered trading begins to dominate the activity of the system, while the large-scale block trading become less of a governing feature of the system. This is exactly the desired outcome of distributed control, where both supply and demand interact fully and provide the kind of resilience and flexibility that makes local systems participate more like partners with the transmission system for balancing the flow of energy. VI. SUMMARY & ACKNOWLEDGEMENTS Studying the benefits and challenges of significant quantities of controllable DER in the system requires better modeling. Price responsive controls offer attractive distributed decision-making approaches, but to study these approaches interactions with market-based systems must also be simulated. The authors wish to thank the US Department of Energy and Pacific Northwest National Laboratory (PNNL) for their support through the Energy Systems Transformation Initiative, lead by Rob Pratt and the related GridWise program. We also wish to recognize Joe Roop, Eihab Fathelrahman, Zhenyu, Huang, Kevin Walker, and Ross Guttromson (all of PNNL), who have contributed directly to the advancement of this work. REFERENCES [1]
[2]
[3]
[4] [5]
[6]
[7]
[8]
[9]
M. L. Chan, E. N. Marsh, J. Y. Yoon, G. B. Ackerman, and N. Stoughton, “Simulation-based Load Synthesis Methodology for Evaluating Load-management Programs,” IEEE Trans. on Power Apparatus and Systems, vol. PAS-100, pp. 1771-1778, Apr. 1981. A. Molina, A. Gabaldon, J. A. Fuentes, and C. Alvarez, “Implementation and Assessment of Physically Based Electrical Load Models: Application to Direct Load Control Residential Programmes,” Generation, Transmission and Distribution, IEE Proceedings-, vol. 150, pp. 61-66, 2003. R. T. Guttromson, D.P. Chassin, and S. E. Widergren, “Residential Energy Resource Models for Distribution Feeder Simulation,” Proc. of 2003 IEEE PES General Meeting, Toronto, Canada, 2003. N. Lu and D. P. Chassin, “A State Queueing Model of Thermostatically Controlled appliances,” to appear in IEEE Trans. on Power Systems. R. G. Pratt and Z. T. Taylor, “Development and Testing of an Equivalent Thermal Parameter Model of Commercial Buildings from Time-Series End-Use Data,” Pacific Northwest Laboratory, Richland, WA, Apr. 1994. Z. T. Taylor and R. G. Pratt, “The Effects of Model Simplifications on Equivalent Thermal Parameters Calculated from Hourly Building Performance Data,” in Proceedings of the 1988 ACEEE Summer Study on Energy Efficiency in Buildings, pp. 10.268-10.285, 1988. N. D. Hatziargyriou, T. S. Karakatsanis, and M. Papadopoulos, “Probabilistic Calculations of Aggregate Storage Heating Loads,” IEEE Trans. on Power Delivery, vol. 5, No. 3, pp. 1520–1526, 1990. N. E. Ryan, S. D. Braithwait, J. T. Powers, and B. A. Smith, “Generalizing Direct Load Control Program Analysis: Implementation of the Duty Cycle Approach,” IEEE Trans. on Power Systems, vol. 4, pp. 293–299, 1989. N. Lu, D. P. Chassin, and S. E. Widergren, “Modeling Uncertainties in Aggregated Thermostatically Controlled Loads Using a State Queueing Model,” submitted to IEEE Trans. on Power Systems, 2004.
[10] Java 2 Platform: Enterprise Edition (J2EE). Sun Microsystems. [Online]. Available: http://java.sun.com/j2ee/ [11] A. Thomas, “Enterprise JavaBeans™ Technology: Server Component Model for the Java™ Platform,” Patricia Seybold Group, Dec. 1998. [Online]. Available: http://www.cs.indiana.edu/classes/b649-gann/ejbwhite-paper.pdf [12] S. E. Widergren, J. M. Roop, R. T. Guttromson, Z. Huang, “Simulating the Dynamic Coupling of Market and Physical System Operations,” Proc. of 2004 IEEE PES General Meeting, 2004. [13] S. V. Vadari, M. J. Montstream,. and H. Ross, Jr., “An Online Dispatcher Training Simulator Function for Real-Time Analysis and Training,” IEEE Trans. on Power Systems, Nov, 1995. [14] V. Sergeev, Limits to Rationality, English publication pending, 2004. [15] D. K Foley, “Maximum Entropy Exchange Equilibrium”, New School for Social Research, New York, 2002. [16] D. P. Chassin, "Statistical Mechanics: A Possible Model for Marketbased Electric Power Control," in Proc. of the 37th Hawaii International Conference on System Sciences (HICSS-37), Hawaii 2004. [17] E. Smith, and D. K. Foley, “Classical Thermodynamics and Economic General Equilibrium Theory”, New School for Social Research, New York, 2002. [18] V. Sergeev, “The Thermodynamic Approach to Market Equilibrium”, Santa Fe Institute, 2003. [19] H. A. Kramers, G. H. Wannier, “Statistics of the Two-Dimensional Ferromagnet. Part I”, Phys. Rev., vol 60, 1941. [20] L. Onsager, “Crystal Statistics. I. A Two-Dimensional Model with an Order-Disorder Transition”, Phys. Rev., vol. 65, no. 3/4, 1944.
BIOGRAPHIES Ning Lu (M’98) received her B.S.E.E. from Harbin Institute of Technology, Harbin, China, in 1993, and her M.S. and Ph.D. degrees in electric power engineering from Rensselaer Polytechnic Institute, Troy, New York, in 1999 and 2002, respectively. Her research interests are in the modeling and analyzing deregulated electricity markets. Currently, she is a research engineer with the Energy Science & Technology Division, Pacific Northwest National Laboratory, Richland, WA. She was with Shenyang Electric Power Survey and Design Institute from 1993 to 1998. David P. Chassin received his BS of Building Science from Rensselaer Polytechnic Institiute in Troy, New York. He is staff scientist with the Energy Science & Technology Division at Pacific Northwest National Laboratory where he has worked since 1992. He was Vice-President of Development for Image Systems Technology from 1987 to 1992, where he pioneered a hybrid raster/vector computer aided design (CAD) technology called CAD OverlayTM. He has developed building energy simulation and diagnostic systems, leading the development of Softdesk Energy and DOE’s Whole Building Diagnostician. He has served on the International Alliance for Interoperability’s Technical Advisory Group, chaired the Codes and Standards Group. His recent research focuses on emerging theories of complexity as they relate to high-performance simulation and modeling. Steve Widergren (M’1978, SM’1992) received his BSEE (1975) and MSEE (1978) from the University of California, Berkeley. He works at the Pacific Northwest National Laboratory, where he contributes to the research of new solutions for the economic and reliable operation of power systems. Prior to joining PNNL, he was with ALSTOM ESCA, a bulk transmission energy management system supplier, where he designed software solutions for system operations and championed the establishment of an integrated suite of energy management system software products. He has also held power engineering positions at American Electric Power and Pacific Gas & Electric (as an intern). He is vice-chair of the PES Energy Control Center Subcommittee and a member of the IEEE SCC 21 1547.3 standards group on monitoring, information exchange, and control of distributed resources.
© 2004 IEEE. Reprinted from Proceedings of 2004 PES PSCE Meeting