IET Renewable Power Generation Research Article
Simultaneous fault detection algorithm for grid-connected photovoltaic plants
ISSN 1752-1416 Received on 6th March 2017 Revised 24th June 2017 Accepted on 27th July 2017 doi: 10.1049/iet-rpg.2017.0129 www.ietdl.org
Mahmoud Dhimish1 , Violeta Holmes1, Bruce Mehrdadi1, Mark Dales1 1Department
of Computing and Engineering, University of Huddersfield, Queens gate, Huddersfield, UK E-mail:
[email protected]
Abstract: In this work, the authors present a new algorithm for detecting faults in grid-connected photovoltaic (GCPV) plant. There are few instances of statistical tools being deployed in the analysis of photovoltaic (PV) measured data. The main focus of this study is, therefore, to outline a PV fault detection algorithm that can diagnose faults on the DC side of the examined GCPV system based on the t-test statistical analysis method. For a given set of operational conditions, solar irradiance and module temperature, a number of attributes such as voltage and power ratio of the PV strings are measured using virtual instrumentation (VI) LabVIEW software. The results obtained indicate that the fault detection algorithm can detect accurately different types of faults such as, faulty PV module, faulty PV String, faulty Bypass diode and faulty maximum power point tracking unit. The proposed PV fault detection algorithm has been validated using 1.98 kWp PV plant installed at the University of Huddersfield, UK.
1 Introduction In recent years, the photovoltaic market has developed rapidly throughout the world. A significant factor leading to this large growth in the photovoltaic (PV) industry is the reduction of PV generation costs. In addition, most developed countries have implemented specific governmental strategies to encourage the introduction of grid-connected PV (GCPV) plants. Successful examples can be seen in Germany, Japan and Kenya [1]. This important growth has not, however, been accompanied by similarly significant improvements in the field of PV system fault diagnosis and detection. Most PV systems, currently in use, operate without any supervisory mechanism. These tend to be PV systems with power outputs below 25 kWp [2]. However, following the fast growth of PV installations, fault detection techniques nowadays are important to be deployed in smaller scale PV systems, which do tend to be 25 kWp or less. The need for higher performance, efficiency and reliability for GCPV systems has led to a recent interest in fault detection algorithms. Different factors can be responsible for the production losses in a PV system, including; maximum power point tracking (MPPT) unit error [3, 4], wiring losses and ageing [5], shading effect [6, 7], PV micro-cracks effect [8, 9], snow accumulation on the surface of PV solar panels [10] and faulty DC/AC inverters [11]. There are several existing techniques, which have been developed for fault detection in GCPV plants. Tadj et al. [12] proposed an algorithm that uses a satellite data for detecting faults using the GISTEL approach. The algorithm is able to detect several faulty conditions in PV systems such as partial shading effect, faulty PV modules and faulty PV string. However, some algorithms do not require any climate data (solar irradiance and module temperature) but instead use earth capacitance measurements in a technique established by Takashima et al. [13], this approach follows three PV performance diagnosis layers, starting with passive diagnosis part, then fault separation method and ending with active layer which contains the fault location in a PV string. Other fault detection algorithm techniques are based on a diagnostic signal, which indicates a possible fault occurring in the GCPV plant such as short-circuit fault in any bypass diodes in PV string, shunted bypass diode fault and connection resistance fault between PV modules [14]. In [15], authors proposed a reliable fault detection method for GCPV systems. The method was developed IET Renew. Power Gener. © The Institution of Engineering and Technology 2017
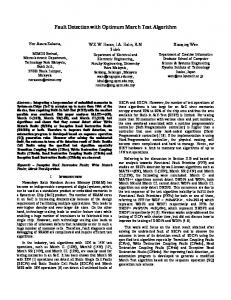
using two algorithms based on artificial neural network (ANN) and theoretical current–voltage (I–V) curve characteristics. The development of a fault detection algorithm, which allows the detection of seven different fault modes on the DC side of a GCPV system is presented by Dhimish and Holmes [16]. The algorithm used a t-test statistical approach for identifying the presence of system fault conditions. Platon et al. [17] proposed a fault detection algorithm which focuses on the AC side of the GCPV system. The approach uses ±3 standard deviation (SD) statistical analysis technique. In addition, hot-spot detection in PV substrings using AC parameters characterisation was developed by [18], the approach is used to detect the number of shaded PV modules in a PV string, where the algorithm proves that the hot spot detection can be achieved with two frequency measurements: one for the higher frequency capacitive region and one for the low-frequency DC impedance region. The analysis of the current and voltage indicators in a GCPV system operating in partial shading faulty conditions is explained by Silvestre et al. [19], this approach is using the relationship between the ratios of the current in case of one faulty string and fault-free operation mode. In addition to the ratio between the voltage ratios (VRs) in case of one bypassed PV module and fault free operation mode. In this work, we present the development of a fault detection algorithm, which allows a simultaneous detection of faults occurring in a GCPV plant. The algorithm uses the theoretical and measured power outputs from the GCPV plant. Initially, the measured output power is compared with the theoretical power. Subsequently, a statistical t-test technique is used to check the location of the fault, which has occurred on the system. Two parameters are calculated and used in order to determine the type of fault: the power ratio (PR) between the simulated and measured power; and the VR between the simulated and measured voltage. Fig. 1 shows all types of faults, which can be identified by the proposed fault detecting algorithm. It can be observed that faults occurring in GCPV plants can be classified into two main categories: • Faults in the data acquisition, • Faults in the DC side of the GCPV system. This paper is organised as follows: Section 2 presents the data acquisition in the GCPV plant. Section 3 describes the methodology used, fault detection algorithm and diagnosis rules 1
Fig. 1 Different type of faults occurring in the examined GCPV plant
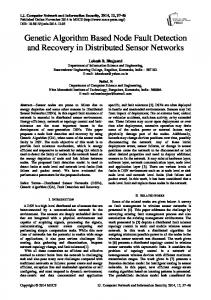
Fig. 2 GCPV plant installed at Huddersfield University, UK
are presented, while Section 4 lists the results and discussion of the work. Finally, Section 5 describes the conclusion and future work.
2 GCPV plant and data acquisition The PV system used in this work comprises a GCPV plant containing nine polycrystalline silicon PV modules each with a nominal power of 220 Wp. The PV modules are organised in three strings and each string is made up of three series-connected PV modules. Using a PV connection unit, which is used to enable or disable the connection of any PV modules from the entire GCPV plant, each PV string is connected to MPPT which has an output efficiency not < 98.5%. Subsequently, each MPPT unit is connected to a DC/AC inverter unit manufactured by Victron energy. The efficiency of the DC/AC unit is in the range 94–88% [20]. The DC current and voltage are measured using the internal sensors which are part of the Flexmax MPPT unit and DC/AC inverter. 2
A Vantage Pro monitoring unit is used to receive the global solar irradiance measured by a Davis Weather Station, which includes a pyranometer. The pyranometer is placed at the same tilt and azimuth angel as the PV installation at 42° and 185°, respectively. The Hub 4 communication manager is used to facilitate the acquisition of module temperatures using the Davis external temperature sensor, and the electrical data for each PV string. Finally, Virtual Instrumentation (VI) LabVIEW software is used to implement the data logging and monitoring functions of the GCPV system. Fig. 2 illustrates the overall system architecture of the GCPV plant. The SMT6 (60) P solar module manufactured by Romag has been used in this work. The electrical characteristics of the solar module are shown in Table 1. Additionally, the standard test condition (STC) for these solar panels are: solar irradiance = 1000 W/m2 and module temperature = 25°C.
IET Renew. Power Gener. © The Institution of Engineering and Technology 2017
3 Methodology 3.1 Photovoltaic output power modelling The DC side of the GCPV system is modelled using five-parameter model. The voltage and current characteristics of the PV module can be obtained using the single diode model [21] as illustrated in (1). I = Iph − Io e
(V + IRs)/ nsV t
V + IRs −1 − Rsh
(1)
where Iph is the photo-generated current at STC, Io is the dark saturation current at STC, Rs is the module series resistance, Rsh is the panel parallel resistance, ns is the number of series cells in the PV module and V t is the thermal voltage and it can be calculated using (2). Vt =
AKT q
(2)
where A is the ideal diode factor, k is the Boltzmann's constant, and q is the charge of the electron. The five-parameter model is determined by solving the transcendental (1) using Newton–Raphson algorithm [21] based only on the datasheet of the available parameters shown previously in Table 1. The power produced by PV module in watts can be easily calculated along with the current (I) and voltage (V) that is generated by (1); therefore, Ptheoretical = IV. The I–V curve analysis of the tested PV module is simulated using LabVIEW software as shown in Fig. 3. The maximum current and voltage for each irradiance level under the same temperature value can be expressed by the I–V curves. The purpose Table 1 Electrical characteristics of SMT6 (60) P PV module Solar panel electrical characteristics Value peak power voltage at maximum power point (Vmp)
220 W 28.7 V
current at maximum power point (Imp)
7.67 A
open circuit voltage (VOC)
36.74 V
Short-circuit current (Isc)
8.24 A
number of cells connected in series number of cells connected in parallel Rs, Rsh dark saturation current (Io) ideal diode factor (A) Boltzmann's constant (K)
60 1 0.48 Ω, 258.75 Ω 2.8 × 10⁻¹⁰ A 0.9117 1.3806 × 10⁻²³ J.K−1
of the I–V curve analysis, is to generate the expected output power of the examined PV modules. The analysis of the I–V curve can be used to predict the error between the measured PV data and the theoretical current and voltage performance. 3.2 GCPV fault detection algorithm The main objective of the fault detection algorithm is to detect and determine when and where a fault has occurred in the examined GCPV plant. The algorithm uses the climate data that is collected using the Davis weather station and the internal sensors of the MPPT units. Furthermore, LabVIEW software simulates the theoretical I–V curve of the GCPV system as shown in Fig. 4a. The t-test statistical analysis method is used to compare the theoretical and measured output power of the GCPV system. The ttest is evaluated using (3) where x¯ is the mean of the samples, μ is the population mean, n is the sample size and SD is the standard deviation of the entire data. The real-time measurements are taken by averaging 60 samples taken at 1 min intervals. The results obtained for power, voltage and current are calculated at one minute intervals for each sample set. To determine whether the ttest analysis is significant, a threshold value of 2.68 was used as shown in Fig. 4b, this threshold has been used since it is the theoretical threshold of the t-test for a confidence interval equals to 99% [22]. However, the threshold could be chosen as 1.64 if the values of the simulated power by the PV system has low degree of accuracy (in case MPPT unit is not used with the PV plant) [22]. To determine the value of the t-test, firstly the GCPV power simulation (theoretical power) is compared with the output measured power. Then the value of the t-test is taken from Fig. 4b based on the confidence limit needed in the simulation. In this paper, the confidence limit and the number of samples that have been used are equal to 99% and 60 respectively. Finally, if the t-test value is above the threshold 2.68; therefore, a fault has been detected in the PV system which means that the proposed fault detection algorithm is activated as shown in Fig. 4c. The proposed fault detection algorithm will be activated if the value of the t-test is higher than 2.68. Fig. 4c describes the fault detection algorithm. The algorithm is capable of detecting multiple faults such as: faulty PV module in a PV string, two faulty PV modules in a PV string, faulty PV String, partial shading (PS) with and without faulty bypass diodes in the PV string and faulty MPPT. 3.3 Proposed fault detection algorithm The fault detection algorithm is used to determine the type of the fault in the DC side of the examined GCPV system. Two ratios have been identified. PR and VR have been used to categorise the region of the fault because both ratios have the following features: i.
Both ratios are changeable during the faulty conditions in the GCPV plant.
Fig. 3 I–V curve modelling under various irradiance levels IET Renew. Power Gener. © The Institution of Engineering and Technology 2017
3
Fig. 4 Fault detection in the GCPV plant (a) General algorithm using t-test statistical technique, (b) T-test statistical confidence interval limits, (c) Activating the proposed PV fault detection algorithm
ii. When disconnecting a PV module in a series PV string, the VR will decrease significantly. iii. When the PR is equal to zero, the VR can still have a value regarding the voltage open circuit of the PV modules. PR and VR ratios are calculated using (3) and (4) respectively. PR =
Ptheoretical Pmeasured
(3)
VR =
V theoretical V measured
(4)
where Ptheoretical is the theoretical output power generated by the GCPV system, Pmeasured is the measured output power from PV string, V theoretical is the theoretical output voltage generated by the GCPV system and V measured is the measured output DC voltage from PV string. Based on the analysis of the PR for the GCPV system, numerical calculations for the DC-side fault rules are shown in Fig. 5a. Since the internal sensors of the MPPT have a conversion error rate of 98.5%, the PRs are calculated at 1.5% error tolerance of the theoretical power, which presents the maximum error condition for the examined GCPV system. The values are calculated according to the set of conditions shown in Fig. 5a. The maximum and minimum PR and VR ratios are expressed by (5)–(8), which contains the tolerance rate of the MPPT units and the total number of PV modules in the PV string: PR min =
Ptheoretical /number of PV strings (Pmeasured /number of PV strings) − nP0
(5)
PR max =
4
Ptheoretical /number of PV strings (Pmeasured /number of PV strings) − nP0 × MPPT tolerance rate (6)
V theoretical V measured − nV 0
(7)
V theoretical V measured − nV 0 × MPPT tolerance rate
(8)
VR min = VR max =
where n is the number of faulty PV modules and P0 is the peak power of the PV module at STC. The number of faulty PV modules are expressed by the number of PV modules in the examined PV string. For example, if the PV string comprises three PV modules connected in series, therefore, n = 3. Additionally, the peak power can be found in the data sheet of the examined PV module. Additionally, in this paper, a faulty PV module corresponds to a short-circuited PV module. VRs are used to identify the fault type occurring in the GCPV system. Fig. 5b describes the relationship between the PR and VR. Faults can be detected according to the following conditions, where a brief calculations on the variations of both VR and PR are found in Appendix 1: i. Sleep mode will start during the night when PR = 0. ii. If 1.015 ≥ PR ≥ 1: it means that the GCPV system operates at the normal operation mode. iii. If 1.52 ≥ PR ≥ 1.5: in this case, two categories of faults are identified. If 1.5233 ≥ VR ≥ 1.5: it indicates that there is a faulty PV module in the string, otherwise, a partial shading condition has occurred in the PV string. iv. If 3 > PR > 1.52: in this case if the VR is between 1.5 and 1.5233, a faulty PV module and a partial shading effect on the PV string has arisen. However, if the VR is outside of the range 1.5233–1.5, partial shading is the only condition affecting the PV string. v. If 1000 > PR ≥ 3: this case can determine various faults such as: Faulty PV module with PS effect on the PV string, partial shading effect on the PV string, two faulty modules in the PV string, two faulty modules in the PV string and partial shading effect. vi. If PR = 1000, where the GCPV plant has a failure in a PV string or a failure in a MPPT unit. IET Renew. Power Gener. © The Institution of Engineering and Technology 2017
Fig. 5 Brief calculations of the proposed fault detection in the GCPV plant (a) Threshold values for detecting faults in the DC side of the GCPV based on the PR rule, (b) DC-side faulty conditions based on the analysis of PR and VR
The theoretical short-circuit current Isc of the GCPV system is 8.18 A. For all partial shading conditions if the measured shortcircuit current is 98.5% of the theoretical simulated power.
4 Results and discussion In this section, the performance of the proposed fault detection algorithm is verified. Four different sub-sections are demonstrated: the normal operation and sleep mode, detect faults in the data acquisition, performance evaluation for the fault detection algorithm, and a discussion section which illustrates the difference between the proposed PV fault detection algorithm with recent developed fault detection algorithms in PV systems. The acquired data for various days have been considered. The time zone for all measurements is GMT, taken in Huddersfield, UK. 4.1 Normal operation and sleep mode The normal operation and sleep mode for the GCPV system is shown in Fig. 6a. Starting from 6 : 00 and ending at 6 : 21, the GCPV system is in sleep mode where the GCPV system has not yet received any solar irradiance to generate output power. However, between the time 6 : 22 and 19 : 41, the GCPV system is in the normal operation mode. The measured DC and AC power are very close to the theoretical DC and AC output power. According to the achieved results of this test, the output power efficiency for both the DC/DC converter and DC/AC inverter is equal to 98.89 and 92.7%, respectively. Fig. 6a shows that the GCPV system is stable for all variation of the measured sun irradiance levels. 4.2 Detecting faults caused by data acquisition system There are multiple faults which might occur in the GCPV system due to the data acquisition units such as: • Running VI LabVIEW software: errors in loading graphs and saving data. • Delay in Data Logging: delay in the readings obtained by the internal sensors of the DC/DC or DC/AC units. As shown in Fig. 6a, the VI LabVIEW software stopped logging the measured and theoretical data between 13 : 27 and 13 : 55. This type of fault might occur in the running software due to VI LabVIEW version updates and the multiple functions, which the software handles at the same time. It is therefore required to create a structural code for the VI LabVIEW software before the data collection step. 4.3 Performance evaluation for the proposed PV fault detection algorithm In order to test the ability of the fault detection algorithm, described previously in Section 3.3, a number of experiments were conducted over a period of a full day. Table 2 shows the start and end time for each experiment that has been examined in the GCPV 6
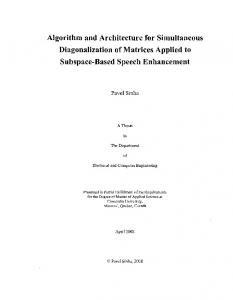
system. Ten different case scenarios were tested sequentially, between 6 : 00 and 20 : 24. Brief description on how the GCPV system was perturbed is shown in Appendix 2. As shown in Fig. 6b, starting from 6 : 21, the GCPV system starts to generate output power after the sleep mode is finished. The GCPV system operates in a normal operation mode until 10 : 00, where the PR and the VR of this case are equal to 1.012 and 1.18 respectively as illustrated in Figs. 7a and b. One faulty PV module is conducted in the first PV string between 10 : 00am and 11 : 00am. The PR and VR for this particular case are equal to 1.511 and 1.502, respectively. Two faulty PV modules in the second PV string are tested between 11 : 00 and 12 : 00. In this case, the PR for the second PV string is equal to 3.021, while the first and third PV strings operate in normal operation mode. By disconnecting one PV module and applying a 30% partial shading, using an opaque paper object, to the third PV string as shown in Fig. 7a between 12 : 00 and 14 : 00, the PR is equal to 2.36. Additionally, the measured short-circuit current is used to detect possible faults in the bypass diode for the examined PV string. Fig. 7c shows the variations of the measured short-circuit current for the GCPV system. As described previously in Section 3.3, the theoretical upper and lower limits for the short-circuit current are equal to 8.18 and 8.0571 A, respectively. A faulty bypass diode is detected by the algorithm between 13 : 00 and 14 : 00. In this case, the measured short-circuit current lies between 5.6 and 5.9 A. The only difference between a faulty MPPT unit and faulty PV string is that the VR ratio maintains a value >1. Faulty MPPT and faulty PV string conditions are tested between 14 : 00 and 16 : 00 in different PV strings. VR and PR for a faulty MPPT is equal to 1000 for the first PV string as shown in Figs. 7a and b. However, the PR and VR ratios for the faulty PV string tested between 15 : 00 and 16 : 00 on the second PV string is equal to 1000 and 1.003, respectively. From 16 : 00 until 20 : 24 no faults occurred in the GCPV system and the sleep mode of the system starts when the PR and VR is equal to zero at 19 : 41. All obtained results for the various test conditions indicate that PV fault detection algorithm has a high detection capability, there is no evidence of any errors in the detecting algorithm while conducting different fault case scenarios at different PV locations. The time and the type of fault are recognised by the algorithm. 4.4 Discussion In order to test the effectiveness of the proposed fault detection algorithm, the results obtained have been compared with the multiple fault detection algorithms presented in [14–17, 23]. The comparison between the outputs given by our proposed algorithm and five recent fault detection methods are shown in Table 3. It can be seen that, different case studies have been examined for each of the methods, whereas the fault detection algorithm proposed in this paper can only diagnose all examined case studies. None of the reviewed fault detection algorithms can identify hot spots and dust levels in GCPV systems. It is necessary, therefore, to carry out further work in these areas with a view to including the detection of these faults in a future generic advanced algorithm. Even though [17] is using statistical analysis technique in a PV detection algorithm however, the presented technique cannot identify any type of faults occurred in the PV installation. The proposed algorithm has used two ratios (VR and PR) which are similar to the power and VRs described by Silvestre et al. [24]. However, the proposed approach used in [24] does not detect any failures in the AC side of the examined GCPV systems. Similar power and VRs have been reused by Mohammed et al. [11], but this algorithm is using the estimation of the hourly solar radiation using GISTEL model which has been improved by a fuzzy logic rules, the algorithm is not capable of detecting several faults such as, faulty MPPT unit and faulty bypass diodes associated with the PV modules. The combination between the DC- and AC-side PR can be used to detect possible faults in the GCPV plant as described by W. IET Renew. Power Gener. © The Institution of Engineering and Technology 2017
Fig. 6 Real-time long-term data measurements of the examined GCPV plant (a) GCPV system theoretical and measured output DC and AC power in a normal operation mode, sleep mode and detecting the fault in the data acquisition due to faulty data logging using VI LabVIEW software, (b) GCPV system theoretical DC output power versus measured output DC power under ten different case scenarios
Table 2 Diagnosis multiple faults in multiple strings locations Case number Start time End time First PV string Second PV string 1 2 3 4 5
6 : 00 6 : 21 10 : 00 11 : 00 12 : 00
6 : 20 10 : 00 11 : 00 12 : 00 13 : 00
6
13 : 00
14 : 00
7 8 9 10
14 : 00 15 : 00 16 : 00 19 : 41
15 : 00 16 : 00 19 : 41 20 : 24
Third PV string
sleep mode sleep mode sleep mode normal operation normal operation normal operation faulty PV module normal operation normal operation normal operation two faulty PV modules faulty PV module normal operation normal operation 30% partial shading and faulty PV module without fault in bypass diode in the PV string normal operation normal operation 30% partial shading and faulty PV module and faulty bypass diode in the PV string faulty MPPT normal operation normal operation faulty MPPT faulty PV string normal operation normal operation normal operation normal operation sleep mode sleep mode sleep mode
IET Renew. Power Gener. © The Institution of Engineering and Technology 2017
7
Fig. 7 Detecting multiple faults using the fault detection algorithm (a) PR for all PV strings, (b) VR for All PV strings, (c) Measured output short-circuit current variations
Chine et al. [14]. This approach is different than the proposed algorithm used in this paper by the following:
8
i.
This paper divided the DC-side PRs into two different indicators and calculated using (5)–(8), which makes the algorithm easier to use with larger PV installations later on.
IET Renew. Power Gener. © The Institution of Engineering and Technology 2017
Table 3 Comparative results between the proposed algorithm and several fault detection methods Case study Proposed Dhimish et al. Dhimish et al. Chine et al. [15] Platon et al. algorithm [23] [16] [17] month/year of the study fault detection algorithm approach
software used in the study faulty PV module in a PV string faulty strings in a GCPV plant faulty MPPT unit partial shading effect faulty bypass diodes
2017 September 2016 t-test statistical t-test statistical technique technique
August 2016 t-test statistical technique
January 2016 I–V curve characteristics and ANN
Chine et al. [14]
October 2015 December 2014 standard mathematical ratios deviation statistical technique Not Mentioned MATLAB/SIMULINK ✗ √
LabVIEW √
LabVIEW √
LabVIEW √
MATLAB/SIMULINK √
√
✗
√
√
✗
√
√ √ √
✗ √ ✗
√ √ ✗
✗ √ √
✗ ✗ ✗
√ √ ✗
Fig. 8 PR versus VR based on the analysis of the proposed PV fault detection algorithm
ii. This paper shows how to detect faulty bypass diodes with partial shading conditions affect the GCPV system. However, [14] does not have this feature as illustrated in Table 3.
Finally, The VI LabVIEW monitoring unit used to implement the fault detection algorithm is briefly illustrated and explained in [26].
Nowadays, some articles use machine learning techniques such as the artificial intelligent networks (ANN) in order to detect faults in GCPV systems. W. Chine et al. [15] demonstrate an ANN fault detection approach used with PV systems. The approach is focused on faulty conditions such as inversed bypass diodes, shunted bypass diodes and short-circuit fault in bypass diodes. Only a faulty bypass diode with partial shading effect is presented by this paper. Several statistical analysis techniques have been used to detect possible faults in GCPV plants. A regression algorithm for diagnosis faults in PV generators has been illustrated by Wail et al. [25]. However, Dhimish et al. [23] used another statistical analysis technique called t-test, which is similar to the work presented in this paper. However, the proposed technique by Dhimish et al. [23] cannot detect faulty PV strings in the GCPV plant. In addition, the algorithm is not capable of detecting faulty bypass diodes associated with the PV modules and faulty MPPT unit. Few other approaches used standard divination (σ) limits, either ±3σ or ±σ such as [11, 13, 17] (Fig. 8)
5 Conclusion
IET Renew. Power Gener. © The Institution of Engineering and Technology 2017
PV fault detection algorithm for a GCPV plant based on t-test statistical approach is proposed and verified using a 1.98 kWp GCPV system. The proposed fault detection algorithm facilitates the detection of various faults on the DC side of the GCPV system. In order to identify failures in the GCPV system, we have defined two indicators namely, PR and VR. By using both ratios it is possible to determine the PV faulty type, time and marking the string which contains any faulty PV modules (it cannot identify the faulty modules within the PV string). The graphical user interface was created to monitor the status of the existing system using VI LabVIEW software. A novel contribution of this research is the use of a new statistical approach to identify failures on the DC side of the GCPV plant based on real-time, long-term field data measurements. In the future, it is intended to create a generic fault detection algorithm to detect multiple faults in the GCPV systems based on artificial intelligence machine learning techniques. Also, it is possible to enhance the proposed fault detection algorithm by adding another fault detection layer which can examine PV cracks. 9
[26]
6 References [1] [2] [3] [4] [5]
[6] [7] [8] [9] [10] [11] [12] [13] [14] [15] [16] [17] [18] [19] [20] [21] [22] [23]
[24] [25]
Ondraczek, J.: ‘Are we there yet? Improving solar PV economics and power planning in developing countries: The case of Kenya’, Renew. Sust. Energy Rev., 2014, 30, pp. 604–615 Dhimish, M., Holmes, V., Mehrdadi, B., et al.: ‘Diagnostic method for photovoltaic systems based on six layer detection algorithm’, Electr. Power Syst. Res., 2017, 151, (C), pp. 26–39, doi: 10.1016/j.epsr.2017.05.024 Lasheen, M., Rahman, A.K.A., Abdel-Salam, M., et al.: ‘Adaptive reference voltage-based MPPT technique for PV applications’, IET Renew. Power Gener., 2017, 11, (5), pp. 715–722 Karbakhsh, F., Amiri, M., Zarchi, H.A.: ‘Two-switch flyback inverter employing a current sensorless MPPT and scalar control for low cost solar powered pumps’, IET Renew. Power Gener., 2016, 11, (5), pp. 669–677 Mojallizadeh, M.R., Badamchizadeh, M., Khanmohammadi, S., et al.: ‘Chattering free full-order terminal sliding-mode control for maximum power point tracking of photovoltaic cells’, IET Renew. Power Gener., 2016, 11, (1), pp. 85–91 Dhimish, M., Holmes, V., Mehrdadi, B., et al.: ‘Seven indicators variations for multiple PV array configurations under partial shading and faulty PV conditions’, Renew. Energy, 2017, (113), pp. 438–460 Shah, N., Rajagopalan, C.: ‘Experimental investigation of a multifunctional grid interactive photovoltaic system operating in partial shading conditions’, IET Renew. Power Gener., 2016, 10, (9), pp. 1382–1392 Dhimish, M., Holmes, V., Mehrdadi, B., et al.: ‘The impact of cracks on photovoltaic power performance’, J. Sci.: Adv. Mater. Devices, 2017, 2, (2), pp. 199–209 Dhimish, M., Holmes, V., Dales, M., et al.: ‘The effect of micro cracks on photovoltaic output power: case study based on real time long term data measurements’, Micro Nano Lett., 2017, DOI: 10.1049/mnl.2017.0205 Jelle, B.P.: ‘The challenge of removing snow downfall on photovoltaic solar cell roofs in order to maximize solar energy efficiency—Research opportunities for the future’, Energy Build., 2013, 67, pp. 334–351 Karabiber, A., Keles, C., Kaygusuz, A., et al.: ‘An approach for the integration of renewable distributed generation in hybrid DC/AC microgrids’, Renew. Energy, 2013, 52, pp. 251–259 Tadj, M., Benmouiza, K., Cheknane, A., et al.: ‘Improving the performance of PV systems by faults detection using GISTEL approach’, Energy Convers. Manage., 2014, 80, pp. 298–304 Takashima, T., Yamaguchi, J., Otani, K., et al.: ‘Experimental studies of fault location in PV module strings’, Sol. Energy Mater. Sol. Cells, 2009, 93, (6), pp. 1079–1082 Chine, W., Mellit, A., Pavan, A.M., et al.: ‘Fault detection method for gridconnected photovoltaic plants’, Renew. Energy, 2014, 66, pp. 99–110 Chine, W., Mellit, A., Lughi, V., et al.: ‘A novel fault diagnosis technique for photovoltaic systems based on artificial neural networks’, Renew. Energy, 2016, 90, pp. 501–512 Dhimish, M., Holmes, V.: ‘Fault detection algorithm for grid-connected photovoltaic plants’, Sol. Energy, 2016, 137, pp. 236–245 Platon, R., Martel, J., Woodruff, N., et al.: ‘Online fault detection in PV systems’, IEEE Trans. Sust. Energy, 2015, 6, (4), pp. 1200–1207 Kim, K.A., Seo, G.S., Cho, B.H., et al.: ‘Photovoltaic hot-spot detection for solar panel substrings using ac parameter characterization’, IEEE Trans. Power Electron., 2016, 31, (2), pp. 1121–1130 Silvestre, S., Kichou, S., Chouder, A., et al.: ‘Analysis of current and voltage indicators in grid connected PV (photovoltaic) systems working in faulty and partial shading conditions’, Energy, 2015, 86, pp. 42–50 Dhimish, M., Holmes, V., Mehrdadi, B., et al.: ‘Multi-layer photovoltaic fault detection algorithm’, High Volt., 2017, DOI: 10.1049/hve.2017.0044 Sera, D., Teodorescu, R., Rodriguez, P.: ‘PV panel model based on datasheet values’. Int. Symp. on Industrial Electronics, 2007 (ISIE 2007), June 2007, pp. 2392–2396 Miller, J.N., Miller, J.C.: ‘Statistics and chemometrics for analytical chemistry’ (Pearson Education, 2005) Dhimish, M., Holmes, V., Dales, M.: ‘Grid-connected PV virtual instrument system (GCPV-VIS) for detecting photovoltaic failure’. 2016 Fourth Int. Symp. on Environmental Friendly Energies and Applications (EFEA), Belgrade, 2016, pp. 1–6, doi: 10.1109/EFEA.2016.7748777 Silvestre, S., da Silva, M.A., Chouder, A., et al.: ‘New procedure for fault detection in grid connected PV systems based on the evaluation of current and voltage indicators’, Energy Convers. Manage., 2014, 86, pp. 241–249 Wail, R., Mouss, N.K., Mouss, L.H., et al.: ‘A regression algorithm for the smart prognosis of a reversed polarity fault in a photovoltaic generator’. 2014 Int. Conf. on Green Energy, March 2014, pp. 134–138
PR max = =
PR max = = 10
Dhimish, M., Holmes, V., Dales, M.: ‘Parallel fault detection algorithm for grid-connected photovoltaic plants’, Renew. Energy, 2017, 113, pp. 94–111
7 Appendix 1 Brief calculations for the faulty PV regions: Normal operation mode: PR: Ptheoretical /number of PV strings (Pmeasured /number of PV strings) − nP0
PR min =
1982/3 660.6 = =1 (1982/3) − 0 220.2 660.6 − 0
=
(see equation below) VR: VR min =
V theoretical 86.1 = =1 V measured − nV 0 86.1 − 0 28.7
V theoretical V measured − nV 0 × MPPT tolerance rate 86.1 = = 1.015228 86.1 − 0 28.7 × 98.5%
VR max =
i.
Faulty PV module: PR: Ptheoretical number of PV strings PR min = Pmeasured − nP0 number of PV strings 1982/3 660.6 = = = 1.5 (1982/3) − 1 220.2 660.6 − 220.2 (see equation below) VR: V theoretical V measured − nV 0 86.1 = = 1.5 86.1 − 1 28.7
VR min =
VR max V theoretical V measured − nV 0 × MPPT tolerance rate 86.1 = = 1.5233 86.1 − 1 28.7 × 98.5% ii. Faulty PV modules: =
PR:
Ptheoretical /number of PV strings (Pmeasured /number of PV strings)‐‐nP0 × MPPT tolerance rate 1982/3 660.6 = = 1.015228 (1982/3) − 0 220.2 × 98.5% 660.6 − 0 × 98.5% Ptheoretical /number of PV strings (Pmeasured /number of PV strings)‐‐nP0 × MPPT tolerance rate 1982/3 660.6 = = 1.5233 (1982/3) − 1 220.2 × 98.5% 660.6 − 220.2 × 98.5% IET Renew. Power Gener. © The Institution of Engineering and Technology 2017
Fig. 9 Perturbation process of the faults in all PV strings
PR min = =
Ptheoretical /number of PV strings (Pmeasured /number of PV strings) − nP0
V theoretical V measured − nV 0 × MPPT tolerance rate 86.1 = = 3.0466 86.1 − 2 28.7 × 98.5%
VR max =
1982/3 660.6 = =3 (1982/3) − 2 220.2 660.6 − 440.4
Appendix 2
(see equation below) VR: VR min =
V theoretical 86.1 = =3 V measured − nV 0 86.1 − 2 28.7
PR max = =
Perturbation process of the faults in all PV strings (Fig. 9):
Ptheoretical /number of PV strings (Pmeasured /number of PV strings)‐‐nP0 × MPPT tolerance rate 1982/3 660.6 = = 3.0466 (1982/3) − 2 220.2 × 98.5% 660.6 − 440.4 × 98.5%
IET Renew. Power Gener. © The Institution of Engineering and Technology 2017
11