1
Software Acoustic Modems for Underwater Sensor Networks Raja Jurdak∗ , Cristina Videira Lopes∗ , and Pedro Aguiar† School of Information and Computer Sciences California Institute for Telecommunications and Information Technology Calit2 University of California, Irvine CA 92697 {rjurdak, lopes} @ics.uci.edu † Institute for Systems and Robotics / IST, Lisboa,Portugal
[email protected]
Abstract— Recent technological improvements and application opportunities have fueled increased interest in the development and deployment of underwater acoustic sensor networks. Deployment efforts have been impeded by the prohibitive monetary cost and high power consumption of existing acoustic hardware. Alternately, we propose underwater networks that rely on widely available speakers and microphones in electronic devices, coupled with software modems, to establish acoustic communication links. The proposed acoustic communications system paves the way for cheap and easily deployable underwater acoustic sensor networks through the use of audio hardware built in to sensor nodes, namely the Tmote Invent modules. In this paper, we explore the potential of the acoustic communication system for both aerial and underwater environments with the generic PC microphone as a receiver and with two transmitter types: (1) generic PC speakers; and (2) Tmote Invent speakers. We follow a systematic experimental approach that first profiles the hardware communication capability in air. We then repeat the profiling in water after waterproofing the components with elastic membranes. Subsequently, our experiments evaluate the data transfer capability of the underwater channel with 8-frequency FSK software modems. The data transfer experiments reveal that within a communication range of 17 m the Tmote Invent speakers can transfer between 6 and 48 bps with respective bit error rates of 5% to 21%.
I. I NTRODUCTION Recent improvements in the processing power, memory size, form factor, and battery consumption of sensor modules have fueled increased interest in the development and deployment of underwater acoustic sensor networks. The diversity in the potential application space for underwater sensor networks, including oil prospecting and seismic monitoring, has led to related projects with a wide range of design requirements [1– 3]. Most underwater acoustic sensor network efforts rely on specialized hardware for modulating, transmitting, receiving and demodulating acoustic signals. The specialized modulation hardware ranges from expensive commercially available acoustic modems [4, 5] to dedicated integrated circuits [1] and dedicated DSP boards [6, 7]. The specialized communication hardware ranges from underwater acoustic transducers and hydrophones [2] to off-the-shelf speakers and microphones [1]. The use of specialized hardware for establishing acoustic communications underwater typically increases the network
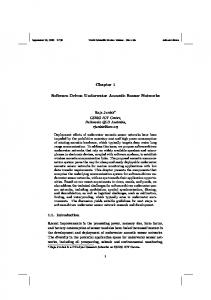
cost, the design time spent in interfacing node hardware components, and the size and weight of individual network nodes. In the past, low processing speeds dictated the use of specialized hardware for underwater acoustic modulation. An alternative approach which overcomes most of the drawbacks of hardware modems is the implementation of acoustic modulation and demodulation in software, as suggested in [8] for aerial acoustics. Recent advances in miniaturization and circuit integration have yielded smaller and more powerful processors that are capable of efficiently running acoustic modulation and demodulation software. The transmission and reception of the software modulated acoustic signal can also avoid using specialized hardware through generic speakers and microphones. Eliminating the need for specialized hardware for acoustic communication greatly reduces the cost of network nodes, facilitating the dense deployment of motes to form underwater acoustic sensor networks. Within this context, the work described in this article is part of a project to deploy a short range shallow water network to monitor pollution indicators in Newport Bay, CA [9] and to provide the data to environmental engineers in near real time. We expect the network to consist of general purpose sensor modules that use software modems and generic hardware to communicate acoustically and send the data to the base station. Figure 1 sheds more light on the target network application. We expect to deploy a considerable number of sensor modules in a shallow water environment. The sensor modules can communicate acoustically through multi-hop links. The modules periodically sample their sensors, collecting physical indicator data such as temperature and salinity data, that can help determine pollution levels in the water. After sampling their sensors, the nodes report their data to a surface node nearby. The surface node, known as the base station, consists of a laptop with a water-immersed acoustic transceiver that communicates with the underwater nodes. The laptop computer is also equipped with a long range wireless broadband communication card that uses the cellular phone network. The laptop will stream the network data towards a central database at UCI, that acts as the main data repository. The collected data will feed into the existing CalSWIM project [10]. CalSWIM is a new watershed information and
2
Interactive Maps
Base station Broadband Radio Connection To Internet
laptop
Simulation and Analysis tools CalSWIM data repository
Surface buoy
Acoustic links
Underwater sensor nodes Query and Download tools
CalSWIM Fig. 1.
Target network application
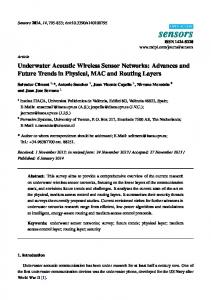
management tool designed both as a public forum for exploring local watersheds and as a location for professionals to acquire data and to interactively model watershed changes. CalSWIM is an ongoing project with the visionary goal of developing a protocol and standard that can be applied to any watershed, facilitating coordinated, integrated, and informed management decisions for those in the water resources profession. Currently, the CalSWIM prototype provides historical data from the Newport Bay watershed of Orange County in southern California. The proposed network deployment will stream near-real time data from Newport Bay into CalSWIM, providing professionals in the water management and research communities with access to sizeable and timely data from the water. For our application, we have selected mote-class computers, which are powerful enough to perform the limited in-network processing and are affordable enough to enable the deployment of a dense network at reasonable cost. In particular, we have selected the Tmote Invent module (shown in Figure 2), from Moteiv Corp. [11], which has an on-board SSM2167 microphone from Analog Devices sensitive to 100Hz to 20kHz, and an on-board TPA0233 speaker amplifier from TI with an 8 ohm speaker that has a range of 400Hz to 20kHz. We intend to exploit the on-board microphone and speaker to establish short range acoustic links among Invent modules. In this paper, we follow a systematic approach to evaluate the acoustic communication potential of the generic hardware. We first explore the principles governing acoustic signal propagation in both aerial and underwater environments. Subsequently, we profile both aerial and underwater environments with the generic PC microphone as a receiver and with two transmitter types: (1) generic PC speakers; and (2) Tmote Invent speakers. For each speaker type, our approach first profiles the hardware communication capability in air. We then repeat the profiling experiments in water after waterproofing
Fig. 2.
The Tmote Invent module
the components with elastic membranes. Based on the underwater profiling results, we derive the theoretical error-free transfer rate of each hardware set when coupled with FSK software modems. To validate the transfer rate derivation, our final set of experiments evaluates the data transfer capability of the underwater channel with 8-frequency FSK software modems. In sum, the main contributions of this article are the following: • Analytical and empirical comparison of the profile of generic acoustic hardware in both aerial and underwater media • Proposal and implementation of a simple FSK software modem for underwater communications that builds on the medium profile results • Projection and validation of the data transfer capabilities of the software modem through underwater experiments The remainder of this paper is organized as follows. Section II discusses the related work on both hardware and software acoustic modems in aerial and underwater environments. Section III presents the basic principles and relationships governing acoustic signal propagation in both air and water. Section V addresses our experiments and results for Tmote
3
hardware and comparable generic hardware for profiling the aerial and underwater media. The resulting medium profile enables the design of a simple FSK modem. We use the modem to evaluate the data transfer characteristics of our acoustic underwater communication system. II. R ELATED W ORK Many applications can benefit from acoustic communications, so several works have considered the modulation of sound in order to transmit information. These works can be broadly classified into 2 categories: (A) hardware modems; and (B) software modems. A. Hardware Modems Earlier efforts in acoustic communication have focused on using specialized and dedicated hardware for sound modulation and demodulation. There are 2 main applications for hardware acoustic modems: (1) phone line modems; and (2) underwater acoustic modems. 1) Phone line modems: Modems originally allowed longdistance point-to-point communication using the voice band in ordinary telephone networks. The first modems were acoustically coupled: a user placed the telephone receiver into a modem handset and the modem sent tones to the telephone. Early acoustic modems transmitted at 300 bits per second. Direct-connect modems, which interface directly with the telephone line, have replaced these acoustic modems. They are less bulky, give a better connection, and avoid the background noise problems of acoustic modems. Modern telephone line modems transmit at bit rates of up to 56 Kbps. 2) Underwater Acoustic Modems: Acoustic underwater communication is a mature field and there are several commercially available underwater acoustic modems [4, 5]. The commercially available acoustic modems provide data rates ranging from 100 bps to about 40 Kbps, and they have an operating range of up to a few km and an operating depth in the range of thousands of meters. The cost of a single commercial underwater acoustic modem is at least a few thousand US dollars. The prohibitive cost of commercial underwater modems has been an obstacle to the wide deployment of dense underwater networks, until the recent development of research versions of hardware acoustic modems. Researchers at the Woods Hole Oceanographic Institution are developing a Utility Acoustic Modem (UAM) as a completely self-contained, autonomous acoustic modem capable of moderate communication rates with low power consumption [7]. This modem uses a single specialized DSP board with on board memory and batteries. The purpose of developing the UAM is to make a more affordable acoustic modem available for the research community. Researchers at UC, Santa Barbara are also developing a hardware acoustic underwater telemetry modem [6] for ecological research applications, using a DSP board with custom amplifiers, matching networks, and transducers. Their modem is intended for interfacing to nodes in an underwater ad hoc network, and it achieves a 133 bps data rate. Whereas both of the efforts reported in [7] and [6] aim at making underwater acoustic modems cheaper and more
accessible by developing specialized affordable hardware, our work aims at driving the cost even lower and at making acoustic underwater communications even more accessible through the development of software acoustic modems that can operate on generic hardware platforms. For example, Vasilescu et al. [1] propose a network that combines acoustic and optical communications, stationary nodes and AUV’s for monitoring coral reefs and fisheries with ranges in the order of hundreds of meters. The work in [1] uses generic microphones and speakers along with a specialized integrated circuit that generates and ASK or FSK modulated sound signal in order to demonstrate the acoustic communication capability underwater. Vasilescu et al. achieve a bit rate in the order of tens of bits per second up to about 10 to 15 meters. Our work resembles their work in the use of generic microphones and speakers for acoustic communications, but our work differs in its implementation of software modems with a generic platform rather than a specialized integrated circuit. B. Software Modems With the rapid increase in processor speeds, the idea of implementing acoustic modems in software became feasible. Coupling software acoustic modems with the use of microphones and speakers for transmission and reception can eliminate the need for specialized hardware for acoustic communication, trading off increased processing activity for reduced node cost. The cost of software acoustic modems is limited to the development cost, after which the per unit cost is zero. Because of these attractive features, researchers have started exploring software acoustic modems for both aerial acoustic communications and underwater acoustic communications. 1) Aerial Software Modems: Lopes and Aguiar [8, 12] have investigated using software modems for aerial acoustic communications in ubiquitous computing applications. Many ubiquitous computing applications can make use of generic microphones and speakers available on many computing devices to communicate through sound, which has some attractive properties for indoor wireless communication. First, unlike radio waves sound rarely penetrates room walls, which reduces interference and promotes privacy. Second, unlike infrared sound does not require a line-of-sight to achieve communication, which is desirable in a indoor environment with many obstacles causing severe multi-path effects. The drawback of using sound for aerial communications is the low bit rate. For example, the achieved bit rate of the aerial acoustic experiments in [8] is in the order of tens of bits per second. However, this low bit rate is quite suitable for many ubicomp applications. 2) Underwater Software Modems: Building on the work on aerial software modems, software acoustic modems can eliminate the need specialized hardware of underwater acoustic communications, thereby encouraging wider deployment of underwater sensor networks. Jurdak et al. [16] have started exploring profiling the underwater acoustic spectrum and data communications capabilities with software acoustic modems. Their work uses waterproofed generic microphones and speak-
4
ers, which are connected to laptops on the surface, for sending and receiving software modulated acoustic signals. They report bit rates in the order of tens of bits per second for distances up to 10 meters. Our work extends their work by implementing software modems on Tmote Invent modules. Since the experiments in [16] used microphones and speakers of comparable specifications to the on-board speakers and microphones on the Tmote module, we expect the underwater acoustic communication capability of autonomous Tmotes to yield similar results. III. F UNDAMENTALS OF ACOUSTICS A. Aerial Acoustics The signal-to-noise ratio (SNR) quality metric at the receiver of an emitted aerial acoustic signal is governed by the following equation: SN Ra = SLa − T La − N La
(1)
where SLa is the source level, T La is the transmission loss, N La is the noise level. All quantities in Equation 1 are in dB relative to the power density level of the threshold of human hearing, which is 10−12 W atts/m2 . 1) Source Level: Typically, the specifications of audio speakers indicate the speaker’s maximum emitted signal power. To obtain the source level SLa of the speaker, we first obtain the signal intensity at 1m from the speaker, assuming that the signal spreading is cylindrical with a unity radius within a distance of 1m from the source: Pt It = (2) 2 × π × 12 where It is expressed in W atts/m2 , and Pt is the transmission power in W atts. The following equation determines the source level SLa relative to the threshold level of human hearing: It SLa = 10 log( −12 ) (3) 10 2) Transmission Loss: The transmission loss of the aerial acoustic signal depends on the surroundings. For example, in an indoor environment, the signal reflects on objects and walls, and the signal is approximated to spread in a cylinder between source and receiver. It is particularly for this reason that the same sound or music heard indoors seems louder than it does outdoors. The signal transmission loss in an indoor environment is expressed as [13]: T La = 10 log(d)
(4)
where d is the distance in meters between the sender and receiver, and T La is expressed in dB. 3) Noise Level: The noise level for aerial indoor acoustic environments results from many factors, including movement of people and objects, vibration and sounds from machines, and occasional noise impulses from the surroundings such as cell phones. In typical indoor environments, the noise sources typically add to the background noise at lower frequencies, suggesting a higher noise level for these frequencies.
B. Underwater Acoustics 1) The Passive Sonar Equation: The passive sonar equation [14] characterizes the signal to noise ratio (SN Ru ) of an emitted underwater signal at the receiver: SN Ru = SL − T Lu − N Lu + DI
(5)
where SL is the source level, T Lu is the underwater transmission loss, N Lu is the noise level, and DI is the directivity index. All the quantities in Equation 5 are typically in dB re µP a, where the reference value of 1 µP a amounts to 0.67 × 10⁻²² W atts/cm2 [14]. However, we will use the same reference for the underwater signal as for the aerial acoustic signal (i.e. the threshold of human hearing at 10−12 W atts/m2 ) in order to compare results more effectively. In the rest of the paper, we use the shorthand notation of dB to signify dB re 10−12 , unless otherwise mentioned. The directivity index DI for our network is zero because we assume omnidirectional hydrophones. Note that this is another conservative assumption, since using a directive hydrophone as described in [17] reduces power consumption. 2) Transmission Loss: The transmitted signal pattern has been modelled in various ways, ranging from a cylindrical pattern to a spherical one. The following expression governs acoustic signals propagation in shallow water [14]: T Lu = 10 × µ log d + αd × 10−3
(6)
where d is the distance between source and receiver in meters, α is the frequency dependent medium absorption coefficient in dB/km, and T L is in dB. The variable µ depends on the signal spreading pattern. If the acoustic signal spreads in all directions from the sound source, then µ is equal to 2. If the acoustic signal signal spreads in a cylindrical pattern from the source (as is the case signals propagating along the surface or ocean floor), then µ equals to 1. In shallow water cases, the value of µ lies somewhere between 1 and 2, depending on the depth. Equation 6 indicates that the transmitted acoustic signal loses energy as it travels through the underwater medium, mainly due to distance dependent attenuation and frequency dependent medium absorbtion. Fisher and Simmons [18] conducted measurements of medium absorbtion in shallow seawater at temperatures of 4o C and 20o C. We derive the average of the two measurements in Equation 7, which expresses the average medium absorption at temperatures between 4o C and 20o C: 0.0601 × f 0.8552 1≤f ≤6 9.7888 × f 1.7885 × 10⁻³ 7 ≤ f ≤ 20 α= (7) 0.3026 × f − 3.7933 20 ≤ f ≤ 35 0.504 × f − 11.2 35 ≤ f ≤ 50 where f is in Khz, and α is in dB/Km. Through Equation 7, we can compute medium absorbtion for any frequency range of interest. We use this value for determining the transmission loss at various internode distances through Equation 6 which enables us to compute the source level in Equation 3 and subsequently to compute the power
5
needed at the transmitter. 3) Source Level: The transmitter source level (SL) of underwater sound relates to signal intensity It , which in turn depends on the transmission power. Given the transmission power Pt , the transmitted intensity of an underwater signal at 1 m from the source can be obtained through the following expression [14]: It =
Pt 2π × 1m × H
(8)
in W atts/m2 , where H is the water depth in m. We can then use It in equation 3 in order to solve for SL. 4) Noise Level: Factors contributing to the noise level N Lu in shallow water networks include waves, shipping traffic, wind level, biological noise, seaquakes and volcanic activity, and the impact of each of these factors on N Lu depends on the particular setting. For instance, shipping activity may dominate noise figures in bays or ports, while water currents are the primary noise source in rivers. In a swimming pool environment, the main sources of underwater noise are swimmers, vibrations from people walking near the pool, and water pumps. IV. I MPLEMENTATION I SSUES The implementation of software acoustic modems for the generic PC hardware is relatively straightforward. The modulated data exists as a wav file at the sender laptop. Data transmission simply involves the playback of the wav file at the sender laptop and the recording of the received signal as wave file at the receiver laptop, where the modulated data is extracted from the signal. In contrast, the implementation of the software modems on Tmote Invent modules involves several resource and configuration challenges. First, the Tmote Invent module has a small fraction of the RAM and storage capacity of current personal computers. The RAM size of current computers is in the order of hundreds of Megabytes, enabling an entire wav file to be loaded into RAM for immediate playback and random access. The Tmote Invent RAM memory size is only 10 KB, so modulated acoustic signals can only be loaded into RAM in small size chunks at a time. For example, consider the playback or recording of a modulated acoustic signal with a sampling frequency of 22050 Hz and 8 bits/sample. The Tmote Invent RAM can store up to 10000/22050=0.4545 seconds of the acoustic signal at a time. Lowering the signal sampling frequency increases the size of the acoustic signal portion that can be loaded into the RAM at one time. Thus, we aim to lower the sampling frequency as much as possible while still providing an acceptable margin above the Nyquist frequency to maintain an acceptable signal quality. Another challenge is the effective streaming of the acoustic signal between the Tmote Invent external flash memory and the Tmote Invent RAM. The Tmote Invent has an external flash memory of 1 MB. Each node can store the modulated wave signal in flash and stream this signal to the RAM when needed. Our implementation uses the Blackbook [29] file system that provides easy access files on the external flash of motes. The streaming of chunks of the audio file from flash to RAM requires the program to open the file on flash, read the
required chunk, and write it to RAM. These functions involve appreciable, yet predictable delay, that is proportional to the size of the data chunk. The flash-related delay complicates the demodulation process since the symbols in the transmitted signals have irregular delays that must be accounted for in the demodulation process. To address this issue, we account for this flash read delay in the demodulation algorithm at the receiver so that the time to decode a symbol actually includes the time to decode the symbol plus the known read delay. Another issue is that the flash read time and the flash write time within Blackbook are not the same, which presents a more involved challenge. Both the read and write time are proportional to the size of data in the read or write operation. Therefore, for a transmitted signal of X bits, the flash read delay is aX seconds. At the receiver, the writing of this signal to flash requires bX seconds, where b is larger a. The Tmote microphone must wait for the flash write operation to complete before capturing the next chunk of the acoustic signal. By the time the microphone turns on again, the sender and receiver lose their synchronization. This mismatch in flash reading and writing causes variable duration symbols. In order to evaluate the Tmote Invent transmission capability prior to solving this flash delay mismatch issue, our experiments involve the Tmote Invent speaker as a sender and the PC microphone as a receiver. Through this setup, the demodulation process at the PC can account for the predictable flash read delay, and the delay mismatch with the Tmote Invent flash write operation is avoided. V. E XPERIMENTAL R ESULTS This section presents the experiments and results relating to two speaker types: generic PC speakers; and Tmote Invent Speakers. The experiments for the PC speakers served as a proof-of-concept prior to our acquisition of the Tmote Invent modules, as well as a baseline for the Tmote Invent results. For each speaker type, we first test the hardware in an aerial environment to assess the response of the speakers in the absence of the waterproofing membrane and the underwater medium. We follow the aerial experiments with underwater medium profiling experiments in which an elastic membrane waterproofs the speakers. The underwater medium profiling results enable the projection of error-free data transfer rates, which we then validate through underwater data transfer experiments. A. PC speakers 1) Aerial Experiments: The first set of experiments profiles the PC speakers in the aerial acoustic channel. In these experiments, we use an IPAQ 5550 [21], with a built-in audio speaker, as the transmitter of the acoustic signal. The signal is then captured by a microphone attached to a desktop PC, where the signal is recorded into a wav file for analysis. We conducted the experiments in a typical office environment with distances ranging from 1 to 7 meters at 2 meter increments. In an earlier study on aerial acoustic communications [22], we had determined that PC speakers and microphones have the best response at frequencies up to about 7 KHz. Building on
6
Fig. 3. Received signal quality of the PC speakers in the indoor aerial channel Fig. 4. Apparent noise level at different frequencies and distances in the indoor aerial environment
that result, we have limited our analysis of the aerial channel profile to the frequency range from 400 Hz to 6700 Hz at 100 Hz increments. Each frequency tone is sent in a square signal for a duration of 1 second, and the full signal consists of a sequence of the square signals separated by guard times. To obtain the signal quality of each frequency fi of a signal received from distance dj meters away, we apply a 100 Hz Equiripple [23] band pass filter centered at fi to the received signal. The filtered signal shape includes the transmitted tone at fi along with all the background noise at within the frequency range fi − 50 to fi + 50. The background noise is distinguishable in all the temporal components of the signal during which the tone at fi is not transmitted. Through this filtering process, we can obtain the signal to noise ratio SN Ra (fi , dj ) of the channel for each frequency fi and distance dj . Figure 3 illustrates the measured SN Ra (fi , dj ) for the various frequencies fi and distances dj in our experiments to profile the aerial channel. The most prominent trend in Figure 3 is that the received signal quality for low frequency tones below 1 Khz is considerably lower than for higher frequencies. In fact, the received signal quality gradually increases with increasing frequency from 400 Hz to 1000 Hz. For frequencies between 1 Khz and 2.5 Khz, the signal quality is generally stable with minor variations among frequencies. The signal quality is highest for frequencies above 2.5 Khz, which confirms our earlier results in [22]. In regards to distance, the signal quality degrades with a trend following the expected signal attenuation in most cases. The cases in which the received signal quality does not adhere to the attenuation can be attributed to multi-path effects (such as reverberation) and varying exposure to noise sources at the different distances. We can use the measured SN Ra (fi , dj ) values to obtain the observed N La (fi , dj ) values for each frequency fi and distance dj in the indoor aerial acoustic channel. The audio speakers of the IPAQ 5550 are 2-watt audio speakers, so the
maximum audio transmission power Pt is 2 Watts. Through equation 2, the corresponding acoustic signal intensity is 0.3183 W atts/m2 . Subsequently, the source level SLa of the IPAQ acoustic signal is obtained from equation 3 to be 10.5029 dB. For the remainder of this analysis, we assume that SLa is uniform at 10.5029 dB across frequencies in our spectrum from 400 Hz to 6700 Hz. 1 Having determined SLa and SN Ra (fi , dj ) for each (fi , dj ) pair, we still need to obtain the transmission loss for T La (fi , dj ) in order to compute N L(fi , dj ) from equation 1. We can simply plug in the distance value dj in equation 4 to obtain T La (fi , dj ). As a result, we can obtain the apparent noise level N La (fi , dj ) for all distances and frequencies, shown in Figure 4. According to Figure 4, the apparent noise level in the indoor acoustic channel is higher for frequencies between 400 Hz and 1000 Khz. The higher apparent noise level at low frequencies is due to interference from electronic devices, such as computers, monitors, printers in the form of white noise. Also, the movement of people and objects creates transient noise impulses at low frequencies. For some frequencies in Figure 4, the apparent noise level seems to decrease as the distance between the sender and receiver increases. This is probably explained by the severe multi-path propagation of the acoustic signal indoors which causes a larger portion of the signal to arrive at the receiver than in the cylindrical spreading case. As such, the expression for T La overestimates the transmission loss. The effect of this overestimation of T La becomes more apparent at larger distances, causing the model to attribute less of the signal quality degradation to background noise. 2) Underwater Experiments: The experiments in this section explore the underwater acoustic communication capability 1 We need to make this assumption since the IPAQ specifications do not provide the frequency response of the speakers. In the subsequent discussion, we comment on the effect of this assumption on the results.
7
of the system comprising the generic PC speakers as the transmitter and the generic PC microphone as a receiver. We have selected Sony SRS-P7 [24] PC speakers and Labtec PC microphone [25], both of which are cheap offthe-shelf components. In order to waterproof the speakers and microphones and still maintain most of their acoustic properties, we have placed each of them inside vinyl membrane containers. We sealed the vinyl containers around the wires of the components with electric tape to prevent water leakages into the components. For our experiments, we used two laptops, with one laptop attached to the speakers acting as a sender, and another attached to the microphone acting as a receiver. The microphone and speakers are placed inside a controlled water environment at a depth of about 50 cm, while the wires and the laptops remained outside the water. To test our design for simple FSK modulation and demodulation, we conducted two sets of underwater experiments: (1) experiments to profile the medium’s frequency response; and (2) experiments to evaluate data transmission capability. Our application has unique channel characteristics that differ from underwater channels that appear in the related literature [3, 14, 26, 27]. First, our channel is not limited to the underwater medium. Our channel also includes the generic speakers and microphone, whose response and coupling with the underwater environment is unknown. In addition, our channel includes the vinyl membranes which may amplify or attenuate certain frequencies. We have performed experiments to assess the frequency profile of the channel. As in the aerial acoustic experiments above, we use SN Ru as the quality indicator of the received signal. We also profile the medium through the same signal and SNR calculation method as in the case of the aerial channel. We performed the underwater experiments for distances dj ranging from 1 m to 10 m at 1m increments. At each distance dj , we conducted the measurements three times and obtained the average SN Ru (fi , dj ) of the three samples for fi . Figure 5 shows the SN Ru (fi , dj ) results for each frequency fi at each distance dj . The solid plot in Figure 5 represents the measured SNR. In order to better understand the signal interaction, we also computed the expected SNR through the following method. Let the (fm , dn ) be the frequency and distance pair with the highest received SNR. We can use the transmission power Pt of the speakers to obtain It through equation 8. We can then compute the source level SL through equation 3. We can also get the transmission loss T Lu (fm , dn ) through equation 6 with a value of µ equals to 1.5, which is suitable for a shallow water setting. Finally, we can obtain the noise level N L(fm , dn ) through equation 5. To determine the expected SNR, we assume that NL for all frequencies and distances is uniform and equal to N L(fm , dn ). We can then obtain the expected SN R(fi , dj ) for all frequencies by simply using equation 5. The transparent plot in Figure 5 represents the expected SNR. It is obvious from the figure that low frequency signals have a similar SNR value as the expected case, whereas there is an increasing gap between the expected and measure SNR values as the frequency increases. Along the distance axis, the SNR of
Fig. 5. Profile of the underwater channel with the PC speakers: The solid plot represents the measured SNR and the transparent plot represents the expected SNR
lower frequency signals closely follows the T Lu model with a µ value of 1.5, whereas this trend also becomes less evident at higher frequencies. To explore these interactions further, we focus our discussion on the measured SNR plot. The first observation is that for all distances, lower frequencies in general had a higher signal quality than higher frequencies. In particular, SN Ru is too low to distinguish the signals from noise for frequencies above 3Khz. Through the analysis in section V-A.1, we know that speakers of this size do not exhibit degraded performance with the frequency range from 3 Khz to 7 Khz. As such, we can rule out the speaker hardware as a cause for the low quality of the received signal in this frequency range. The two other possible causes for this signal quality degradation are: the presence of higher background noise in the frequency range between 3 and 7 Khz; and the poor vibration properties of the encompassing vinyl membrane for these frequencies (yielding a lower SL). Another interesting observation is the frequency selectivity of this particular channel. For example, the experiments for most distances yielded a higher SNR for the frequency of 1400 Hz than at 1100 Hz. This is probably due to the speaker and microphone design, to higher ambient noise at certain frequencies, or to the vinyl membranes, which might resonate at some frequencies better than others. In the next section, we investigate more latex membranes that exhibit more favorable acoustic communication properties. In addition to profiling the channel frequency response, the results in Figure 5 also provide insight into the software modem design. Depending on our target SNR ratio for the network, we can determine the number of frequencies that can be used for reliable communication. For instance, the plot for all distances up to 9 m have at least 8 frequencies with an SNR of more than 5 dB, so the software modem can use an 8-frequency FSK scheme for data transmission for distances of up to 9 m without violating the signal quality requirement. Prior to conducting data communication experiments, we
35
120.00%
30
100.00%
12 bps Symbols received
Expected Channel Capacity (bps)
8
25 20 15 10 5
24 bps
48 bps
96 bps
80.00% 60.00% 40.00% 20.00%
0 1m 2m
3m
4m
5m 6m Distance
7m
8m
9m 10m
Fig. 6. The channel capacity computed from the measured SN R, as a function of distance
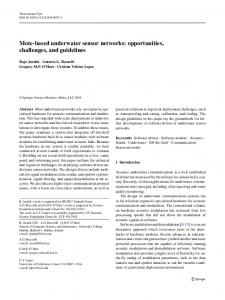
can compute the achievable error-free bit rate C for each communication distance using the Shannon-Hartley expression [28]: C = Blog2 (1 + SN R) bps (9) where B is the bandwidth of the channel. In our case, the digital channel bandwidth is 8 discrete frequencies, so B is equal to 8. By plugging in the measured SN R for the lowest quality frequency of our software modem, we can compute the expected channel capacity for each distance di , shown in Figure 6. The expected error-free channel capacity drops steadily from about 30 bps at 1m to 10 bps at 10m. The expected channel capacity seems to be lowest for distances of 6m and 7m, which is most likely due to the specific conditions and environment in which the profiling experiments were performed. In our software modem design and experiments, we choose to explore bit rates that exceed the expected channel capacity within a system that is tolerant of some communication errors. Our software modem is based on a structure of time slots. Each time slot of length T milliseconds contains one FSK symbol, which has a duration of T /2 milliseconds, in addition to a guard time of T /2 milliseconds. Guard times between adjacent FSK symbols are necessary to avoid intersymbol interference which may arise as a result of multi-path propagation effects. To evaluate the impact of the length of the time slot on the data reception capability at different distances, we consider 4 cases for the time slot lengths: (1) 250 ms; (2) 125 ms; (3) 62.5 ms; and (4) 31.25 ms. The above time slot lengths correspond to data bit rates of 12, 24, 48, and 96 bits per second respectively. Figure 7 plots the percentage of correctly received FSK symbols at different distances and bit rates. The experiments for a separation distance of 1m between the transmitter and receiver serve as a benchmark for other experiments, since most of the transmitted energy is captured by the receiver. For a distance of 1m, all the transmitted symbols are correctly decoded at the receiver for bit rates of 12, 24, and 48 bits per second. The perfect decoding of the 48bps stream exceeds the expected channel capacity at 1m. For the higher bit rate of 96bps, the receiver could not decode a significant portion signal. The 1m experiments indicate that the generic speaker
0.00% 1m 2m
3m
4m
5m 6m 7m Distance
8m
9m 10m
Fig. 7. Observed data reception capability at different distances and bit rates
and microphone pair may be capable of supporting a software modem with a bit rate of up to 48 bps. The experiment results for larger separation distances exhibit distinct patterns for each bit rate. The successful symbol decoding rate for the 12bps modem ranges between 90% and 100% for distances up to 10m. There is no apparent effect of distance on the successful symbol reception and demodulation rate for the 12bps modem. This confirms the expected channel capacity results, in which the achievable bit rate is above 12bps for most distance and slightly lower than 12bps for other distances. For the 24bps modem, the successful symbol decoding rate drops to about 92% at 2m, and it ranges between 78% and 97% for distance between 3m and 10m. The variation in successful decoding rate for different distance seems to be random rather than distant-dependant, and it possibly depends on the experiment setup. Underwater medium profile results for the PC speakers help justify the lack of dependance of the decoding success rate on distance. Because the 8 frequencies used in the FSK have SN R above 5 dB for distances up to 9m, this SN R is sufficiently high for the reception and decoding of 12bps and 24bps signals. Higher bit rate modems require a higher SN R at the receiver to successfully decode all symbols. The successful decoding rate at the receiver for the 48bps modem degrades significantly for distance above 1m. The decoding rate is 75% for 2m, 67% for 3m, and much lower for 4m and higher distances. Because the threshold SN R for successful decoding is higher for this modem, the decoding ability, like the underwater SN R results, is highly dependent on distance up until 3m, after which no significant portion of the signal can be decoded. In sum, the 12bps and 24bps software modems exhibit successful decoding rates of 90% and 80% respectively for distances up to 10m. The 48bps modem has a highly distance dependent decoding ability within its usable range of 3m. B. Tmote Invent Speakers 1) Aerial Experiments: The next set of experiments profiles the Tmote Invent speakers in the aerial acoustic channel. In these experiments, we use a Tmote Invent module, with a
9
Fig. 8. Received signal quality for the Tmote Invent speakers in the indoor aerial channel
built-in audio speaker, as the transmitter of the acoustic signal. The signal is then captured by a microphone attached to a laptop PC, where the signal is recorded into a wav file for analysis. We conducted the experiments in a typical office environment with distances ranging from 1 to 7 meters at 1 meter increments. Because the underwater experiments for the comparable PC speakers had the best response for the lower frequencies, we conduct the experiments for the Tmote Invent speakers for frequencies ranging from 400 to 3500 Hz. Figure 8 plots the measured SN Ra (fi , dj ) for the various frequencies fi and distances dj in our experiments to profile Tmote Invent speakers for the aerial channel. As in the case of the PC speakers, the received signal quality for low frequency tones below 1 Khz is considerably lower than for higher frequencies. The low signal quality at the receiver for the lower frequencies stems from the higher interference at these frequencies in an indoor environment. For frequencies above 800 Hz, the SNR is generally higher and more stable, with minor variations due to reverberation, multi-path effects, and hardware properties. 2) Underwater Experiments: The next set of experiments profiles the Tmote Invent speakers for underwater acoustic communication. As in the underwater experiments for the generic speakers, we use SN Ru as the quality indicator of the received signal. Following the experiments with the generic speakers, our recent tests have determined that thinner and more elastic latex membranes outperform vinyl membranes in preserving the signal acoustic properties underwater. Thus, we waterproof the Tmote Invent modules with latex membranes for this experiment set, keeping in mind that the change in waterproofing membrane may contribute to the differences between the results for the experiments with the Tmote Invent module and the generic speakers. Because the latex membranes provide better performance, we expect an improvement in signal quality and data transmission capability for the latex membranes. Thus, we conduct the Tmote Invent profiling
experiments for an expanded distance range, between 1 m and 13 m at 1 m increments. The Tmote Invent underwater profiling experiments are conducted for frequencies between 400 Hz and 3500 Hz, as in the case for the Tmote Invent aerial experiments. Figure 9 illustrates the Tmote Invent measured and theoretical SN Ru (fi , dj ) values for each frequency fi at each distance dj . The solid plot in Figure 9 represents the measured SNR. The transparent plot shows the theoretical SNR, computed with the method described in Section V-A.2. The first observation on Figure 9 is the relative closeness of the measured and theoretical SNR values, when compared to the results for the PC speakers. This observation confirms that the latex membranes vibrates better to preserve the acoustic properties as the signal travels from the speakers through the membrane and into the underwater medium. The second observation on Figure 9 is that the measured SNR for certain frequencies between 1000 and 2000 Hz, such as 1300 Hz and 1500 Hz, is higher than the projected SNR for those frequencies. This effect is a reflection of the choice of 1.5 for the µ variable for the computation of the transmission loss. The higher values of the measured SNR indicate that the signal spreading for these particular frequencies is closer to the cylindrical model than the spherical model, highlighting favorable multi-path and reflection effects for these frequencies in the closed testing environment. The final observation on Figure 9 is the frequency selective behavior of the channel (consisting of the Tmote Invent speaker, latex membranes, underwater medium, and PC microphone). Based on this frequency selectivity, the software acoustic modem can use the following 8 frequencies that exhibit the highest signal quality at all distances: 1000, 1200, 1300, 1500, 1600, 1700, 1800, and 2000 Hz. The minimum SN Ru for all of these frequencies within a range of 13 m is 6.95 dB. It is worth noting that only one of the above frequencies, 1300 Hz, is common with the top 8 frequencies for the PC speakers. We attribute this difference to the difference in waterproofing membranes, as well as the potential hardware differences of the two speakers. Based on the measured SNR of the selected frequencies of the software modem, we can project the achievable errorfree bitrate of the Tmote Invent speakers, through the method discussed in Section V-A.2. Figure 10 illustrates the projected error-free bitrate of the Tmote Invent speakers. For all distances up to 13 m, the measured SNR indicates that the speakers can support an error-free bitrate of at least 24 bps. The trend in Figure 10 is also less dependent on distance that Figure 6. The final set of experiments directly evaluates the data transmission capability of the Tmote Invent speakers. The encouraging results of the Tmote Invent medium profiling experiments (mainly the reduced dependence of signal loss on distance) have motivated the expansion of the range of the data transmission experiments to 17 m. Other lessons from both the PC speaker experiments and the data rate projections are the poor performance of the 96 bps signal and the possibility for adaptive fidelity data transmission. Thus, we conduct the data transmission experiments for the Tmote Invent speakers for 4
10
6bps
12bps
24bps
48bps
Symbols Received (%)
100 95 90 85 80 75 1 2 3 4 5 6 7 8 9 10 11 12 13 14 15 16 17 Distance (m)
Fig. 11. Percentage of symbols correctly received for the Tmote Invent speakers in the underwater environment
Fig. 9. Profile of the underwater channel with the Tmote Invent speakers: The solid plot represents the measured SNR and the transparent plot represents the expected SNR
40 35
6
12
24
48
96
≥95%
≥90%
≥81%
≥79%
N/A
N/A
≥90%
≥78%
≥35%
≥10%
TABLE I C OMPARISON OF THE PERCENTAGE OF SYMBOLS CORRECTLY RECEIVED FOR THE PC SPEAKERS AND T MOTE I NVENT EXPERIMENTS
30 Bitrate (bps)
Transfer rate (bps) Tmote+ Latex mem. Up to 17m Generic+ Vinyl mem. Up to 10m
25 20 15 10
VI. D ISCUSSION
5
The empirical results from the study serve as a proofof-concept for underwater communication through generic acoustic hardware and software modems with data rates in the order of tens of bits per second. It is worth noting that the communication range of 17 m in this study is a limitation of the available physical space and not a technical communication limitation. An interesting direction for future work is to push the technology further to evaluate the maximum achievable communication and detection ranges, and the associated data transfer rates. The current implementation of our communication system, which relies on the Tmote Invent speakers as transmitters, and a generic PC microphone as receiver, enables the deployment of a single-hop network centered at the base station with a theoretical circular shape and a radius of at least 17 m. The Tmote Invent modules send their data through direct acoustic links to the base station, forming a cluster of underwater Tmote modules that provides granular environmental data within the coverage area. The deployment of several clusters of these 1-hop networks enables monitoring of wider geographical regions, and all data can be collected at a central data repository. Such a topology is especially useful for pinpointing the propagation areas of oil patches in the aftermath of oil spills, such as the catastrophic oil spill resulting from the recent hostilities in Lebanon. The achievable bit rate of our system, in the order of tens of
0 1
2
3
4
5
6 7 8 9 Distance (m)
10 11 12 13
Fig. 10. Error-free bitrate of Tmote Invent Speakers in the underwater environment
different bit rates: 6 bps, 12 bps, 24 bps, and 48 bps. Figure 11 shows the percentage of symbols correctly received with the Tmote Invent speakers. For all bit rates in the experiments, the receiver could decode at least 79% of the transmitted symbols. Also, the decoding capability of the receiver with the Tmote Invent speaker is as good as or better than the PC speaker experiments, as Table I reveals. This is especially true for the signal with a bit rate of 48 bps, where the signal decoding capability improves from 35% to 79%. For data transfer rates of 12 and 24 bps, the percentage of correctly received symbols is about the same for the Tmote Invent and the PC speaker experiments. However, we note that the Tmote Invent speaker with the latex membrane provides the same data transmission capability at 17 m as the PC speakers with the vinyl membrane at 10 m. Again, this highlights the superior performance of the latex membrane to the vinyl membrane as a waterproofing solution for our application.
11
bits per second, is sufficient for monitoring sensor networks, such as for environmental or habitat monitoring. In monitoring networks, the nodes sample their sensors and send the data once during each update period, typically in the order of minutes. Since each node must send only a handful of sensor values during each update period, a data transfer rate in the order of tens of bits per second provides more than enough throughput to communicate all the sensor values during an update period. The communication system described in this paper advocates the use of short multi-hop links for deploying dense underwater sensor networks. The multi-hop topology of our network aims at limiting disruption to marine wildlife. Sending sound waves underwater has implications for the marine wildlife, such as whales and dolphins. Recently, there have been 13 incidents in which whales or dolphins were disoriented and stranded because of marine sound emitting devices such as sonar, oil exploration, and shipping [30]. Avoiding adverse effects on marine biology is a major consideration for environmental preservation. Because our network relies on multi-hop short range low power links between sensor nodes, our network minimizes sound interference with the marine life. Our proposed network’s multi-hop topology also reduces the network deployment cost. Most existing underwater modems and transceivers are expensive and they are intended for deep long-range communication links. The high cost of existing underwater communication hardware imposes having underwater networks with few nodes and thus a low spatial density. Because the cost of our system is limited to the relatively cheap sensor module, we expect the system to promote wider deployments of underwater sensor networks. ACKNOWLEDGEMENT The authors would like to thank Aude Bernard for her instrumental assistance in the underwater experiments. R EFERENCES [1] I. Vasilescu, K. Kotay, D. Rus, M. Dunbabin and P. Corke. “Data Collection, Storage, and Retrieval with an Underwater Sensor Network,” In Proc. Sensys’ 05, San Diego, CA, 2005. [2] J. Heidemann, Y. Li, A. Syed, J. Wills, and W. Ye. “Underwater Sensor Networking: Research Challenges and Potential Applications,” USC/ISI Technical Report ISI-TR-2005-603, 2005. [3] X. Yang et al. Design of a Wireless Sensor Network for Longterm, In-Situ Monitoring of an Aqueous Environment. Sensors, 2:455-472, 2002. [4] Linkquest Inc. available: www.link-quest.com [5] DSPComm. available: www.dspcomm.com [6] R. A. Iltis, H. Lee, R. Kastner, D. Doonan, T. Fu, R. Moore and M. Chin. “An Underwater Acoustic Telemetry Modem for Eco-Sensing,” In proc. MTS/IEEE Oceans’05, September 2005. [7] Utility Acoustic Modem available: auvlab.mit.edu [8] C. V. Lopes and P. Aguiar. “Acoustic Modems for Ubiquitous Computing,” IEEE Pervasive Computing, Mobile and Ubiquitous Systems, Summer 2003. [9] R. Jurdak, C. V. Lopes and P. Baldi. “Battery Lifetime Estimation and Optimization for Underwater Sensor Networks,” Sensor Network Operations, Wiley-IEEE Press, May, 2006. pp. 397-420. [10] California Sustainable Wetland/Watershed Information Manager. available: www.calswim.net [11] MoteIV Corporation www.moteiv.com [12] C. Lopes and P. Aguiar. “Aerial Acoustic Communications,” In Proc. IEEE Workshop on Applications of Signal Processing in Audio and Acoustics (WASPPA’2001). New Paltz, NY. Oct. 2001.
[13] Blauert, Jens (Ed.) Communication Acoustics. Springer, 2005, ISBN: 3-540-22162-X [14] R. J. Urick. Principles of Underwater Sound. Mcgraw-Hill, 1983. [15] J. Groen, J.C. Sabel and A. Htet. Synthetic aperture processing techniques applied to rail experiments with a mine hunting sonar. In Proc. UDT Europe, 2001. [16] R. Jurdak, C.V. Lopes, and P. Baldi. “Design of a Short Range Shallow Water Sensor Network Using Motes,” In Proc. of IEEE Oceans Asia Pacific. Singapore. May, 2006. [17] N. Fruehauf and J.A. Rice. System design aspects of a steerable directional acoustic communications transducer for autonomous undersea systems. In OCEANS, volume 1, pages 565 –573. IEEE, 2000. [18] F. H. Fisher and V. P. Simmons. “Sound Absorption in Sea Water,” Journal of Acoustical Society of America, 62:558, 1977. [19] S. A. L. Glegg, R. Pirie, and A. LaVigne. A study of ambient noise in shallow water, available:http://www.oe.fau.edu/ acoustics/. [20] F. H. Fisher. “Effect of High Pressure on Sound Absorption and Chemical Equilibrium,” Journal of Acoustical Society of America, 30:442, 1958. [21] HP iPAQ h5550 Pocket PC. available: www.hp.com [22] R. Jurdak, C.V. Lopes, and P. Baldi. “An Acoustic Identification Scheme of Location Systems,” In Proc. ICPS’04, Beirut, Lebanon. 2004. [23] Cetin, A.E. Gerek, O.N. Yardimci, Y. “Equiripple FIR filter design by the FFT algorithm,” In IEEE Signal Processing Magazine, 14(2):60–64, 1997. [24] Sony SRS-P7 PC speakers. available: www.sony.com [25] Labtec PC microphone. available: www.labtec.com [26] M. Stojanovic. Recent advances in high speed underwater acoustic communications. Oceanic Engineering, 21(4):125–36, 1996. [27] P. Chapman, D. Wills, G. Brookes, and P. Stevens. Visualizing Underwater Environments Using Multi-frequency Sonar. In IEEE Computer Graphics and Applications, 1999. [28] C. E. Shannon. “A mathematical theory of communication,” Bell System Technical Journal, volume 27, pp. 379-423 and 623-656, July and October, 1948. [29] Rincon Research Corporation. BlackBook. available: Tinyos CVS tree tinyos-1.x/contrib/rincon/tools/java/com/rincon/blackbook [30] R. Black. “Research Needed on Marine Sound,” BBC News article, available: news.bbc.co.uk/2/hi/science/nature/4706670.stm