conducted in the 1970s and 1980s, but are coming back with custom-made ..... on it Advantages: You get the contract Disadvantages: The probability that the ...
Volume 3, Issue 6, June 2013
ISSN: 2277 128X
International Journal of Advanced Research in Computer Science and Software Engineering Research Paper Available online at: www.ijarcsse.com
Software Development Effort Estimation: A Review Amit Sinhal , Bhupendra Verma Dept. of Computer Sc. & Engg. Technocrats Institute of Technology, Bhopal, India Abstract— Software development effort estimation is the process of calculating the effort required to develop or maintain software based on the input, which is partial, tentative and/or strident. Efficient project estimation is one of the most difficult and significant activities in project development. “Effort Estimation” is supposed to be fateful because of infrequency, uniqueness, underestimation bias and different goals. Effort estimates may be useful as input to software development plans, repatriation plans, finances, and asset analyses, setting a price and bidding rounds. However, the measurement of estimation effort is a very tedious task. This paper provides a general overview of software effort estimation methods including the recent advances in the field. The aim of this paper is to explain all the existing effort estimation methods and the recent estimation techniques in the area of software development. The primary conclusion is that no single technique is best for all circumstances, and that a vigilant evaluation of the outcomes of several approaches is most likely to produce realistic estimates. Keywords— COCOMO, Wideband Delphi, Function Point, Fuzzy Logic, Genetic Programming I. INTRODUCTION Software researchers and academics have been addressing the problems of effort estimates for software development projects since last five decades. The majority of the research is paying attention on the creation of formal software effort estimation methods. The earliest representations were usually based on regression analysis or parametric methods [1, 2, 3]. Since then a high number of models forming techniques have been assessed, such as approaches initiated on Bayesian statistics, casebased reasoning, simulation, classification and regression trees, lexical analysis of requirement specifications, neural networks, fuzzy logic modelling, genetic programming, linear programming, statistical bootstrapping, economic production models, and grouping of two or more of these models [4, 5, 6, 7]. The possibly most common estimation products nowadays, e.g., the formal assessment models SLIM and COCOMO had their basis in estimation research carried out in the 1970s and 1980s. The estimation techniques based on functionality-based measure, e.g., Function points, is also based on research conducted in the 1970s and 1980s, but are coming back with custom-made size measures under various labels, such as ―use case points‖[1] in the 1990s and COSMIC in the 2000s. Our work is organized in five subsections. In the subsequent section, a definition of effort estimation techniques in different categories are used in the context of this paper is provided. The third section reviews mainly on the existing effort estimation techniques, which are consequently compared, discussed and summarized in section four. In the fifth section, the publication concludes with final remarks. A. Categories of Estimation Methods There are many techniques to classify estimation approaches. The top-level classes are as follows: Expert estimation: It is a quantification step, i.e., the step where the assessment is formed based on judgmental processes. Formal estimation model: It is based on mechanical processes, e.g., the use of a parametric rule as a derivative from historical data. Hybrid estimation Model: This step is based on a judgment or mechanical grouping of estimates from various sources. The evidence of differences in estimation accuracy of different estimation approaches and models suggests that there is no ―best approach‖ and that the relative accuracy of one approach or model in comparison to another depends strongly on the environment. This means that different organization benefits from different estimation approaches. Findings, reviewed in, that may carry the choice of an estimation approach based on the expected correctness of an approach include: Expert estimation is at least as precise as model-based effort evaluation normally. Specifically, conditions with unbalanced relationships and information of high significance not included in the model may recommend use of expert estimation. This supposes that experts with relevant experience are available. Formal estimation models are not modified to a particular organization‘s own background may be very imprecise. Use of individual historical data is therefore critical if one cannot be sure that the estimation model‘s core relationships (e.g., formula parameters) are based on related project contexts. © 2013, IJARCSSE All Rights Reserved
Page | 1120
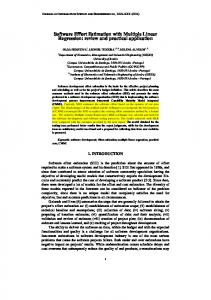
Sinhal et al., International Journal of Advanced Research in Computer Science and Software Engineering 3(6), June - 2013, pp. 1120-1135 Formal estimation models might be generally useful in situations where the model is customized to the organization‘s environment (either through use of own historical data or that the model is derived from analogous projects and contexts), and/or it is likely that the experts‘ estimates will be subject to a powerful degree of wisely thinking. The most robust finding, in many predicting domains, is that grouping of estimates from autonomous sources, preferable applying dissimilar approaches, will on average increase the estimation accuracy [2] [3] [4]. Additionally, other features such as ease of understanding and discussing the results of a method, ease of use of a method, the cost of the introduction of a method should be taken into account in a selection process. The most common measures of the average estimation accuracy are the MMRE (Mean Magnitude of Relative Error), where Magnitude of Relative Error MRE is: MRE = |actual effort − estimated effort| / |actual effort| This measure has been criticized [5] [6] [7] and there are several substitute measures, such as symmetric measures, Mean Variation from Estimate (MVFE) and Weighted Mean of Quartiles of relative errors (WMQ) [8] [9]. There are a lot of psychological factors potentially representing the strong tendency towards over-optimistic effort estimates that need to be dealt with to increase accuracy of effort estimation. These features are essential even when using formal estimation models, as a lot of the input to these models is judgment-based. Features that have been established to be important are: Wishful thinking, planning fallacy, anchoring and cognitive dissonance. B. Effort Estimation Techniques There are many techniques for Software effort estimation. Figure 1 shows the spectrum of Effort Estimation Techniques; broadly it can be classified in the following category: 1) Traditional Estimation Methods: Heuristic or Expert judgments Techniques Parametric or Algorithmic Techniques Regression Techniques 2) Recent Estimation Methods: Analogy Techniques Soft Computing Techniques
Fig. 1: Spectrum of Effort Estimation Techniques II. TRADITIONAL EFFORT ESTIMATION METHODS 2.1 Heuristic or Expert judgments Techniques 2.1.1 Expert Judgment Expert judgment engages consulting with human experts to use their knowledge and experience of a proposed project to give an estimation of the cost of the project. The obvious advantage of this method is the expert can factor in differences between past project experiences and requirements of the proposed project. The expert can also factor in project impacts caused by new technologies, applications, and languages. Expert judgment always compliments other estimation methodologies. One disadvantage is that the estimates can be no better than the expertise and judgment of the expert. It is also hard to document the factors used by the expert who contributed to the estimate. Expert judgment methods engage checking with software cost estimation expert or a group of the experts to use their © 2013, IJARCSSE All Rights Reserved
Page | 1121
Sinhal et al., International Journal of Advanced Research in Computer Science and Software Engineering 3(6), June - 2013, pp. 1120-1135 experience and understanding of the proposed project to arrive at an estimate of its cost. Expert judgment is made based on experience either just by a project manager or by a team of experts involved in the project. Process iterates until some consensus is reached. It works well in situations where no historical data is available. For estimation accuracy industry data can be used as a reference. Very small growing organizations often make use of this technique; however, irrespective of the size or maturity of a software house, expert judgment is the widely used method in the Industry. Several variations are adopted under expert estimation like it can be done in a group of experts of different domains belonging to the same or different projects. 2.1.2 Delphi Technique Delphi is a consensus-based effort estimation technique that involves experts from estimation, software development techniques and application domain. A team of 3 to 7 members constituted with a moderator. The estimation process conducts first kickoff meeting where the estimation team creates a work breakdown structure, discusses list of assumptions and after the meeting, every team member initiates effort estimation for each task. Then, in an estimation session, the team revises the estimates as a group & achieves consensus. The ―Wideband Delphi‖ developed by Barry Boehm and John A. Farquhar and considered as better compared to Delphi. It incorporates greater interaction and more communication between participants. The limitation of Delphi is that it depends on requiring management cooperation, agreement among team members, and it depends on expertise of team members. This technique takes long time and considerable effort to complete. The advantages of Delphi are that it's a simple process; assumptions are documented, discussed and agreed on, and finally resulted with a more accurate estimation compared to individual estimation. Generally speaking, a group consensus method, Delphi method, is the best approach to be used. To give a suitably broad communication bandwidth for the experts to exchange the volume of information necessary to calibrate their estimates with those of the other experts, a wideband Delphi technique is introduced over standard Delphi technique. 2.1.3 Wideband Delphi Wideband Delphi Technique was introduced at Rand Corporation, later refined by Barry Boehm [10]. The technique can help you estimate, plan and schedule almost anything. In wide band Delphi method a one to one interaction is there among the group members (experts) as opposite to Delphi technique. Here the conflicts if any are resolved face to face till a mutually agreed decision point is reached. Lots of overhead involves (time, team involvement, planning) for relatively small sets of tasks. However its strength lies in iterative, team based and collaborative meeting. It is comprised of 6 steps: 1. Planning 2. Kickoff meeting 3. Individual preparation 4. Estimation meeting 5. Assembling tasks 6. Reviewing results & iteration The wideband Delphi Technique has subsequently been used in a number of studies and cost estimation actions. It has been extremely successful in combining the free discuss advantages of the group meeting technique and advantage of anonymous estimation of the standard Delphi Technique. The advantages of this method are: The experts can factor in differences between the past project experience and the requirements of the proposed project. The experts can factor in project impacts caused by new technologies, applications, architectures and languages involved in the future project and can also factor in exceptional personal characteristics and interface, etc. The disadvantages include: This method cannot be quantified. It is hard to document the factors used by the experts or experts-group. The expert may be some optimistic, pessimistic or biased, even though they have been decreased by the group consensus. The expert judgment technique always compliments the other cost estimating method such as algorithmic method. It is a consensus-based technique for effort estimation. It originates from the Delphi Method that was developed at the RAND Corporation in the 1940s as a forecasting tool. It has since been adopted across many industries to estimate many kinds of projects, series from statistical results in marketing and sales prediction. The Wideband variant of the Delphi method was originated by Boehm et. al. in the 1970s. They called it "wideband" as, match up to the existing Delphi method, the new process concerned greater communication and more interaction between participants. The method was well liked by Boehm's book Software Engineering Economics (1981). Boehm's original steps from this book were: i. The coordinator provides each specialist with a specification and an estimating form. ii. The coordinator arranges an assembly in which the experts talk about estimation issues with the each other and © 2013, IJARCSSE All Rights Reserved
Page | 1122
iii. iv. v. vi.
Sinhal et al., International Journal of Advanced Research in Computer Science and Software Engineering 3(6), June - 2013, pp. 1120-1135 coordinator. Experts fill out forms anonymously The coordinator gets ready and dispenses a synopsis of the estimation on an iteration form. The coordinator calls a group meeting; especially focusing on being the experts discussing points where their estimates varied widely. Experts fill out forms, once more anonymously, and steps iv and vi are repeated for as several rounds as appropriate.
2.1.4 Planning Poker Planning Poker, also called Scrum poker, is a consensus-based method for estimating, commonly used to predict effort or approximate size of tasks in project development. It is a variant of the Wide band Delphi method. It is most frequently used in the agile project development, especially in the Extreme Programming methodology. The technique was originally described by James Grenning [11] in 2002 and later popularized by Mike Cohn in the book Agile Estimating and Planning [12]. Planning Poker is based on a list of features to be delivered and several copies of a deck of numbered cards. The feature catalog, often a list of customer stories, explains some software that wants to be developed. The cards in the deck have numbers on them. A classic deck has cards showing the Fibonacci series: 0, 1, 2, 3, 5, 8, 13, 21, 34, 55, 89; further decks use same progressions. The reason for using the Fibonacci sequence is to reflect the inherent uncertainty in estimating larger items. One commercially available deck uses the series: 0, ½, 1, 2, 3, 5, 8, 13, 20, 40, and 100. Some groups use typical playing cards of Ace, 2, 3, 5, 8 and King. Was King intended: "this piece is too large or too complex to estimate?" "Throwing a King" ends the debate on the item for the present sprint. Optionally, an egg timer can be accustomed to limit the time spent in conversation of each item. 2.1.5 Parkinson’s Law Cyril Northcote Parkinson [13], an English historian, coined Parkinson‘s Law in 1995. Parkinson‘s Law, in its common definition, means that Work expands so as to fill the time available for its completion. It means that if you give yourself a week to complete a two-hour task, then (psychologically speaking) the task will increase in complexity and become more daunting so as to fill up that week. It possibly will not even fill the extra time with additional work, but just the pressure and worry about having to get it done. By passing on the correct amount of time to a task, we achieve extra time and the assignment will decrease in complexity to its normal position. Project Managers coming from a technical background are the best candidates to beat Parkinson‘s Law, just because they identify the genuine ins and outs of any job, if it‘s simple or tough, if it takes an hour or a week, and they‘ll be able to evaluate objectively the estimates given by the team members and deduce some near-accurate approximation themselves. Needless to say, understanding in Project Management plays a huge factor in conquering Parkinson‘s Law and finishing the project within a reasonable time frame and on a realistic budget. The Parkinson‘s Law has emphasized that the effort of software development is determined by the existing available resources rather than by objective assessment. This technique says that if the project has to be deployed in 12 months and 5 people are accessible, the effort required is estimated to be 60 person-months. So, this implies that work expands to fill the time available is the concept of Parkinson‘s Law. The advantage of Parkinson‘s Law is that it helps to distribute the project development time among different activities in a balanced manner without any additional overspend. The limitation of Parkinson‘s Law is that it may not promote good software engineering practice as it toggles between good estimation, overestimation as well as unrealistic estimation. 2.1.6 Work Breakdown Structure A WBS is a decomposition of the total work to be carried out on a project into smaller units that can be estimated, allocated, evaluated, and tracked [14]. A WBS should describe all the work and only the work that is to be performed on the project. The WBS therefore defines the project‘s scope of work. The decomposition of work forms a tree that may have any number of levels. Each node in the tree is called a WBS element. The root node of the tree presents the project itself. Each leaf of the tree is called a terminal WBS element or work package. The work performed in any non-terminal WBS element is the sum of the work performed in all its children. The total amount of work performed in a project is the sum of that performed in all the terminal WBS elements. An elegant WBS creates it simple to allocate each project action to one and only one terminal part of the WBS. In addition to its use in cost predicting, the WBS also assists to map requirements from one level of the system design to another, e.g. a requirements cross reference matrix mapping functional requirement to high level or low level design documents. 2.1.7 TSP Planning Team Software Process introduces team dynamics for analysis, role designation and development stages over PSP trained and operating developers [15]. Its key components are 1. Product Need Statement => Project Launch 2. Development Strategy 3. Development Plan 4. Requirements © 2013, IJARCSSE All Rights Reserved
Page | 1123
Sinhal et al., International Journal of Advanced Research in Computer Science and Software Engineering 3(6), June - 2013, pp. 1120-1135 5. Designing with Teams 6. Product Implementation 7. Integration & System Test 8. Post mortem a. Possibly iterations… The TSP (Team Software Process) software development cycle begins with a planning process entitled the launch, led by a trainer who has been particularly trained, and is either specialized or interim. The launch is designed to begin the team building procedure, and throughout this time managers and team set up goals, identify the team roles, evaluate risks, estimate effort, assign tasks, and create a team plan. During an execution stage, a developer's path designed and actual schedule, effort, bugs, and meeting regularly (usually weekly) to report status and modify plans. A development phase ends with an investigation to evaluate performance, improve planning parameters, and confine lessons learned for process improvement. 2.1.8 PSP- PROBE Technique Watt introduced the Personal Software Processor PSP [16]. There is a hierarchical relationship between the SEI initiatives: 1. PSP process at the individual software engineer level 2. TSP [15] process at the software engineering team level 3. CMM process at the organization level PROBE - PROxy Based Estimation uses similar project and product work experiences when estimating future effort. Humphrey created PROBE for less, one-person efforts. Though it can be customized for larger efforts and teams of engineers. PROBE uses LOC and KLOC for measuring product size and effort size. If this isn‘t appropriate, it can be easily custom-made for Objects, Function points, database tables, screens or other levels of granularity as needed. PSP Probe Forces to keep good historical data then use it. It is quantitative and shows a very noticeable estimation. It works fine at the individual little effort level; however not a collaborative method. It doesn‘t scale well to larger efforts. The Personal Software Process (PSP) is a planned software development process that is intended to help software engineers understand and improve their performance, by using a "disciplined, data-driven procedure". Proxy-Based Estimating (PROBE) is an estimating process used in the Personal Software Process (PSP) to estimate the size and effort. Proxy Based Estimating (PROBE) is the estimation method introduced by Watts Humphrey (of the Software Engineering Institute at Carnegie Mellon University) as part of the Personal Software Process (a discipline that helps individual software engineers monitor, test, and improve their own work). PROBE is based on the concept that if an engineer is building a component similar to the one he built previously, and then it will take about the same effort as it did in the past. In the PROBE method, individual engineers use a database to keep track of the size and effort of all of the work that they do, creating a history of the effort they have put into their previous projects, divided into separate components. Every component in the database is designated a type (―calculation,‖ ―data,‖ ―logic,‖ etc.) and a size (from ―very small‖ to ―very large‖). When a new task must be predictable, it is divided into tasks that correspond to these categories and sizes. A formula based on linear regression is used to compute the estimate for each task. 2.1.9 Buy Vs Make Decision Reusable Component based software development is getting popular. Project managers often want to make use of COTS (Commercial off the shelf components) instead of encouraging developers to create from the scratch, appreciate reuse of modules of previous projects if any. So a buy / estimate decision takes care as well in the estimation of projects [17]. It may be further cost efficient to obtain a piece of software rather than develop it. Decision tree analysis offers an organized method to sort from beginning to end the make-buy decision. As a rule outsourcing project development needs more skillful management than in-house development of the same product. 2.1.10 Thumb Rule A means of estimation made according to a rough and ready realistic rule, not based on science or precise measurement. Rules of thumb are important, but they must be used wisely. Develop your own list. This can be accomplished through experience, or by consulting with experts in the field. Many rules exist embedded within commercial parametric models, and are available to the users and modellers. In any event, it is important to have a list of benchmark factors. You'll probably need a different list for each organization you deal with. Organizational and product differences will demand it. But remember that there are no shortcuts or magic formulas, so use your rules as a quality check, or for quick, rough order of magnitude estimates. Thumbs rule is subjective in nature. The decision is taken based on personal interests, a bigger disadvantage of this method. 2.1.11 Pricing to Win In pricing to win estimation strategy, the project estimate is determined by the customer financial plan. Its benefit is one gets the deal [17]. This approach may seem unethical and un-professional. Still, when thorough information is missing it may be the only appropriate strategy. The project cost is decided on the basis of an outline proposal and the development is constrained by that price. A comprehensive requirement may be bargained or an evolutionary approach used for system development. Both Parkinson‘s Law and pricing to win methods are used in the Industry.
© 2013, IJARCSSE All Rights Reserved
Page | 1124
Sinhal et al., International Journal of Advanced Research in Computer Science and Software Engineering 3(6), June - 2013, pp. 1120-1135 Price believed to be necessary to win the job (not a cost estimate) The development costs whatsoever the client has to spend on it Advantages: You get the contract Disadvantages: The probability that the customer gets the system he or she wants is less. Costs do not exactly replicate the work required. 2.2 Parametric or Algorithmic Techniques 2.2.1 Halstead Model: Halstead‘s metrics estimate the program volume, its difficulty and programming effort. It defines the program complexity as a measure of the total number of operators and operands in a program. Halstead has proposed an effort metric to determine the effort and time which is given by the equation: E = V/L Where E is the Effort in mental discriminations needed to implement the program, the program volume V, program length, L, program vocabulary, and, the program level, V* is the potential minimum volume. The operators and operands used here can be assigned to higher-level object oriented programming constructs, e.g. Java methods, classes and packages. The benefit of using this metric is that it is very helpful and constructive for identifying computationally intensive code with many complex formulas, which correspond to likely sources of imprecision or errors. On the other hand, the limitation of Halstead‘s metric is that it‘s the equations their derivations are not free from controversy. Halstead proposed the code length and volume metrics. Code length is used to gauge the source code program length and is defined as: N= N1+N2 Where N1 is the overall number of operating frequency, and N2 is the overall number of operand frequency. The volume represents the amount of necessary storage space and is defined as: V = N log (n1+n2) Where n1 is the number of different operators, and n2 is the number of distinct operands that appear in a program. There have been some disagreements over the underlying theory that supports the software engineering approach. This measurement has received decreasing support in recent years. Effort E = 0.7 * (Size) 1.50 2.2.2 Walston-Flix Model: Walston and Felix (1977) developed their effort model from a various aspects of the software development environment such as user database of sixty projects collected in IBM's Federal Systems division [18]. It provides a relationship between delivering lines of source code. This model constitutes contribution, memory constraints, customer-oriented alteration etc. According to Walston and Felix model, the effort is computed by: Effort E = 5.2 * (Size) 0.91 2.2.3 SEL Model: The Software Engineering Laboratory (SEL) of the University of Maryland has established a model i.e. SEL Model for estimation [15]. Estimation of effort according to SEL model is defined as follows. Effort E = 1.4 * (Size) 0.93 Duration D= 4.6 KLOC 0.26 2.2.4 JPL Model: Jet Propulsion Laboratory (JPL), California Institute of Technology, California has managed transitions of application software suites from one operating system and hardware platform to multiple operating systems and hardware platforms [19]. As a component of these changes, effort estimates were produced from the individual understanding of in-house developers and managers to calculate the total effort required for such projects. Productivity metrics have been composed for two such changes, one extremely big and the other comparatively small in terms of source lines of code. Effort E = 2.43 * (Size) 0.962 2.2.5 Bailey-Basili Model: This model proposed by Bailey and Basili [20] in 1981. Effort E = 5.5 + 0.73 * (Size) 1.16
© 2013, IJARCSSE All Rights Reserved
Page | 1125
Sinhal et al., International Journal of Advanced Research in Computer Science and Software Engineering 3(6), June - 2013, pp. 1120-1135 2.2.6 Doty Model [21]: Effort E = 5.288 * (Size) 1.047 (Where Size>9) 2.2.7 RADC Model [21]: Effort E = 4.86 * (Size) 0.976 2.2.8 COCOMO Constructive Cost Model: The Constructive Cost Model (COCOMO) is an algorithmic software cost estimation model built up by Barry W. Boehm. The model exploits a basic regression formula with parameters that are derived from historical project data and current project characteristics. COCOMO was first published in Boehm's 1981 book Software Engineering Economics [10] as a model for estimating effort, schedule, and cost of projects. The survey examined the development ranging in size from 2K to 100K lines of instructions, and coding languages varying from assembly to PL/I. These developments were based on the waterfall model of software development that was the prevalent software development procedure in 1981. Suggestions for this model typically call it COCOMO 81. In 1997 COCOMO II was developed and published in 2000 in the book Software Cost Estimation with COCOMO II. COCOMO II is the descendant of COCOMO 81 and is superior for estimating modern software projects. It offers extra support for current development processes and an updated development database. The requirement for the novel model came as software development technology moved from mainframe and overnight batch processing to PC development, the use of off-the-shelf software components and code reusability. COCOMO consists of a hierarchy of three increasingly detailed and precise forms. The initial level, Basic COCOMO is good for rapid, early, irregular order of magnitude estimates of software costs, but its precision is limited due to its lack of features to account for difference in project attributes (Cost Drivers). Intermediate COCOMO acquires these Cost Drivers into considerations and Detailed COCOMO additionally accounts for the influence of individual project phases. a. Basic COCOMO Effort Organic Semi-detached Embedded
E = a * (Size) b a= 2.4, b = 1.05 a= 3.0, b = 1.12 a= 3.6, b = 1.20
b. Intermediate COCOMO Effort E = a * (Size) b * EAF EAF – Effort Adjust Factors (15 Attributes) c. Detailed COCOMO Detailed model is a more detailed classification of 15 factors for the project to the extent of complete information reference to Boehm (1981), detailed models and intermediate models used the same equation.
Fig. 2: COCOMO Models d. COCOMO II COCOMO II consists of two models which are Early Design Model (EDM) and a Post - Architecture Model (PAM). Early Design Model – EDM is used in the initial phases of software development project, while only the software architecture is being designed; the detailed information about the actual software and its overall development process are not yet to be known. Post-Architecture Model – PAM is used in the phase when the Business Analyst does the requirement architecture and the software product is ready for its development phase. © 2013, IJARCSSE All Rights Reserved
Page | 1126
Sinhal et al., International Journal of Advanced Research in Computer Science and Software Engineering 3(6), June - 2013, pp. 1120-1135 17 Effort E = a * (Size) c * EMi i=1 5 c= b+0. 01* SFj j=1 a= 2.94, b =0. 91 EM – Effort Multipliers (17 Attributes), SF- Scale Factors (5 Attributes) 2.2.9 SEER-SEM The System Evaluation and Estimation of Resources – Software Estimation Model (SEER-SEM) is a parametric approach to estimate and was developed by Galorath Inc. based on Jensen model (first published in 1983)[22, 23]. SEER-SEM uses the parameters of size, personnel, complexity, environment and constraints for estimating project cost, risk and schedule. SEERSEM covers all phases of a project life cycle and handles several environmental and application configurations. It relies on knowledge bases, parametric algorithms, simulation-based possibility, and historical precedents. It is composed of a group of models working together to provide estimates of effort, duration, staffing, and defects. This metric is used for estimating software development and maintenance effort. The advantage of SEER-SEM is about having a better accuracy in effort estimation. The research result of Wei Lin Du [24] says that, the SEER-SEM with Neuro-fuzzy model of effort estimation produces unique characteristics and an improved performance. This approach of using Neuro-fuzzy with SEER-SEM has a better advantages compared to the use of only SEER-SEM. There are two major limitations of SEER-SEM on effort estimation. First, there are over 50 input parameters related to the various factors of a project, which increases the complexity of SEER-SEM, especially for managing the uncertainty from these outputs. Second, the specific details of SEER-SEM increase the difficulty of discovering the nonlinear relationship between the parameter inputs and the corresponding outputs. Overall, these two major limitations can lead to a lower accuracy in effort estimation by SEER-SEM.
Fig. 2: SEER-SEM Inputs & Outputs SEER for Software (SEER-SEM) is composed of a group of models working together to provide estimates of effort, duration, defects, and staffing. These models can be explained in brief by the questions they answer: Sizing: How large is the software project being estimated (LOC, FPs, UCPs, etc.) Technology: What is the possible productivity of the developers (potential, practices, tools, etc.?) Schedule and Effort Computation: How much amount of effort and time are required to complete the project? Controlled Schedule and Effort Computation: How does the expected project outcome change when schedule and staffing constraints are applied? Activity and Labor Allocation: What are the activities and labor be allocated into the estimate? Cost Calculation: Given the anticipated duration, effort, and the labor allotment, what will the project cost? Defect Calculation: Given type of product, the duration of the project, and further information, what is the expected, objective quality of the software delivered? Effort Calculation of Maintenance: How much effort will be required to adequately maintain and upgrade a fielded software system? Progress: How is the project progressing, where it will end up and how to replan? Validity: Is this development attainable based on the technology involved? Software Sizing © 2013, IJARCSSE All Rights Reserved
Page | 1127
Sinhal et al., International Journal of Advanced Research in Computer Science and Software Engineering 3(6), June - 2013, pp. 1120-1135 Software size is a key input to any estimating model and across most software parametric models. Sizing metrics comprise source lines of code (SLOC), function points (FPs), function-based sizing (FBS) and a range of other metrics. They are interpreted for internal use into an effective Size (ES). ES is a form of universal currency within the model and facilitate new, reused, and even commercial off-the-shelf (COTS) code to be mixed for an incorporated study of the software development procedure. The general calculation for ES is: ES = NewSize + CurrentSize * (0.4 * Redesign + 0.25*ReCoding+ 0.35*Retest) As indicated, ES increases in direct fractional to the amount of new software being developed. ES Increases by a lesser amount as pre-existing code is reused in a project. The degree of this add is governed by the amount of rework (redesign, reimplementation, and retest) required to reuse the code. 2.2.10 Function Point A function point is a unit of measurement to state the amount of business functionality an information system offered to a user. The cost (in money or hours) of a single unit is computed from past projects. Function points were described in ‗A New Way of Looking at Tools’ by Allan Albrecht at IBM in 1979. [25] The functional user needs of the software are recognized and everyone one is categorized into one of five kinds: inputs, outputs, inquiries, internal and external interfaces. Once the function is recognized and classified into a type, it is then measured for complexity and assigns a number of function points. Every functional user request mapped to an end-user trade function, such as a data access for an Input or a user question for an Inquiry. This difference is significant because it has a tendency to create the functions measured in function points map simply into user-oriented requirements, but it also is liable to cover internal functions (e.g. algorithms), which also require resources to implement, though, there is no ISO standard FSM Method that consist of algorithmic complexity in the sizing outcome. Lately there have been various techniques proposed to deal with this apparent limitation, applied in numerous industrial software products. The variant of the Albrecht based IFPUG technique designed to comprise for this (and other weaknesses) include: Early and easy function points - Adjusts for problems and data complexity with two questions that yield a somewhat subjective complexity measurement; simplifies measurement by omitting the need to count data elements. Engineering function points - Elements (variable names) and operators (e.g., Arithmetic, equality/inequality, Boolean) is calculated. This variant highlights computational function. The intention is analogous to that of the operator/operand-based Halstead Complexity Measures. Bang measure - Defines a function metric based on twelve primitive (simple) counts that influence our show Bang, defined as "the measure of true function to be deployed as thought by the user." Bang evaluation may be supportive in evaluating a software unit's value in terms of how much useful function it proposes, though there is minor evidence in the literature of such application. The Bang measure could affect when re-engineering (either complete or piecewise) is being measured. Feature points - Adds alterations to enhance the applicability to systems with significant internal processing (e.g. communications systems, operating systems,). This allows accounting for functions not readily identify with the user, but necessary for stable operation. Weighted Micro Function Points - One of the newer models, which adjust function points using weights derived from program, flow complexity, the operand and operator vocabulary, object usage, and algorithmic intricacy. Function Point (FP) Based Models Albrecht & Gaffney Model: Effort E = -13.39+0.0545 * FP
Kermer Model: Effort E = 60.62 * 7.728 * 10-8 * FP3
Matson-Barrett-Mellichamp Model: Effort E = 585.7 + 15.12 * FP 2.2.11Weighted Micro Function Points Weighted Micro Function Points (WMFP) are a modern software sizing algorithm invented by Logical Solutions in 2009 which is a successor to solid ancestral scientific techniques as COCOMO, COSYSMO, Cyclomatic complexity, maintainability index, Halstead complexity, and function points. It produces more accurate results than traditional software sizing method, while requiring less arrangement and information from the end user, as many of the assessment is based on automatic measurements of a current source code. As several ancestor measurement techniques use source lines of code (SLOC) to measure software size, WMFP utilizes a parser to recognize the source code breaking it down into micro functions © 2013, IJARCSSE All Rights Reserved
Page | 1128
Sinhal et al., International Journal of Advanced Research in Computer Science and Software Engineering 3(6), June - 2013, pp. 1120-1135 and derive several code complexity and volume metrics, which are then dynamically interrupted into a final effort to score. In addition to compatibility with the waterfall software development life cycle method, WMFP is also friendly with recent SDLCs, such as Boehm Spiral, Six Sigma, and Agile (AUP/Lean/XP/DSDM) methodologies, due to its inconsistency analysis capability made possible by its high-precision measurement elements [26]. 2.2.12 Putnam’s SLIM Model Putnam [27] originates his model based on Norden/Rayleigh manpower distribution and his results in analyzing numerous accomplished projects. As a grouping, experimental models work by gathering software project data (for example, size and effort) and fitting a curve to the data. SLIM is generally known as a macro estimation model (It is for big projects). SLIM provides a cost estimator to perform the following functions: Calibrate and Fine-tune the model to represent the local software development environment by interpreting a historical database of past projects. Construct an information model of the software system, collecting software characteristics, personal attributes, and computer attributes etc. The essential part of Putnam's model is called the software formula as follows: S = E x (Effort) 1/ 3td4/ 3 Where td is the software delivery time; E is the environmental factor that reflects the development ability, which can be derivative of historical data using the software formula. The size S is measured in Lines of Codes and the Effort is measured in person-year. A different significant relation establishes by Putnam is Effort = D0 x td3 Where D0 is a parameter called manpower buildup that ranges from 8 (entirely new software with many interfaces) to 27 (reconstructed software). Merging the above formula with the software formula, we get the power function appearance: Effort = (D04/7 x E -9/7) x S 9/7 Td = (D-1/7 x E -3/7) x S 3/7 Putnam's SLIM model is also largely used in live out and SLIM is a software tool based on this model for effort estimation and manpower scheduling. Advantages of SLIM: Uses linear programming to think software development limitations on both cost and effort. It holds the majority of the accepted size estimating methods. SLIM has less parameter required to produce an estimate over COCOMO'81 and COCOMO'II Drawbacks of SLIM: Estimates are enormously responsive to the technology factor Not suitable for small projects 2.2.13 Use Case Based Estimation Use case modelling is a popular and widely used technique for capturing and describing the functional requirements of a project [1]. The designer of UML suggests that developers pursue a use case driven development method where the use case model is considered as input to design, and as a source for verification, validation and other forms of testing. A use case model defines the functional scope of the system to be developed. The functional possibility later serves as a basis for topdown estimates. A method for using use case models as a basis for estimating software development effort was introduced by Kermer. This method is influenced by the function point‘s method and is based on analogous use case points. The use of a modified edition of the use case points method is reported in where it was found that attributes of a use case model are reliable indicators of the size of the resulting functionality. Use case models have also been established well suited as a basis for the estimation and planning of projects in a software improvement project. 2.2.14 Checkpoint Model The CHECKPOINT Model was proposed by T. Jones Capers [28] of Software Productivity Research, Inc. and is based on actual historical information from approximately 4,700 software projects. It is based on function points, which measure software size based on the functionality of the software program, as opposed to LOC method. Although CHECKPOINT supports three alternative types of software sizing metrics: 1) function points, 2) feature points (systems and embedded software), and 3) source code statements, but its sizing logic is that it will always internally revert to functional metrics. In order to achieve more accurate estimates, CHECKPOINT calculates effort at the task level and aggregates the task-level effort values to arrive at an effort total for the project. If specified by the estimator, it then normalizes the effort values by phase to arrive at the percentage of total effort for each phase, which is reported in the estimate. These percentages may vary by project, according to inputs such as programming language and program complexity. The checkpoint algorithms are proprietary. © 2013, IJARCSSE All Rights Reserved
Page | 1129
Sinhal et al., International Journal of Advanced Research in Computer Science and Software Engineering 3(6), June - 2013, pp. 1120-1135 The limitation of CHECKPOINT is that it may not work significantly well with SLOC (source lines of code) as its input. In the case of SLOC as its input, the model converts the SLOC into function point and this conversion ratio is sometimes subject to significant variations. The advantage of CHECKPOINT is that it considers function point rather than LOC metric as its input for effort estimation and results a better accuracy in estimation. Again, CHECKPOINT predicts effort at four levels of granularity such as at project, phase, activity, and task level. 2.2.15 Object Oriented Models In recent years Object Oriented (OO) technologies have emerged as a dominant software engineering practice. As happens with much new technology, the development of OO approach has required software developers and their managers to rethink the way they have estimated the size of their development projects. Traditional software measurement techniques have proven unsatisfactory for measuring productivity and predicting effort. 2.2.16 Predictive Object Point (POP) Model POP was introduced by Minkiewicz [29] in 1998 PRICE systems has developed the predictive object point (POP) metric for predicting effort required for developing an object oriented software system and is based on the counting scheme of function point (FP) method. POP metric is based on the measures of object-oriented concepts of the class developed, the behaviour of these classes and the effects of these behaviours for the rest of the system. In addition to these, the measures of the breadth and depth of the intended class structure are incorporated. The POP metrics include the number of top-level classes (TLC) along with the average number of WMC (weighted method per class) and combines the average DIT (depth of inheritance tree) as well as the average NOC (number of children, the number of immediate subclasses of a class). Methods are organized by type, assigning a weight to each method based on the amount of effort associated with that method. Counting rules (based on a count of messages responded to and properties effected) for determining the ranking of a method within the classifications are applied. After determining the values for the constants, they are used to calculate WMCs that were then combined with counts of the TLC, average NOC, and average DIT. POPs are calculated using a formula: POPs (WMC, TLC, DIT, NOC) = [(WMC * f1 (TLC, DIT, NOC))/7.8] * f2 (NOC, DIT) Where f1 attempt to size the overall system and f2 applies the effects of reuse through inheritance. As the use case diagram is used for modelling object oriented system in its early phase of envelopment for identifying system functionalities, so emphasis must be taken in looking the direct relationship between use cases artifacts and the POPs The advantage of POPs is that the process can be automated. In simplifying estimation process using POPs, still there is a necessity to address the gap between the early analysis available artifacts and the metrics required for POPs count and then examining the direct relationships exist among them, which can be considered as an inadequacy of POPs. 2.2.17 ESTIMAC This proprietary model-based technique, exposed by Rubin [Rub83], follows a commercial model approach. The input for the model is a series of answers to 25 questions referring to several effort drivers. Its proprietary type stops a larger spread in its use. The advantage of using ESTIMAC is that it uses function point instead of LOC as its input for effort estimation and the mean error percentage of ESTIMAC is only 85.48% as against 601% with COCOMO and 771.87% with SLIM. The limitation of use of ESTIMAC is that the way it translates the input to an estimation of effort is not clear. It is a function point analysis based method and was proposed by Dr. Howard Rubin. It focuses on the development phase of the system life cycle and used for estimating effort, staff size and deployment, cost, hardware resource requirements, risk, and portfolio impact. ESTIMACS considers function point as its input for effort prediction. It contains the categorization of "project factors," such as "Customer Complexity" and "Business Function Size" for the "Effort Hours" combination. ESTIMAC was calculated as an enclosed model. The estimators need to answer 25 questions for effort estimation using this approach. These questions are partly related to the complexity of the user-organization and partly to the complexity and size of the software to be developed. 2.2.18 PRICE-S The PRICE-S model was initially developed at RCA to use inside on software projects such as some that were part of the Apollo Moon plan. It was released in 1977 as a proprietary model and used for estimating several US DoD, NASA and other government projects. The model formulas were not released in the public domain; however a small number of the model‘s fundamental algorithms were published in [Park 1988]. The tool continued to become popular and is now marketed by PRICE Systems, which is a private company previously affiliated with Lockheed Martin. As published on PRICE Systems website (http://www.pricesystems.com), the PRICE-S model consists of three sub models that enable estimating costs and schedules for the development and support of computer systems. These three sub models and their functionalities are outlined below: The acquisition sub model: This sub model forecasts software costs and schedules. The model covers all types of software project development, including business models, communications, and command and control, avionics, and space systems. PRICE-S addresses current software issues such as reengineering, spiral development, code generation, rapid development, © 2013, IJARCSSE All Rights Reserved
Page | 1130
Sinhal et al., International Journal of Advanced Research in Computer Science and Software Engineering 3(6), June - 2013, pp. 1120-1135 object-oriented development, rapid prototyping and software productivity measurement. The sizing sub model: This sub model facilitates estimating the size of the software which is under development. Sizing can be in Line of Codes (SLOC), Function Points (FPs) and/or Predictive Object Points (POPs) or Object Oriented (OO) metrics. The life cycle cost sub model: This sub model is used for fast and early costing of the maintenance and support phase of the development. It is used in groups with the Acquisition Sub model, which offers the development costs and design parameters. PRICE Systems maintain to inform their model to convene a new confronts. Recently, they have launched Foresight 2.0, the latest version of their software solution for predicting effort, time and costs for non-military government and commercial software projects. III. RECENT EFFORT ESTIMATION METHODS The intend of this section is to give details the recently researched software effort estimation methods introduced in software engineering. 3.1 Analogy Techniques: 3.1.1 Estimating by Analogy Estimating by analogous means comparing the proposed project to previously completed a similar project where the information of project development is known. Authentic data from the finished projects are extrapolated to estimate the anticipated project. This method can be applied either at component-level or the system-level. Estimating by analogy is relatively clear-cut. Actually in some form, it is a methodical form of expert judgment as professional often look for analogous circumstances so as to notify their view. The major steps for estimation by analogy are: Characterizing the proposed project. Selecting the most similar completed projects whose characteristics have been stored in the historical database. Deriving the estimate for the proposed project from the most similar completed projects by analogy. The major benefits of the analogy method are: The estimation is based on actual project characteristic data. The estimator's past experience and knowledge can be used which is not easy to be quantified. The differences between the completed and the proposed project can be identified and impacts estimated. However there are also some problems with this method, Using this method, we have to decide how best to explain projects. The choice of variables must be restricted to information that is accessible at the point that the prediction required. Potential consist of the kind of application area, the number of inputs, the number of screens, the number of different entities referenced and so forth. Even once we have discriminate the project, we have to choose the resemblance and how much confidence can we put in the analogies. Too little analogies may lead to nonconformist projects being used; too many might lead to the dilution of the effect of the adjoining analogies. Martin Shepperd et. al. [30] instigated the method of searching the analogies by computing the Euclidean distance in n-dimensional space where each dimension represents to a variable. Values are standardized so that every aspect contributes equal weight in the process of discovering similarity. Commonly speaking, two analogies are the most effective. Finally, we have to derive an estimate for the new project by using known effort values from the similar projects. Possibilities consist of means and weighted means that will give more influence to the closest analogies. It has been observed that estimating by analogy is a superior method of estimation via algorithmic model in at least some conditions. It is a supplementary intuitive technique so it is easy to recognize the reasoning behind a particular forecast. This technique is usually appropriate when other projects in the same application domain have been completed. The cost of a new task is estimated by analogy with these completed projects. However, most of the companies have not enough historical data to adequately use analogy as way for estimation. It should be kept in mind that when using past data that the significant differences between past and future projects must consider. Pros: Can be accurate. Simple if the organization repeats similar work. Estimates are immediately available. Encourages detailed documentation. Cons: Can be very unreliable. It is extremely tough to evaluate the dissimilarity among the environments and thus assess the correctness of the data. A prominent way of supporting effort estimators is analogy based effort judgment. The fundamental principle is to find alike projects in historical project portfolio data. These data will be used as a basis for one of the estimation methods and the use of historical data by adapting the analogy strategy within an estimation process.
© 2013, IJARCSSE All Rights Reserved
Page | 1131
Sinhal et al., International Journal of Advanced Research in Computer Science and Software Engineering 3(6), June - 2013, pp. 1120-1135 3.1.2 Case Based Reasoning Technique CBR, initiated in analogical understanding, and dynamic storage and the place of previous states in knowledge and problem solving, has received much concentration recently. Cases are a generalization of actions (solved or unsolved problems), inadequate time and space. Aarmodt and Plaza [31] explain CBR as being cyclic and sequence of four stages: 1. Retrieval of similar cases, 2. Reuse of the retrieved cases to and a solution to the problem, 3. Revision of the proposed solution if necessary, and 4. Retention of the result to create a new case. When a new problem takes place, an expected solution can be established by retrieving alike cases from the case repository. Research demonstrates that CBR systems can fruitfully be adapted to address the effort estimation complexity. CBR approach show to have some advantages above other approaches, e.g., effective performance with small numbers of observations and in problem domains that are not well recognize, and understand reasoning process. Case-based reasoning (CBR), generally interpreted, is the procedure of resolving new problems based on the solutions of similar past problems. Case-based reasoning has been dignified for the purpose of computer interpretation as a four-step process: Retrieve: Given a target issue, retrieve from storage cases related to resolve it. A case contains a problem, its result, and, usually, comments about how the result was derived. Reuse: Map the solution from the previous case to the target issue. This may engage adapting the result as required to fit the new state. Revise: Having mapped the previous solution to the target state, test the new outcome in the real world (or a model) and, if necessary, revise. Retain: After the solution has been productively adapted to the goal issue, stack the resultant knowledge as a latest case in memory. 3.2 Soft Computing Techniques 3.2.1 Neural Networks Neural Networks are nets of processing elements that are capable to learn the existing mapping between input and output data. The neuron computes a weighted sum of its inputs and generates an output if the sum goes beyond a definite threshold. This result is then transformed into an excitatory (positive) or inhibitory (negative) input to other neurons in the configuration. The procedure carries on until one or more outputs are generated [32]. The Neural Network is initialized with random weights and gradually learns the relationships implicit in a training data set by adjusting its weights when presented with these data. The network generates effort by propagating the initial inputs through subsequent layers of processing elements to the final output layer. Every neuron in the network works out a nonlinear function of its inputs and surpasses the resulting value along its output. The favored activation function is Sigmoid Function is given as:
Among the several available training algorithms the error back propagation is the most used by software metrics researchers. The drawback of this method lies in the truth that the analyst can‘t influence the net once the learning stage has finished [33]. Neural Network‘s limitations in several aspects prevent it from being widely adopted in effort estimation. It is a ‗black box‘ approach and therefore it is difficult to understand what is going on internally within a neural network. Hence, justification of the prediction rationale is tough. The neural network is known for its ability in tackling the classification problem. Contrarily, in effort estimation what is needed is generalization capability. At the same time, there is a little guideline in the construction of neural network topologies [34]. One of the methods is the use of Wavelet Neural Network (WNN) to forecast the software development effort. The effectiveness of the WNN variants is compared with other techniques such as multiple linear regressions in terms of the error measure which is a mean magnitude relative error (MMRE) obtained on Canadian financial (CF) data set and IBM data processing services (IBMDPS) dataset [35]. Based on the testing, it is established that the WNN is better than other methods. Another method is proposed to use the radial basis neural network for effort estimation [36]. A case study based on the COCOMO81 database compares the proposed neural network model with the Intermediate COCOMO. The results are analyzed using different criteria and it is observed that the Radial Basis Neural Network provided better results. 3.2.2 Fuzzy Logic Fuzzy logic is an important tool, which can be used to resolve highly difficult problems where a mathematical model is too complex or unfeasible to construct. It is also used to decrease the complexity of existing solutions as well as increase the accessibility of direct hypothesis [37]. The development of software has always been characterized by parameters that possess a certain level of fuzziness. The study showed that the fuzzy logic model has a place in the software effort estimation © 2013, IJARCSSE All Rights Reserved
Page | 1132
Sinhal et al., International Journal of Advanced Research in Computer Science and Software Engineering 3(6), June - 2013, pp. 1120-1135 [38]. The application of fuzzy logic is able to overcome some of the problems that are inherent in existing effort estimation techniques [39]. Fuzzy Logic is not only supportive for effort forecast, but that it is necessary in order to get improved quality of existing estimating methods. Fuzzy logic enables linguistic representation of the input and output of a model to tolerate imprecision. It is particularly suitable for effort estimation as many software attributes are measured on nominal or ordinal scale type that is a particular case of linguistic values. A method is proposed as a Fuzzy Neural Network (FNN) approach for embedding artificial neural network into fuzzy inference processes in order to derive the software effort estimates [40]. The artificial neural network is utilized to determine the significant fuzzy rules in fuzzy inference processes. The outcomes confirmed that using FNN for effort estimates resulted in somewhat lesser Mean Magnitude of Relative Error (MMRE) and possibility of a project having a relative error of less than or equal to 0.25 (Pred (0.25)) as contrast with the results achieved by using Artificial Neural Network (ANN) and the original model. 3.2.3 Genetic Programming Genetic programming is one of the evolutionary methods for effort estimation. The evolutionary Computation process is characterized by the truth that the solution is achieved by the generations of cycles of candidate solutions that are limited by the principle 'survival of the fittest‘. When GA is used for the resolution of real-world problems, a population comprised of a random set of individuals is generated. The population is evaluated during the evolution process. For each individual a rating is given, reflecting the degree of adaptation of the individual to the environment. A percentage of the most adapted individuals are kept, while that the others are discarded. The individuals kept in the selection process can suffer modifications in their basic characteristics through a mechanism of reproduction. This mechanism is applied to the current population aiming to explore the search space and to find better solutions for the problem by means of crossover and mutation operators generating new individuals for the next generation. This process, called reproduction is repeated until a satisfactory solution is found. An evaluation is recommended by [41] based on the well-known Desharnais data set of 81 software projects taken from a Canadian software house. It shows that Genetic Programming can offer some significant improvements in accuracy and has the potential to be a valid additional tool for software effort estimation. Genetic Programming is a nonparametric method since it does not make any assumption about the distribution of the data, and derives the equations according only to fit values. 3.2.4 Particle Swarm Optimization Particle Swarm Optimization (PSO) is a swarm intelligence method that optimizes a problem by iteratively trying to obtain an improved candidate solution with respect to a specified assessment of quality. Such methods are generally known as Meta Heuristics as they generate slight or no hypothesis about the problem being optimized and can investigate very large spaces of candidate solutions. PSO shares many similarities with evolutionary computation techniques such as Genetic Algorithms (GA). The system is initialized with a population of random solutions and searches for optima by updating population. Still, not like GA, PSO has no evolution operators such as crossover and mutation. In PSO, the likely solution, called particles, flies during the problem space by following the existing optimal particles. One method has been proposed to use Particle Swarm Optimization (PSO) for tuning the parameters of the Constructive Cost Model (COCOMO) for better effort estimation [42]. IV. CONCLUSIONS This paper has presented an overview of a variety of software estimation methods, providing an outline of numerous accepted estimation models currently available. Experience to date indicates that soft computing based techniques are less mature than the other classes of techniques, but that the rapid pace of change in software technology challenges all classes of techniques. The significant note to take from this paper is that no particular single method or model should be chosen over all others. Algorithmic models require as inputs, accurate estimate of certain features such as line of code (LOC), complexity and so on that are complicated to take during the early phase of a software development project. The models also have complexity in modeling the intrinsic difficult relationships among the contributing features, are incapable to handle categorical data as well as lack of analytical ability. The restrictions of algorithmic models direct to the investigation of the non-algorithmic techniques that are soft computing based. These contain artificial neural network, fuzzy logic, evolutionary computation, combinational models, and case-based reasoning and so on. Researchers have developed different models for estimation but there is no estimation method, which can present the best estimates in all various situations, and each technique can be suitable in the special project. In an absolute sense, none of the models perform particularly well at estimating development effort, mainly along the MMRE measurement. But in a comparative sense ANN technique is competitive with traditional models. Again as a comparative analysis, genetic programming can be used to fit complex functions and can be easily interpreted. Particle Swarm Optimization and Genetic Programming can find a more advanced mathematical function between KLOC and effort. So the research is on the way to combine different techniques for calculating the best estimate. REFERENCES [1]. Anda, B. Angelvik, E. Ribu, K. "Improving Estimation Practices by Applying Use Case Models" , Profes 2002, LNCS 2259, pp. 383-397. © 2013, IJARCSSE All Rights Reserved
Page | 1133
[2]. [3]. [4]. [5]. [6]. [7]. [8]. [9]. [10]. [11]. [12]. [13]. [14]. [15]. [16]. [17]. [18]. [19].
[20]. [21]. [22]. [23]. [24]. [25]. [26]. [27]. [28]. [29]. [30]. [31]. [32]. [33]. [34].
[35].
Sinhal et al., International Journal of Advanced Research in Computer Science and Software Engineering 3(6), June - 2013, pp. 1120-1135 Winkler, R.L. "Combining forecasts: A philosophical basis and some current issues Manager", International Journal of Forecasting, Vol. 5, Issue 4, pp. 605-609, 1989. Blattberg, R.C. Hooch, S.J. ―Database Models and Managerial Intuition: 50% Model + 50% Manager‖, Management Science. Vol. 36, No. 8, pp. 887-899, August 1990. Jørgensen, M., "Estimation of Software Development Work Effort: Evidence on Expert Judgment and Formal Models", International Journal of Forecasting, Vol. 23, Issue 3, pp.449-462, 2007. Shepperd, M. Cartwright, M. Kadoda, G. "On Building Prediction Systems for Software Engineers", Empirical Software Engineering, Vol. 5, pp. 175–182, 2000. Kitchenham, B. Pickard, L.M. MacDonell, S.G. Shepperd, "What accuracy statistics really measure"?, Software, IEE Proceedings, Vol. 148 , Issue 3 , pp. 81 -85, Jun 2001. Foss, T. Stensrud, E. Kitchenham, B. Myrtveit, I. "A Simulation Study of the Model Evaluation Criterion MMRE". IEEE Transactions on Software Engineering, Vol. 29, No.11, 2003. Lo, B. Gao, X. "Assessing Software Cost Estimation Models: criteria for accuracy, consistency and regression". Hughes, R.T. Cunliffe, A. Young-Martos, F., "Evaluating software development effort model-building techniques for application in a real-time telecommunications environment". Barry Boehm. ―Software Engineering Economics‖, Englewood Cliffs, NJ: Prentice-Hall, 1981. James Grenning, "Planning Poker". Renaissance Software Consulting. April 2002. Mike Cohn, "Agile Estimating and Planning". Mountain Goat Software. November 2005. G.N. Parkinson, Parkinson's Law and Other Studies in Administration, Houghton-Miffin, Boston, 1995. Boehm B. W., Abts C., Chulani S., ―Software Development Cost Estimation Approaches – A Survey‖, Annals of Software Engineering, Vol. 10, pp. 177–205, 2000. Watt Humphrey, Team Software Process, Addison Wesley,2000 Watts Humphrey, A Discipline for Software Engineering, Addison Wesley, 1995 Roger S. Pressman, ―Software Engineering: A Practitioner‘s Approach‖ Sixth Edition, McGraw-Hill, NY, 2005. Walston C.E., Felix A.P., "A Method of Programming Measurement and Estimation", IBM Systems Journal, Vol. 16, No.1, 1997. Griesel, A., Hihn, J., Bruno, K., and Tausworthe, R. ―Software Forecasting as It is Really Done: A Study of JPL Software Engineers‖, Proceedings of the Eighteenth Annual Software Engineering Workshop. Goddard Space Flight Center. December 1-2, 1993. Bailey J. W., Basili V. R., ―A Meta Model for Software Development Resource Expenditures‖, IEEE Fifth International conference on software Engineering‖, pp. 107-129, 1981. J. R. Herd, J.N. Postak, W.E. Russell and K.R. Steward, "Software cost estimation study & Study results", Final Technical Report, RADC-TR77-220, Vol. I, Doty Associates, Inc., Rockville, MD, 1977. Fischman McRitchie L, K. Galorath D.D., ―Inside SEER-SEM‖, CrossTalk, the Journal of Defense Software Engineering, 2005. Galorath D., Evans M., "Software Sizing, Estimation, and Risk Management", Boca Raton, FL: Auerbach, 2006. Wei Lin Du, Danny Ho, Luiz Fernando Capretz, ―Improving Software Effort Estimation Using Neuro-Fuzzy Model with SEER-SEM‖, Global Journal of Computer Science and Technology, Vol. 10 Issue 12, pp.52-64, October 2010. A. J. Albrecht, ―Measuring Application Development Productivity,‖ Proceedings of the Joint SHARE, GUIDE, and IBM Application Development Symposium, Monterey, California, October 14–17, IBM Corporation, pp. 83–92, 1979. Engineering Function Points and Tracking System, Software Technology Support Centre, Retrieved on May 14, 2008. Putnam, L. H., ―A General Empirical Solution to the Macro Software Sizing and Estimating Problem‖, IEEE Transactions on Software Engineering, pp. 345-361, 1978. Capers Jones, "Software Engineering Best Practices": pp. 318–320, October 2009. Arlene F. Minkiewicz, ―Measuring Object Oriented Software with Predictive Object Points‖ PRICE Systems, L.L.C. 609-866-6576 Shepperd M., Schofield C., ―Estimating Software Project Effort Using Analogy‖, IEEE Transactions on Software Engineering, Vol. 23, No.12, pp. 736-743, 1997. Agnar Aamodt, Enric Plaza, ―Case-Based Reasoning: Foundational Issues, Methodological Variations, and System Approaches‖, AI Communications, Vol. 7, pp. 39–59, 1994. N. Karunanitthi, D. Whitley, and Y. K. Malaiya, "Using Neural Networks in Reliability Prediction‖, IEEE Software, Vol. 9, no.4, pp. 53-59, 1992. A. Idri, T. M. Khoshgoftaar, A. Abran, ―Can neural networks be easily interpreted in software cost estimation?‖ IEEE Trans. Software Engineering, Vol. 2, pp. 1162 – 1167, 2002. Finnie, G. R., G.E. Wittig and J-M. Desharnais, (1997), "A Comparison of Software Effort Estimation Techniques Using Function Points with Neural Networks, Case- Based Reasoning and Regression Models", Journal of Systems and Software, Vol. 39, pp 281-289. K. Vinay Kumar, V. Ravi, Mahil Carr and N. Raj Kiran, (2008), "Software development cost estimation using wavelet neural networks", Journal of Systems and Software, Volume 81, pp 1853-1867.
© 2013, IJARCSSE All Rights Reserved
Page | 1134
[36]. [37]. [38].
[39].
[40]. [41].
[42].
Sinhal et al., International Journal of Advanced Research in Computer Science and Software Engineering 3(6), June - 2013, pp. 1120-1135 Prasad Reddy P.V.G.D, Sudha K.R, Rama Sree P and Ramesh S.N.S.V.S.C, ―Software Effort Estimation using Radial Basis and Generalized Regression Neural Networks‖, Journal of Computing, Volume 2, Issue 5, pp 87-92, 2010. Razaz, M. and King, J. (2004)‖Introduction to Fuzzy Logic‖ Information Systems - Signal and Image Processing Group. http://www.sys.uea.ac.uk/king/restricted/boa ds/ Moon Ting Su1, Teck Chaw Ling, Keat Keong Phang, Chee Sun Liew, Peck Yen Man, "Enhanced Software Development Effort And Cost Estimation Using Fuzzy Logic Model", Malaysian Journal of Computer Science, Vol. 20(2), pp 199-207, 2007. Agustin Gutierrez T., Cornelio Yanez M.and Jerome Leboeuf Pasquier, ―Software Development Effort Estimation Using Fuzzy Logic: A Case Study‖, Proceedings of the Sixth Mexican International Conference on Computer Science (ENC‘05), 2005. S. Kumar, B. A. Krishna, and P. S. Satsangi, ―Fuzzy systems and neural networks‖ in software engineering project management, Journal of Applied Intelligence, no. 4, pp. 31- 52 , 1994. C. J. Burgess, M. Lefley, "Can Genetic Programming improves Software Effort Estimation? A Comparative Evaluation", Machine Learning Applications in Software Engineering: Series on Software Engineering and Knowledge Engineering, pp. 95–105, 2005. A.P. Engelbrecht, Fundamentals of Computational Swarm Intelligence, John Wiley & Sons, New Jersy, 2006.
Prof. Amit Sinhal completed his B.E. in Computer Engineering from NIT Surat in 1996, M.Tech in Computer Science & Engineering from SATI Vidisha in 2005 and is pursuing Ph.D. from Rajiv Gandhi Technical University, Bhopal. He worked in various reputed software development companies as Project Lead and University Institute of Technology, Barkatullah University Bhopal as Assistant Professor. Currently he is working at Technocrats Institute of Technology, Bhopal as Professor in the Computer Science & Engineering department. He has published/presented more than 20 research papers in International Journals/Conferences. Dr. Bhupendra Verma completed his B.E. in Computer Engineering, M.Tech in Computer Science & Engineering from SATI Vidisha and Ph.D. from Rajiv Gandhi Technical University, Bhopal. Currently he is working in Technocrats Institute of Technology, (Excellence) Bhopal as Director and Professor in the Computer Science & Engineering department. He has published/presented more than 50 research papers in International Journals/Conferences. He has guided 20 M.Tech dissertations and is presently guiding five students for Ph.D.
© 2013, IJARCSSE All Rights Reserved
Page | 1135