the distance between the input and prototype grows, the response falls off exponentially towards 0. The shape of the RBF neuron's response is a bell curve, as.
International Journal of Applied Engineering Research ISSN 0973-4562 Volume 9, Number 23 (2014) pp. 22629-22639 © Research India Publications http://www.ripublication.com
Software Engineering Measures Using Radial Basis Function Neural Network E.Umamaheswari, Dr. D.K.Ghosh and Dr.N.Bhalaji Assistant Professor/SCSE, VIT University, Chennai Campus. Professor/AS&H, Dronacharya college of Engineering, Haryana Associate Professor, SSN College of Engineering, Chennai.
ABSTRACT Over the last decade, different types of software effort measure models are developed to improve the software quality and their reliability. However, the correct estimation of software quality of the product is till an unreachable goal in the software development life cycle. Thus, new software measure models are developed with existing techniques such as decision tree, case-based reasoning, genetic algorithms etc. But, these algorithms could not be suggested as a perfect set of qualified software measure to the specific given product. As a result, this research work proposed a new automaton based software effort estimation model in order to evaluate the software measures. It relies on first and second level expert opinion and machine learning approach namely Radial Basis Neural Network. The proposed framework is classified into two phases such as gather first and second level expert opinions and automatically suggests the suitable software measures to given product. The experimental result shows a set of qualified software measures are suggested by our automaton tool. Keywords: Software Engineering Measure, Software Quality, RBFNN (Radial Basis Function Neural Network), Software Reliability, Experts’ Opinion
1. Introduction In the software development life cycle, the software measure process helps organizations to improvise the software measurement. The software measurement is not meant for some application measurement (for example: analyze software complexity or measurement of software cost) but it is utilized for the software
Paper code: 29276 - ijaer
22630
E.Umamaheswari, Dr. D.K.Ghosh and Dr.N.Bhalaji
measurement of a program and to recognize several key lessons that shows how it works. The software reliability is a very significant component in difficult business applications in the software engineering filed. The development of reliable software is critical processes because of the interdependence between all software modules are exist from the previously developed software. Also, it is very critical task to find out whether the delivered software is unreliable or reliable. The system outage, problem reports, clients or customers opinion i.e., compliments or complaints shows the software project reliability. The two different kind of software reliability models are utilized to predict the reliability of software through executing test cases. The defect density" models are the initial kind of models and the “Reliability of software growth models” is second kind of models. The first type models uses lines of code, loops, input or output and peripheral references to discover the sequence of faults in the software project. The second types of models are utilized to compare and detect identity data with well-known functions (for example exponential function) in statistically. The well-known function will be utilized to estimate for further behavior analysis when its comparison results are good [1]. The reliability of software will be stated as the probability of error free software function to a specific time period in a specific environment. The reliability of software factor is accepted as the main factor when compare with the other factors such as functionality, usability and maintainability etc. The project is estimated with very poor ways that leads to the schedule goes to out of date then the project manger and his/her team member can get high pressure to complete the software. Thus, the project manager can hold on the verification and validation of software or assurance of the software quality. It creates several serious issues such as the developers must be wasted time and resources on the software integration and test or unit testing or rush a premature design into production [3]. Thus, the delivered project may be a poor quality and it also includes the poorly developed functions. Also, the project is estimated with high level by any organizations. The several types of estimation models are designed in last decades in order to solve the accurate software estimation problems and supporting to managers task[4][5][6]. The models are generally categorized into three types. Expert Judgment In this approach, an expert’s opinion is developed to obtain a project estimation using his/her knowledge in the software domain and present data about the project as developed. This kind of technique is widely utilized in the software quality estimation process but this estimation is generated in sensitive and implicit way but this is not a repeatable process. The expert opinion is always complex to measure but it can be estimated by using effective tools with some algorithmic models. Algorithmic Models These models are very popular models which are discussed in the literature. These models are depends upon the mathematical formulae for linking effort using effort drivers in order to obtains and generate the project estimation. Generally, these models are used the effort driver principle such as software size i.e., FP, lines of code in the source and etc. These are required to adjust for local circumstance.
Software Engineering Measures
22631
Machine learning These approaches were invented at the starting of 90’s to solve the two prior categories drawback. The example of these approaches are fuzzy logic [1] [10], regression trees [8] [9], Artificial Neural Networks [12] [13] [14] [15], and case based reasoning [6] [11].
2. Related work The survey which is based on software measurement provides the details to show the measurement importance. This survey discusses only the important strategic steps and events for measurement of software project in terms of cost, complexity, estimation of schedule estimation, effort and quality. The cost of software is closely related to productivity and quality of the software. G.R. Finnie et al. decided the artificial intelligence models that are correct models to get sufficient software measurement. But their performance is mostly dependent on trained data, and the level of corresponding project information is existing. Anita lee et al. decided that integrated cluster analysis with neural network model offers exact measurement for measurement of software, cost for improve the efficiency of the training of the network [5]. At 1998 Hearst et al. located the SVM algorithm at the joint of practice and learning theory: “it has a RBF (radial basis function), a huge set of neural net classes, and polymer classifiers as important cases. Therefore, it is sufficient to analyze mathematically, because it is presented relevant linear function in a feature space of huge dimensional” [6]. In this paper, Tony van Gestel et al. was explained that in order to obtain non linear models of time series and the depending volatility the Bayesian evidence framework is integrated with LSSVMs for nonlinear regression. On the initial stage of inference, a statistical framework is corresponded to the formulation of LS-SVM which permits including the volatility of time-varying of the market by corresponding option of more number of hyper parameters. In the second level the extracted hyper parameters which are corresponding to the volatility are utilized to create a volatility model in the region of evidence framework. On the third level the model comparison is done to obtain the RBF-kernel tuning parameters by sorting the various model evidences [7]. Zan huang et al. stated that the presented novel method as per the statistical learning theory, jointly with the linearly used high-performance operation, SVM, back propagation NNs, to the credit rating identification problem. They utilized couple of datasets for commercial banks of US and Taiwan financial institutes for practical. The output presented that SVM provided more accuracy which is like to back propagation NNs [8]. M. Jorgesen (2004) finalizes that the estimation of expert is the main strategy when approximating the software development projects potential, and there is no constant proof supporting the advance of model approximates above estimates of expert. There are possibilities where approximates of experts are accurate, for instance., possibilities where experts contains most important domain details which is not contained in situations or models when conditions of easy estimation offer more precise estimates [9]. Mohammed Abdullah Al-Hajri et. al. (2005) state that in software measurement contains the constant FP (Function Point) and more number of various models inferred from it. A novel Function point weights system was
22632
E.Umamaheswari, Dr. D.K.Ghosh and Dr.N.Bhalaji
accomplished by utilizing the Artificial NNs. This operation is a complexity weights modification of measure of function point and the outputs were very much suitable and more accurate when they are implemented on software project’s real data’s [10].
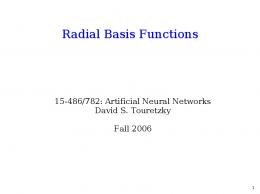
3. Proposed work The proposed framework utilized as an automated tool to evaluate the software quality and reliability. This tool is designed with Radial Basis Function based neural network, at first the intelligence systems is trained with number of measures, which is selected based on the expert’s and second level opinion collections. The input of Experts and Second level opinion collects opinion for all software measures based on the phases. In process stage, assign some phase level assessments to every top level experts and second level experts. Afterwards issue some opinions to every software measure based on their knowledge, and then collect the expert opinions. In the score computation process collects the expert opinions and aggregate the rating, weighted value of each criterion and then compute weighted rated value of all expert opinion. The classification of expert’s opinion computes the weighted and rating of expert opinion, and then the criteria are classified based on expert opinion at each phase. Then finally ranked software metrics are trained using RBF-Neural Network. The subsections are discussed from proposed frame work in briefly. 3.1 Identify possible measures The possible selection of measure may be suitable to reliability and contain an enormous utility value. Which specify the purpose of measure’s capability to identify software reliability that is evaluated as high Many selections criteria are utilized in the software reliability metrics of their proposed methodology like as Test Accuracy, MTTR, Test Coverage, Defect Indices, Defect Density, Fault Density, Failure Rate, MTTF, Completeness, Number of conflicting requirements, Incorrect operation avoidance, Cyclamate Complexity, Requirement Traceability, Failure Avoidance and etc.
Software Engineering Measures Identify possible measures
22633 Identify experts and second level researchers
Assign some assessment
Expert judgment
Weights of criterion and prioritization
Collect opinions from experts
Aggregate opinion
Training and ranking the software measures by using RBF neural network
Final selection results of metrics in each phase and obtained measures
Figure 3.1. Proposed Architecture
3.2 Identify experts and second level experts Once the software metric is collected, every expert provides the opinion for all software measures based on the phase, then assign some phase level assessments to every top level experts and second level experts. After providing some opinions to all software measures based on their knowledge, collect some expert opinions. 3.3 Expert judgments The experts must to be select, to get most accurate estimates or judgments. However, the major issue is the exact result cannot be predicted through this method. So the criteria to manage the selection process should be formed. Then collects the opinion of experts and combine the rating and weighted value of every criteria and finally determine the weighted and rated value of all expert opinion.
22634
E.Umamaheswari, Dr. D.K.Ghosh and Dr.N.Bhalaji
3.4 Classification of experts’ opinion Expert opinion rating and calculated weighted measure as well as decisive factor are classified on basis of expert opinion at every level. The Radial Basis Function (RBF)Neural Network is utilized to classify the entire criteria. 3.5 Ranking of software measures After categorizing the entire criteria into expert’s opinion and at the same time process every software metrics is ranked depend upon the important factor and at last constructed a graded software metrics.
4. Software Measures using RBF neural network A Gaussian radial basis function (RBF) gives the same decision hyper plane as a type of neural network called as radial basis function (RBF) network, which are feedforward networks trained by using supervised training algorithm. They are classically constructed with only one hidden layer of units whose turn on function is chosen from a functions class termed as basis functions. In back propagation RBF network contains many advantages and they generally train the inputs are much faster than back propagation networks. The behavior of the single hidden layer is the main difference between networks and back propagation networks (that is, multi layer perception trained by Back Propagation algorithm). The hidden units in RBF network employ a Gaussian or some other basis kernel function while the hidden layer in the back propagation utilizes the sigmoidal or S-shaped activation function. Every hidden unit behaves as a locally tuned processor that computes a score for the match between the input vector and its connection weights or centers. Effectively, the basis units are very focused pattern detectors. To produce the final output the weights connecting the basis units to the outputs are used to take linear combinations of the hidden units. In this chapter initially the network structure will be introduced and then it explains about how it can be utilized for data interpolation and function approximation. Finally it will be describe how these network structure can be trained can be trained. 4.1 Radial basis function neural network Radial Basis Function Neural networks are algorithmic techniques, used to first learn the relationship between two sets of information, and then “generalize” to obtain new input-output pairs in a reasonable way. Neural networks could be theoretically used in software engineering to identify the measures and reliability in the software product. However, as there is currently no reliable way to understand what triggered the association; the neural network cannot explain the reasoning that led to the identification of the measure. In software engineering measures, neural networks have been mainly used to learn the behavior of actors in the system. Some equivalence between neural network models and statistics has been demonstrated. The usage of neural networks over statistics has the following advantages they are RBF is a simple way to express nonlinear relationships between variables, and learning or retraining the neural network automatically. However, neural networks are still a
Software Engineering Measures
22635
computationally intensive technique, and are not widely used by the software community. But, proposed neural network is testing the measures based on experts’ opinion very effectively. It consists of an input vector, a layer of RBF neurons, and an output layer with one node per category. The Input Vector The input vector is the n-dimensional vector. The entire input vector is shown to each of the RBF neurons. The RBF Neurons Each RBF neuron stores a prototype vector which is just one of the vectors from the training set. Each RBF neuron compares the input vector to its prototype, and outputs a value between 0 and 1 which is a measure of similarity. If the input is equal to the prototype, then the output of that RBF neuron will be 1. As the distance between the input and prototype grows, the response falls off exponentially towards 0. The shape of the RBF neuron’s response is a bell curve, as illustrated in the network architecture diagram. The neuron’s response value is also called its “activation” value. The prototype vector is also often called the neuron’s “center”, since it’s the value at the center of the bell curve. The output Nodes The output of the network consists of a set of nodes, one per category that is trying to classify. Each output node computes a sort of score for the associated category. Typically, a classification decision is made by assigning the input to the category with the highest score. The score is computed by taking a weighted sum of the activation value from every RBF neuron. By weighted sum it mean that an output node associates a weight value with each of the RBF neurons, and multiplies the neuron’s activation by this weight before adding it to the total response. Because each output node is computing the score for a different category, every output node has its own set of weights. The output node will typically give a positive weight to the RBF neurons that belongs to its category, and a negative weight to the others. Inputs of radial function neurons are radial numbers in D. Outputs of radial basis function neurons are radial numbers in S. For an input z, a radial basis neuron with activation function g(z) produces the output g(z). For z = x1 +y1 є D and it define the activation function g(z) as follows: (z) =
(x1 + x2 + ⋯ + xn, y1 + y2 + ⋯ . . +yn) → 1
Then its call this activation function g (z) the radial basis function. When it represent z = r exp in radial basis form, and write g(z) as output. From a geometrical point of view, g(z) is the intersection of curve S and the line passing through the origin and point z on the radial basis function (RBF). All inputs are combined into a single number, z, using the following weighted sum: =
wi xi + µ
→2
22636
E.Umamaheswari, Dr. D.K.Ghosh and Dr.N.Bhalaji
Where m is the number of inputs and wi is the weight associated with the i-th input (attribute) xi. The term m calculation is referred to numbers of input layer as bias terms. In statistical terminology it might be referred to as the intercept. The weights and bias terms calculation are estimated during training. The neural does not respond to its inputs unless Z is greater than zero. If Z is greater than zero then the output from this neural is set to 1. If Z is less than or equal to zero the output is zero:
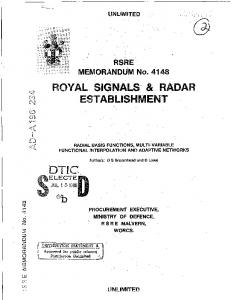
Where y is neural output. The function used for this calculation is referred to as the radial basis function as shown in Figure 4.2 below.
x1
Output
Weights w1
x2
x3
z w2
w3 g(z)
g(z)
Radial basis function
y=g(z) Output
Inputs
Fig. 4.2 RBF Neural Networks as Radial basis Function Perception
1. 2. 3. 4. 5.
As shown in Fig.4.2 consist of the following five components: Inputs – x1, x2, and x3, Input Weights – W1, W2, and W3, Potential = ∑ wi xi + µ , where μ is a bias correction Radial basis Function – g(Z), and Output – Y = g(Z).
The inputs can be either the initial raw data inputs or the output from another perception. The primary purpose of RBF neural network training is to estimate the weights associated with each perception’s potential. The radial basis function maps this potential to the perception’s output. First, define connection weights. Every neuron of the Network is connected to all other neurons. It denotes the connection weight from neuron j to neuron k by wkj. The connection weights must satisfy the following conditions:
Software Engineering Measures
22637
1) wkj є D; 2) wkj = wjk. It denotes the output of neuron k by zk and the weighted sum input Ik to neuron k as follows: g(z) =
Wkj Z j
Thus, Ik belongs to D. Neuron k receives the weighted sum input Wk, Xi, Yi and produces g (z) as output.
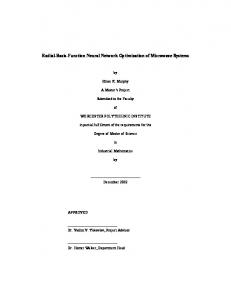
5. RESULT ANALYSIS The illustrated figure 6.1 shows the neural network performance. It shows that the training is completed at 6th epoch and the MSE (Mean Squared Error) is 10-1. Also the experimental results shows the number of software measures predicted from the raw experts opinion with calculated cumulative of matched software measures. The figure 6.2 shows the linear relationship between the cost overhead and productivity. The results are gathered from the previous software data. It shows the cost overhead is increased when the productivity is decreased.
COST 6 cost
4
5
4
2
3
2
0 a
b
b
b
1 e
0
COST
f
Productivity
Figure 6.1 Example of a cost overhead - productivity relationship.
E.Umamaheswari, Dr. D.K.Ghosh and Dr.N.Bhalaji M e a n S q u a r e E r r o r (m s e )
22638
1 Train
0.8
Validation
0.6
Test
0.4
Best
0.2
Goal
0 1
2
3
4
6 Epochs
Figure 6.2 Neural Network Performances
6. Conclusions RBF-Neural Network approaches are used to assess the Software Reliability effectively and efficiently. Thus the proposed research work is designed and implemented as an automated tool based on expert’s opinion. An automated tool is implemented with Radial Basis Function based neural network to identify wellformed software metrics for the given software product. This tool was used to evaluate the software quality and reliability. These reliable software measures are also gives the time duration information of future good quality software product. The proposed research results shows that the maximum software products reusability from the tested RBF-neural network measures. It also takes less execution time and less complexity for Ranked software metrics. In future, the different types of software engineering measures for expert opinions using RBFNN can be utilized.
7. References 1.
2.
3. 4.
E.Umamaheswari and D.K.Ghosh, “Software Quality: Dual Experts Opinion and Conditional Based Aggregation Method”,International Journal of Engineering and Technology,Vol 6,Issue 6 April 2014. E.Umamaheswari and D.K.Ghosh, ”Developing a reliability prediction system using multivariate analysis theory on software quality metrics”,International Journal of Emerging Technology in Computer science and Electronics,(IJETCSE), Vol 3, Issue 1 –November 2013. Hanna Kulas, Product Metrics in Agile Software Development, January 2012 Ali Idri,Abdeali Zakrani,Azeddine Zahi, ‘Design of Radial Basis Function Neural Networks For Software Effort Estimation’ , July 2010.
Software Engineering Measures 5.
6. 7. 8. 9. 10. 11.
22639
Nassar Jan and Muhammad Ibrar, ‘Systematic Mapping of Value- Based Software Engineering- A Systematic Review of Value Based Requirements Engineering’, December, 2010. Bhavendara Kumar sinha, Amit sinhal, ‘A Software Measurement Using Artificial Neural Network and Support Vector Machine’, july 2013. Pradeep Kumar Bhatia,yogesh singh, ‘Radial Basis Function Neural Network Based Approach To Test Oracle’, September 2011. Bonthu kotaiah, Dr. R.A. khan,A Survey on Reliability Assessment by Using Different Machine Learning Techniques, June 2012. Javir Vazquez, NitkaNaseri, ‘Software Reliability’, November 2012. Jitendra singh, L.s Maurya, Economic Aspect of Reliability Assessment and Prediction of Open Source Software- A Review , December 2012. Mr. Karamabir, jyoti tamak, ‘Use of Software Reliability Growth Models to Estimate Reliability of Web Applications’,june 2013.
22640
E.Umamaheswari, Dr. D.K.Ghosh and Dr.N.Bhalaji