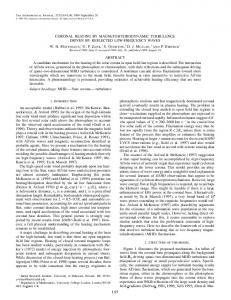
stationary line profile (Milligan et al. 2006). Figure 1. Simulated spectrum of an active region from a single TES pixel integrated over 10 seconds. The spectrum ...
Solving the Coronal Heating Problem using X-ray Microcalorimeters S. Christe1, S. Bandler1, E. DeLuca2, A. Caspi3, L. Golub2, R. Smith2, J. Allred1, J. W. Brosius4 , B. Dennis1, J. Klimchuk1 1 NASA Goddard Space Flight Center, Greenbelt, MD, USA; 2Harvard-Smithsonian Center for Astrophysics, Cambridge, MA, USA; 3Southwest Research Institute, Boulder, CO, USA; 4 Catholic University, Washington, DC, USA Even in the absence of resolved flares, the corona is heated to several million degrees. However, despite its importance for the structure, dynamics, and evolution of the solar atmosphere, the origin of this heating remains poorly understood. Several observational and theoretical considerations suggest that the heating is driven by small, impulsive energy bursts which could be Parker-style “nanoflares” (Parker 1988) that arise via reconnection within the tangled and twisted coronal magnetic field. The scale heights of coronal loops are clearly incompatible with static heating models (Petrie 2006). Recent models of the First Ionization Potential (FIP) effect where the ponderomotive force from Alfvén waves drives the fractionation (Laming 2009) strongly suggest the presence of impulsive events in the corona. The classical “smoking gun” (Klimchuk 2009; Cargill et al. 2013) for impulsive heating is the direct detection of widespread hot plasma (T > 6 MK) with a low emission measure. Tantalizing hints of hot plasma have been seen from the solar corona imaged in the light of Mg XII 8.42 Å (Zhitnik et al. 2006; Urnov et al. 2007), in emission measure analyses of spectra taken with Hinode/EIS (Patsourakos & Klimchuk 2009), with Hinode/XRT using different filter ratios (Reale et al. 2009; Schmelz et al. 2009) and/or in quiet sun observations with RHESSI (McTiernan 2009; Reale et al. 2009b) as well as two rocket-borne instruments (Brosius et al. 2014; Caspi et al. 2015). Modeling suggests that nanoflares should be followed by episodes of evaporation from the chromosphere, following heat conduction downwards. This upflow is predicted to be 50 to 100 km s-1. To date, such upflows have generally only been convincingly detected during solar flares (Brosius & Phillips 2004), when shifts of the entire line profile have been observed (Brosius 2003, 2013) or as a “shoulder” on the blue wing of an otherwise stationary line profile (Milligan et al. 2006). Figure 1. Simulated spectrum of an active region from a single TES pixel integrated over 10 seconds. The spectrum consists of two isothermal plasmas. The majority component is at 2 MK (blue, cool only). A hotter component at 10 MK has an emission measure that is 1% of the cooler component. The addition of the hot component (red) shows strong signatures from a number of additional highly ionized Fe lines.
These results have been obtained using a variety of technologies. Recent solar missions (Hinode, SOHO, IRIS) have used extreme ultraviolet (EUV) slit spectrographs to measure the velocity, temperature, and density in active regions and flares. EUV instruments have the advantage of very high spectral resolution across a wide range of emission lines. However, these devices have significant disadvantages. They require several minutes to scan (raster) across an active region. Furthermore since the exposure time determines the raster speed, selecting the correct exposure time is challenging for measuring temporally-varying features such as those found in active regions. The same can be said of Bragg Crystal Spectrometers. For EUV imagers which do not raster such as AIA on SDO, filter bandpasses are relatively broad compared to the underlying lines and frequently include low temperature emission which is difficult to isolate from the hot plasma. Additionally, EUV line spectroscopy has limited sensitivity to the very hottest temperatures, >20 MK, due to a lack of spectral lines from ion species formed at these temperatures.
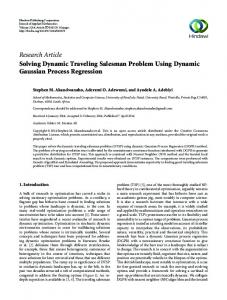
Figure 2. (left) Prototype TES X-ray microcalorimeter array with 35 µm pitch in which