th
Presented at the 8 Annual CMAS Conference, Chapel Hill, NC, October 19-21, 2009
SOURCE APPORTIONMENT OF PM10 IN BOGOTÁ, COLOMBIA Freddy Vargas Secretaría Distrital de Ambiente, Bogotá, Colombia
Néstor Rojas* Universidad Nacional de Colombia, Chemical and Environmental Engineering, Bogotá, Colombia
1. INTRODUCTION Bogota, Colombia’s capital, is the largest city in the country. Bogota has 7 million inhabitants, comprises 17% of the total population, and generates 23% of the national Gross Domestic Product (GDP). As a result of its economic growth, Bogota’s air is among the most polluted in Latin America. Analysis of monitoring network data shows that PM10 is the contaminant of most 3 concern in the city with values near 55 µg/m annual average, with some areas of the city 1; 2 experiencing higher values . Previous work regarding PM10 in Bogotá partially addressed characterization of air quality samples; especially 7 Pachón et al who analyzed samples for carbonaceous material, organic carbon (OC) and elemental carbon (EC), and water soluble ions 2+ 2+ + (SO4 , NO3 , NO2 , HCOO , Cl , NH4 , Ca2 , K , + Na ). They concluded that the carbonaceous fraction was about 60% of total PM10, and identified that secondary aerosol significantly contributed to PM10. However, recent work 8 disagrees with this result . Metals have been 9 analyzed and Ag, Cu, Zn, Fe, and Pb were 8 identified. Rivera and Behrentz ran a Principal Component Analysis (PCA) source apportionment for three sites in Bogotá, based on characterization of PM10 and PM2.5 samples. They = analyzed samples for ions (Cl , NO3 , SO4 and -3 + + + +2 +2 PO4 ; Na , NH4 , K , Mg and Ca ) and metals (Fe, Al, Mg, Ca, K, Mn, Ga, Ba, Na, Cr, Ni, Zn, Cu), but not for carbonaceous material so the contribution of carbon to PM10 in the city could not be assessed. In order to better understand the origin of PM10 in Bogotá, this study shows the results of characterization and source apportionment of air quality measurements at two different sites. The work focuses on PM10 because this is the size
fraction for which the Colombian PM standard for air quality is regulated.
2. EXPERIMENTAL Two sites were chosen in different zones of the city. A total of 110 daily samples were collected, 55 at every site 1 (Suba) and 2 (Carvajal. Sites 1 is mostly residential, while site 2 has apartments and medium-size industries nearby. Sampling site selection addressed neighborhood-scale EPA criteria. Harvard impactors for PM10 were used with a flow between 9.5 and 10.5 L/min at Bogota’s environmental conditions (15ºC, 560 mmHg). Quartz and PTFE 37 mm filters were used at every site. Filters were conditioned for 24 hours at 15 ºC and 45±5% RH prior to gravimetric analysis before and after the sampling period. After gravimetric analysis, the filters were kept refrigerated (-5ºC) to avoid volatilization of some components. The samples were analyzed at the Georgia Institute of Technology for organic carbon (OC) and elemental carbon (EC) using Thermal Optical Transmittance (Sunset Labs TOT), and water 2= soluble ions (SO4 , NO3 , NO2 , Oxalate , Cl , + + + + NH4 , Ca , K , Na ) using ion chromatography IC (Dionex300DX). Energy Dispersive – X-Ray Fluorescence (ED-XRF) was performed in the Alpha 1 Lab in Bogotá, following EPA Method IO3.3. Based on characterization data PMF software was used. The uncertainties were calculated for every characterization method and species. The numbers of factors tested were between 3 and 7 until the best adjustment to data results was achieved.
*Corresponding author: Néstor Rojas. Chemical and Environmental Engineering. Carrera 30 # 45 – 03. Laboratorio de Ingeniería Química. Oficina 206. National University of Colombia. Bogotá, Colombia. email:
[email protected]
1
th
Presented at the 8 Annual CMAS Conference, Chapel Hill, NC, October 19-21, 2009
3. RESULTS AND DISCUSSION The PM10 concentrations found were lower than the expected; the box plots are shown in figure 1.
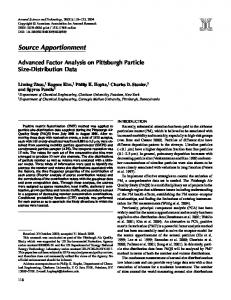
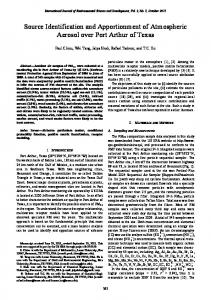
Fig. 2. Elemental Carbon vs. Organic Carbon The sampling points have different OC vs. EC relationships; this may be due to different sources near the sites or to differing meteorological 14 conditions . . Based on characterization data, a mass closure was calculated following Lewis et 12 al . From ionic analysis, carbonate ion was identified and taken into account for mass closure as calcium carbonate. Déficit aniónico vs. Ca+2 Suba
[Cations - Anions] µ eq/m3
0,125
0,075
Fig. 1. Box plots PM10 concentration
y = 0,926x - 0,018 R² = 0,829
0,025
The largest component of PM10 is, by far, the carbonaceous fraction accounting for 50 to 65 % of the mass. Figure 2 shows the relationship between OC and EC. This relationship is related to the diesel sulfur content. Diesel sulfur was 1200 ppm during the sampling period; however, currently diesel sulfur is 300 ppm due to reduction of sulfur by the Colombian oil company in second 15 quarter 2009 . The relationship between OC and EC is also a function of the use of aged buses in the traditional transportation system and of the 8 driving patterns in Bogotá .
0
0,05
-0,025
0,1
0,15
Ca+2 µ eq/m3
Déficit aniónico vs. Ca+2 Carvajal
(Cations - Anions) µ eq/m3
0,15
0,1
0,05
y = 0,942x - 0,018 R² = 0,737 0 0
-0,05
0,05
0,1
0,15
0,2
Ca+2 µ eq/m3
Fig. 3. Calculated calcium carbonate vs. calcium ion
2
th
Presented at the 8 Annual CMAS Conference, Chapel Hill, NC, October 19-21, 2009
13
Organic matter was calculated as 1.6*OC . Secondary pollutants: this factor shows nitrate The PM10 mass closure is shown in Figure 3 and sulfate together (unidentified mass is between 5 to 10%, not shown). Ionic long range transportation: Presence of ammonium, chloride and sodium ion. Table. 1. Factors Resolved for Suba. The apportionment of each factor are shown in Factor % Apport Mobile 60 Dust 9 Secondary pollutants 13 Ionic 18 Table. 2. Factor Apportionment in Suba
Mobile: this includes the major portion of EC, OC +2 and some Ca , associate to CaCO3.
Fig. 3. Mass closure The PMF model was run independently for every site. Our preliminary finding is that factors identified are similar with a huge portion of PM10 associated with mobile sources. The Factors identified are shown in the next figures:
Mobile: this includes the major portion of EC, +2 OC and some Ca , associate to CaCO3.
Dust: factor that is characterized by the content of Al, Si, K, Fe and Ti. There are OC and EC too.
Dust: factor that is characterized by the content of Al, Si, K, Fe and Ti. There are OC and EC too.
Smelting non ferrous: this factor has Zn, Pb and Mn. Near the receptor site there is and semelter process
Nitrate rich/movil: high content of nitrate, 20% Ec and OC, a huge portion of Pb and Sb.
Sulfate rich: There is the highest content of sulfate. Tabla 3. Factors Resolved for Carvajal. The apportionment of each factor are shown in Table 4.
3
th
Presented at the 8 Annual CMAS Conference, Chapel Hill, NC, October 19-21, 2009
Factor Mobile Dust Nitrate rich/mobile Sulfate rich Smelting non ferrous
% Apport 35.3 20.8 20.7 13 10.2
Table. 4. Factor Apportionment in Carvajal As shown, the main factor is mobile, composed of mobile sources and associated dust. The dust factor is associated with fugitive windblown dust. In Carvajal dust is 20.8% of total PM10 and to Suba where dust is 9%, this difference among sites is mainly due is the proximity of the sites to unpaved roads. Industrial factors are higher in Carvajal, which may be due to the medium size industries in the sector. This site also shows higher concentrations of Pb, Cd, and Zn. The percentage of secondary pollutants is higher in the factor apportionment than in the chemical analysis; the additional mass is related to the EC, OC, and some crustal material related to these factors.
4. CONCLUSIONS The major apportion to PM10 in Bogotá are associated to carbonaceous fractions which are mainly produced by combustion process. These fractions are more than 50% of PM10. Crustal fractions, associated to resuspended matter and fugitive dust are a great part of PM10 and it is between 36 y un 38%. The ionic fraction was found between 5 and 8 %. These results show that the composition and levels of PM10 in Bogotá varied significantly among sites, however systematic sampling and characterization of PM10 and PM2.5 is needed in order to increase the samples numbers and improve PMF results. Further research is needed for PM2.5 composition and source apportionment as well as additional monitoring should be conducted at different sites in the city to better understand the spatial variability in PM composition.
5. REFERENCES El Tiempo. 2009. Nivel de azufre en diésel será de 50 partes por millón de azufre en 2009 . www.eltiempo.com, March 13, sec.
Bogotá. http://www.eltiempo.com/colombia/bogota/ nivel-de-azufre-en-diesel-sera-de-50partes-por-millon-de-azufre-en2009_4691336-1. Gaitán, Mauricio, Juliana Cancino, and Eduardo Behrentz. 2007. Análisis del estado de la calidad del aire en Bogotá. Revista de Ingeniería - UniAndes, no. 26 (November): 81-92. Kroll, Jesse H., and John H. Seinfeld. 2008. Chemistry of secondary organic aerosol: Formation and evolution of low-volatility organics in the atmosphere. Atmospheric Environment 42, no. 16 (May): 3593-3624. doi:10.1016/j.atmosenv.2008.01.003. Lewis, Charles, Gary Norris, Teri Conner, and Ronald Henry. 2003. Source Apportionment of Phoenix PM2.5 Aerosol with the Unmix Receptor Model. Journal of the Air & Waste Management Association 53 (March): 325-338. MMAVDT, and IDEAM. 2007. Informe anual sobre el Estado del Medio Ambiente y los Recursos Naturales Renovables en Colombia: Calidad del Aire. IDEAM. http://www.ideam.gov.co/infoanual/PDFSe ccionados/CalidadAirePreliminares.pdf. Pachon, J., A. Russell, H. Sarmiento, and B. Galvis. 2008. Identification of secondary aerosol formation in Bogota: a preliminary study. In . Portland: A&WMA, June. Pachón, J., and H. Sarmiento. 2008. Análisis espacio-temporal de la concentración de metales pesados en la localidad de Puente Aranda de Bogotá-Colombia. Revista de Ingeniería Universidad de Antioquia, no. 47 (March): 120-133. Rivera, Juliana, and Eduardo Behrentz. 2009. Identificación de fuentes de contaminación por material partuclado en Bogotá. Master, Universidad de Los Andes. Rodríguez, P., and Behrentz, E. 2009. Actualización del inventario de emisiones de fuentes móviles para la ciudad de Bogotá a traves de mediciones directas. Master, Universidad de Los Andes. http://biblioteca.uniandes.edu.co/Tesis_12 009_primer_semestre/524.pdf. Turpin, Barbara, and H. J. Lim. 2001. Species Contributions to PM2.5 Mass Concentrations: Revisiting Common Assumptions for Estimating Organic Mass. Aerosol Science and Technology 35 (July 1): 602-610.
4