Sawant Ramesh et al. IRJP 2012, 3 (5)
INTERNATIONAL RESEARCH JOURNAL OF PHARMACY www.irjponline.com
ISSN 2230 – 8407
Research Article SPECTROPHOTOMETRIC METHODS FOR SIMULTANEOUS ESTIMATION OF ATORVASTATIN AND NIACIN IN TABLET DOSAGE FORM Sawant Ramesh*, Ahmed Raihan, Ramdin Supriya, Darade Sheetal Department of Pharmaceutical Chemistry and PG studies, Padmashree Dr. Vithalrao Vikhe Patil Foundation’s College of Pharmacy, Vilad Ghat, Ahmednagar, Maharashtra, India Article Received on: 04/03/12 Revised on: 10/04/12 Approved for publication: 21/04/12
*Dr. Ramesh L. Sawant, Professor and Head, Department of Pharmaceutical Chemistry and PG Studies, Padmashree Dr. Vithalrao Vikhe Patil Foundation’s College of Pharmacy, Vilad Ghat, Ahmednagar – 414 111 Maharashtra, India E-mail:
[email protected] ABSTRACT Two UV spectrophotometric methods were developed and validated for quantitative determination of atorvastatin (ATR) and niacin (NIA) in tablet dosage form. Method I is based on the simultaneous equation, and method II is based on the absorbance ratio method. The absorption maxima were found to be at 246 nm and 262 nm in methanol for the atorvastatin and niacin respectively. Beer's law is obeyed in the concentration range of 5-25 µg/ml with correlation coefficient within range of 0.996 - 0.999 for both the drugs. The accuracy of the methods was assessed by recovery studies and found to be 99.77 ± 0.34 and 99.97 ± 0.17 by the simultaneous equation method, where as 99.78 ± 0.49 and 99.98 ± 0.39 by the absorbance ratio method for atorvastatin and niacin respectively. KEYWORDS: Simultaneous equation method, absorption ratio method, atorvastatin, niacin
INTRODUCTION Atorvastatin (ATR) is a synthetic hydroxyl methyl glutaryl coenzyme A (HMG‐CoA) reductase inhibitor that has been used as a lipid lowering agent. Chemically ATR is [R‐(R*, R*)] dihydroxy ‐2‐(4‐flurophenyl) ‐B,B ‐5‐(1‐methylethyl)‐3‐phenyl‐4 ‐[(phenyl amino) carbonyl] ‐1H‐ pyrrole‐1‐ heptanoic acid (Figure 1). ATR is a competitive inhibitor of HMG‐CoA reductase. This enzyme catalyzes the reduction of 3‐hydroxy ‐3‐ methyl gultaryl ‐ coenzyme‐A to mevalonate, which is the rate‐determining step in hepatic cholesterol synthesis. ATR is official in Indian Pharmacopoeia1. Literature survey revealed several methods based on different techniques like spectrometric method2-6, HPLC7, HPTLC8, LCMS/MS9 for its determination in pharmaceuticals and its metabolites in serum. Niacin (NIA) chemically designated as pyridine 3 carboxylic acid (Figure 2) which reduce triglyceride levels, is also effective for increasing serum HDL levels10. It has also been demonstrated that this drug lowers the incidence of coronary heart disease in humans11. A number of analytical methods have been developed for its determination in pharmaceutical formulations or in biofluids either alone or in combination with other drugs. These include determination of niacin by HPLC12, flow injection TLC13, HPTLC14, capillary electrophoretic15 and tandem mass spectrometry16. A combination of ATR and NIA is commercially available in tablet dosage form. Literature survey reveals that RP-HPLC17 method is available for the simultaneous determination of these two drugs in combination but no UV spectrophotometric method is available. So we communicate here rapid and cost effective quality control tool for their routine quantitative analysis in pure and combined dosage forms by UV-spectrophotometry. MATERIAL AND METHODS Instrumentation A UV–Visible double beam spectrophotometer of Jasco Model: V-630, with a fixed bandwidth 2 nm and a pair of 1cm matched quartz cell were used for all spectrophotometric measurements.
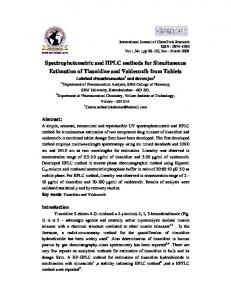
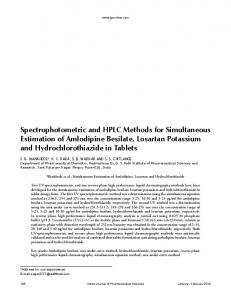
Selection of common solvent After assessing the solubility of both drugs in different solvents methanol was selected as a common solvent for developing spectral characteristics. Preparation of standard solution The standard stock solutions of ATR and NIA were prepared by dissolving 10 mg of each drug in 40 ml of methanol and final volume was adjusted with methanol to get a solution containing 100 μg/ml of each drug. For the selection of analytical wavelength, standard solution of ATR (20 μg/ml) and NIA (20 μg/ml) were prepared separately by appropriate dilution of standard stock solution with methanol and scanned in the entire UV range to determine λmax of both the drugs. The λmax of ATR and NIA were found to be 246 nm and 262 nm, respectively and 258 nm as λmax of common absorbance (isobestic wavelength). A series of standard solutions were prepared having concentration in the range of 5-25μg/ml for both ATR and NIA. The absorbance of resulting solutions was measured at 246 nm, 258 and 262 nm, and calibration curves were plotted. Both the drugs obeyed linearity in the concentration range under study. The standard calibration curve of ATR and NIA are shown in Figure 3 and 4. Method I: Simultaneous equation method This method of analysis was based on the absorption of ATR and NIA at the wavelength maximum of each other. Two wavelengths selected for the development of simultaneous equations were 246 nm and 262 nm which were λmax of ATR and NIA respectively. The absorbances of ATR and NIA were measured at the selected wavelengths. The absorptivity values E (1%, 1cm) were determined for both the drugs at the selected wavelengths. These values were mean of five estimations. Overlain spectra of ATR and NIA are shown in Figure 5 respectively. The concentration of both drugs in mixture can be calculated by using following equationsEq (1) Cx = A1ay2 –A2ay1 / ax1ay2 – ax2ay1 Cy = A1ax2 -A2ax1 / ay1ax2 - ay2ax1 Eq (2)
Page 364
Sawant Ramesh et al. IRJP 2012, 3 (5) Where, A1 and A2 are absorbances of mixture at 246 and 262 nm respectively. ax1 and ax2 are absorptivities of ATR at 246 and 262 nm respectively. ay1 and ay2 are the absorptivities of NIA at 246 and 262 nm respectively. Cx and Cy are the concentrations of ATR and NIA respectively. Analysis of marketed formulation Twenty tablets were accurately weighed; average weight was determined and finely powdered. An accurately weighed quantity of tablet powder equivalent to 20 mg of ATR was transferred to 100 ml volumetric flask and dissolved by sonication with sufficient quantity of methanol and volume was made to the mark with methanol. The solution was then filtered through Whatmann filter paper no. 41. A 1ml portion of the filtrate was taken in 10 ml volumetric flask and final volume was adjusted with methanol. The above mixture was analyzed at 246, 258 and 262 nm wavelengths and values of the absorbance were substituted in respective equations (Eqn. 1 to 4) to obtain the content of ATR and NIA respectively. The result of analysis is mentioned in Table 1. Method II: Absorption ratio method In quantitative assay of two components by absorption ratio method (Q-analysis), absorbances were measured at the isobestic wavelength (258 nm) and maximum absorption of one of the two components. From overlain spectra of ATR and NIA shown in Figure 5, absorbances were measured at the selected wavelengths of 258 nm (isobestic wavelength) and 246 nm (wavelength of maximum absorption of ATR). From the following sets of equations, the concentration of each component in sample solution can be calculated. Cx = (Q0-Q2) x A1 / (Q1-Q2) x a1 ...Eq (3) Cy = (Q0-Q1) x A1 / (Q2-Q1) x a2 …..Eq (4) Where, Cx and Cy are the concentration of ATR and NIA respectively. A1 = absorbance of sample at 258 nm Q0 = (absorbance of sample at 246 nm)/ (absorbance of sample at 258 nm) Q1 = (absorptivity of ATR at 262 nm)/ (absorptivity of ATR at 258 nm) Q2 = (absorptivity of NIA at 246 nm)/ (absorptivity of NIA at 258 nm) a1 and a2 are the absorptivity values of ATR and NIA at 258 nm respectively. RESULTS AND DISCUSSION The developed methods for simultaneous estimation of ATR and NIA were validated as per ICH guidelines. Accuracy To check the accuracy of the developed methods and to study the interference of formulation additives, recovery studies were carried out by standard addition method at three different levels (80%, 100% and 120%). The results of recovery studies expressed as percent recovery were satisfactory and are presented in Table 2. Intermediate precision (inter-day and intra-day precision) The reproducibility of the proposed methods was determined by analyzing tablets at different time intervals on same day (Intra-day assay precision) and on three different days (Interday assay precision). The results are presented in Table 3.
Limit of detection (LOD) and limit of quantitation (LOQ) The LOD and LOQ were separately determined based on the standard deviation of y-intercept of the calibration curve. The limit of detection (LOD) and limit of quantification (LOQ) were determined by visual methods as suggested in ICH guidelines, which were found to be as per given in Table 3. CONCLUSION The proposed UV spectrophotometric methods were tested and validated for various parameters according to ICH guidelines and can be used for routine analysis of atorvastatin and niacin in pharmaceutical dosage forms as a quality control tool. REFERENCES 1. Indian Pharmacopoeia, Published by the Government of India, Ministry of Health and Family Welfare. The Indian Pharmacopoeia Commission: New Delhi; 2010. 2. Hasan M, Ahmed Z, Amin MR, Sherin NS. Development and Validation of a Spectrophotometric Method for Determination of Atrovastatin Calcium in Bulk Drug and Pharmaceutical Formulation. Inter J Pharma Res Devel 2011; 2: 116-121. 3. Wankhede SB. Validated Spectrophotometric Methods for Quantitative Determination of Metoprolol Succinate and Atorvastatin Calcium in Capsules. Der Pharma Chemica 2010; 2: 134-140. 4. Karajgi SR, Zambare YB. Simultaneous Estimation of Atorvastatin and Ramipril by First Derivative Spectrophotometric Method. J of Pharm Res 2009; 2: 874-877. 5. Deepti J, Khan MR. Simultaneous Spectrophotometric Determination of Atorvastatin Calcium and Amlodipine Besylate in Tablet. Indian J Pharm Sci 2006; 68: 546-548. 6. Zambare YB, Karajgi SR, Simpi CC. Simultaneous Estimation of Atorvastatin and Ramipril by First Derivative Spectrophotometric method. J Pharm Res 2009; 2: 874-877. 7. Gupta KR, Askarkar SS, Wadodkar SG. Stability Indicating RP-HPLC Method for Simultaneous Determination of Atorvastatin and Nicotinic Acid from Their Combined Dosage Form. Eurasian J Anal Chem 2009; 4: 294-303. Choudhari BH, Patel NM. Simultaneous Estimation of Atorvastatin and 8. Fenofibrate from Formulation by HPTLC. Indian Drugs 2004; 44: 378383. 9. Rajan KV, Mandal DS, Solomon U, Selvan WDS, Bose PS, Sarkar A, et al. Bioequivaleance Study of Fixed Dose Combination of Atorvastatin and Ezetimibe Tablet in Healthy Volunteers by LCMS/ MS Method. Asian J Chem 2007; 2: 1293-1300. 10. Susman. Niacin Reduces Triglycerides, Increases Good Cholesterol in Diabetics. Doctors Guide Publishing Limited. 1995. 11. Brown BG, Zhao XQ, Chait A, Fisher LD, Cheung MC, Morse JS, et al. Simvastatin and Niacin, Antioxidant Vitamins, or the Combination for the Prevention of Coronary Disease. N Engl J Med 2001; 345: 1583-1592. 12. Nagi RN, Venkateshwara R, Jayapal RG, Adukondalu D, Raja Abhilash P, Karunakar K. New Validated RP-HPLC Method for the Simultaneous Estimation of Niacin and its Metabolite 1Methylnicotinamide in Rat Plasma. IJPBS 2011; 1: 479-483. 13. Sarangi B, Chatterjee SK, Dutta K,Das SK. Thin Layer Chromatographic Identification and Quantitation of Niacin and Niacinamide in Pharmaceutical Preparations. J Assoc Anal Chem 1985; 68: 547-549. 14. Tiwari PK, Sathe P. Development and Validation of HPTLC Method for Niacin and Simvastatin in Binary Combination. Advan Biosci Biotech 2010; 1: 131-135. 15. Zarzycki PK, Kawalski P, Nowakowska J, Lamparczyk H. HPLC and Capillary Electrophoretic Determination of Free Nicotinic Acid in Human Plasma and Separation of its Metabolites by Capillary Electrophoresis. J Chomatogr A 1995; 709: 203-208. 16. Hsieh Y, Chen J. Simultaneous Determination of Nicotinic Acid and its Metabolites using Hydrophilic Interaction Chromatography with Tandem Mass Spectrometry. Rapid Commun Mass Spectro 2005; 19: 3031-3036. 17. Suma BV, Kannan K, Madhavan V, Nayar CR. Simultaneous Estimation and Validation of Atorvastatin Calcium and Nicotinic Acid in Combined Tablet Dosage Form by RP-HPLC Method. Int J Pharm Pharm Sci 2012; 4: 369-373.
Page 365
Sawant Ramesh et al. IRJP 2012, 3 (5) Drug
Table 1: RESULT OF TABLET ANALYSIS Amount of drug estimated (mg/tablet) Method I Method II 10.01 9.96 374.77 374.62
Label claim (mg/tablet) 10 375
ATR NIA
% Label claim estimated ± S.D.* Method I Method II 100.1± 0.34 99.6± 0.49 99.94± 0.17 99.9± 0.39
* Mean of six determinations
Method I
II
Table 2: RESULT OF RECOVERY STUDIES % Recovery ± S.D. # Level of recovery (%) ATR NIA 99.75 ±0.0456 99.55±0.1045 80 100.01 ± 0.0345 99.97±0.3567 100 99.89±0.2321 99.76±0.5578 120 80
99.55±0.2341
99.43±0.3784
100 120
99.99±0.1679 100.01±0.2451
99.63±0.234 99.99±0.2452
#Mean of three determinations. SD: Standard deviation. Table 3: OPTICAL CHARACTERISTICS AND VALIDATION PARAMETERS Statistical parameters λ max (nm) Concentration range (μg/ml)
ATR
NIA
246 5-25
258 5-25
262 5-25
258 5-25
0.0533 0.0445
0.042 0.023
0.0475 0.0097
0.0448 0.0082
0.9964 0.2823 0..8554
0.998 0.201 0.609
0.9988 0.2952 0.8945
0.999 0.1568 0.4751
0.1507
0.0572
0.2231
0.0662
0.1705 0.5816 * COV: Coefficient of variance
0.2563
0.6922
Regression equation (y = mx + c ) Slope (m) Intercept (c) Correlation coefficient (r2) LOD (μg/ml) LOQ (μg/ml) Precision (COV*) Interday (n = 3) Intraday (n = 3)
H3C O NH
CH3
OH O
N OH
OH
F
Fig 1. Chemical structure of ATR
O OH N Fig 2. Chemical structure of NIA
Page 366
Sawant Ramesh et al. IRJP 2012, 3 (5)
Fig. 3: Standard calibration curve of ATR
Fig.4: Standard calibration curve of NIA
Fig 5: Overlain spectra of ATR and NIA
Source of support: Nil, Conflict of interest: None Declared
Page 367