Solar cells or photovoltaic (PV) cells are devices that convert sunlight directly into ... In this paper, simulation circuits of PV cells, modules and arrays have been ...
International Journal of Engineering Science Invention ISSN (Online): 2319 – 6734, ISSN (Print): 2319 – 6726 www.ijesi.org Volume 2 Issue 5 ǁ May. 2013 ǁ PP.68-73
Spice Based Modelling and Simulation to Study the Effects of Partial Shading on PV Array Characteristics Reena Rathee1, Vandana Khanna2, B.K.Das3 1, 2, 3
(Department of Electrical, Electronics & Communication Engineering, ITM University, India)
ABSTRACT : The simulation based study of PV cells/arrays using circuit simulator LT-Spice is presented in this paper. The LT-Spice is an analog/digital circuit simulator which calculates voltage and current in a circuit This feature of LT-Spice is used to model and simulate the circuits of PV cells/arrays. Effect of two environmental parameters of irradiance and temperature is observed from the simulated characteristics. Under Partial Shading Conditions (PSC) the power from the PV array can be dramatically reduced and Maximum Power Point Tracking (MPPT) points are affected. Hence, to improve the performance of PV arrays the bypass and blocking diodes are used and their effect on open-circuit voltage (Voc), maximum power output (Pm), voltage at maximum power output (Vm) and the corresponding current at maximum power output (I m) is observed. Keywords -Current at MPP (Im), Maximum power (Pm), Maximum Power Point (MPP), Two-diode model, Voltage at MPP (Vm)
I.
INTRODUCTION
The research in renewable energy has become an increasingly important topic in the 21st century with the problem of energy crisis becoming more and more aggravated, resulting in increased exploitation and search for new sustainable and renewable sources of energy. Solar energy is inexhaustible, environmental-friendly, distributed throughout the earth and includes easy maintenance. Due to this, photovoltaic solar energy has been increasingly used to generate electric power from sunshine.The direct conversion of solar radiation into electricity is known as photovoltaic (PV) energyconversion because it is based on the photovoltaic effect. The photovoltaic effect means the generation of a potential difference at the junction of two different materials in response to visible or other radiation. Photovoltaic literally means “light-electricity” as “photo” means light and “volt” is an abbreviation of Alessandro Volta’s name who was a pioneer in the study of electricity. Since a layman does not know the meaning of the word photovoltaic, a popular and common term referring to PV solar energy is solar electricity. Solar cells or photovoltaic (PV) cells are devices that convert sunlight directly into electric energy using silicon (or other material) PN junction. A PV cell is a basic unit that generates voltage in the range of 0.5 to 0.8 volts depending on cell technology used. This small generation is not of much commercial use if these cells are not integrated and connected together in a module to give the handsome voltage atleast to charge a standard battery of 12 volts. Thus, what we see physically in a PV system is the commercially available module; which are further connected in series and parallel to form a PV system as per the system requirement of voltage and the current [3,4]. To experiment with PV cells in the laboratory is a time-consuming and costly task. So, to overcome this problem, simulations techniques are used to simulate the behavior of PV cells under different conditions .Several simulation softwares are available now days. PSpice has been used for the study of silicon solar cells and modules constructed from such series connected cells-strings[2,4]. The simple study carried out leads to valuable information that would be useful in the design of PV modules and power supply systems utilizing such PV modules as their basic energy source. The most important component that affects the accuracy of simulation is the PV cell modeling. In real solar cell, the recombination represents a substantial loss, especially at low voltages or low insolation. This cannot be adequately modeled using a single-diode model. For improved accuracy, the two-diode model [1] was proposed. The performance of PV array is affected by temperature, solar insolation, shading and array configuration. Under PSCs, the PV characteristics get more complex with multiple peaks. Hence, it is important to understand and predict them in order to extract the maximum possible power [5]. In this paper, simulation circuits of PV cells, modules and arrays have been developed to study the effect of two environmental parameters of irradiance and temperature. The effect of introduction of bypass and blocking diodes in the PV arrays has been observed. The paper deals with the simulation studies of PV cells and arrays under the effect of partial shading. www.ijesi.org
68 | Page
Spice Based Modeling and Simulation to Study the Effects of… II.
PV module modelling
The most important component that affects the accuracy of the simulation is the PV cell model. Modelling of PV cell involves the estimation of the I-V and P-V characteristic curves to emulate the real cell under various environmental conditions. The equivalent circuit diagram of the PV cell is shown below:-
Fig.1: Equivalent circuit of PV cell The output current of the cell can be given as:𝑉+𝐼𝑅𝑠
𝑉+𝐼𝑅𝑠
𝐼 = 𝐼𝐿 − 𝐼01 [𝑒 𝑎 1 𝑉 𝑡1 − 1] − 𝐼02 [𝑒 𝑎 2 𝑉 𝑡2 − 1] − (
𝑉+𝐼𝑅𝑠 𝑅𝑝
)
Where, ILis the illumination current i.e. the current induced by the cell. 𝐼𝑟0 𝐼𝐿 = 𝐼𝐿0 × , 𝑉𝑡1,2 =
𝑁𝑠 𝑘𝑇
𝐼𝑟
(1) (2) (3)
𝑞
2
Ir is the irradiance (light intensity) in W/m falling on the cell. IL0 is the measured illuminated or photo-generated current for the standard irradiance I r0. I01 and I02 are the reverse saturation currents of diode1 and diode2 respectively. V is the voltage across the solar cell electrical ports. I is the output current of the cell. Vt1, 2 is the thermal voltage of the PV module having Ns cells connected in series. q is the electron charge (1.6 × 10⁻¹⁹ C). K is the Boltzmann constant (1.38 × 10⁻²³ J/K) T is the measurement temperature parameter value. a1 and a2 are the ideality factors of diode1 and diode2 respectively.
III.
THE SOLAR CELL/ARRAY STUDY
In each of the simulations carried out, a set of curves for I-V characteristics and P-V characteristics have been obtained. The values of Voc, Pm, Vm and Im have been tabulated for each case. III.1.
SINGLE PV CELL
The effect of shading on a single cell has been observed. I L corresponds to the amount of sunlight incident on the cell. Thus, by varying the values of IL the amount of incident sunlight has been varied.IL is the illuminated current which is the corresponding current value of the irradiance level. The diodes used for the two-diode model have the following specifications: MUR460: .model MUR460 D (Is=149n Rs=0.0384 N=2 EG=1.285 XT1=5 BV=800 IBV=1e-0.5 Cip=126.4p Vj=1.34 M=52 tt=44.4n Iave=4 Vpk=600 mfg=GI type=silicon) MURS320: .model MURS320 D (Is=1.06n Rs=0.0111 N=1.367 C jo=135p M=0.45 tt=45n Iave=3 Vpk =200 mfg=0n semi type=silicon).Rs is the series resistance that accounts for the overall voltage drop that the carriers encounter in moving from where they are generated to the points of metal contacts of the cell. Rsh is the shunt leakage resistance which accounts for the formulation of hotspot due to shadowing of a cell in a model. I01 =1n, I02 =10n, T=25˚C, a1 =1 and a2 =2 were taken into account. III.2.
PV MODULE
In a PV module, 36 cells have been connected in series because 17-18V output voltage is produced which makes it compatible with 12V applications. A simple symbol has been generated to depict the single solar cell circuit so that it can be connected in series to form PV modules with less consumption of time. The PV modules were then arranged in series-parallel configuration to form PV array.
III.3.
PV ARRAY WITH DIFFERENT SHADING PATTERNS
The PV arrays have been formed to have larger output power. Practically, they were installated for generating power or electricity. The simulations were carried at different temperatures in order to study the www.ijesi.org
69 | Page
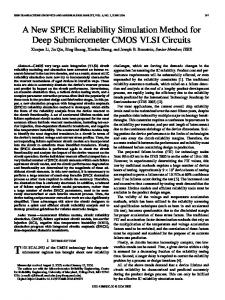
Spice Based Modeling and Simulation to Study the Effects of… effect of temperature and shading on the I-V and P-V characteristics of the array.The PV array of 20 × 3 configuration has been used for studying the effect of shading, where 20 and 3 represent the number of series and parallel modules connected in the array. This array has further been divided into four groups, each having 5 × 3 configuration. Different shading patterns have been given to the four groups at 25˚C and 50 ˚C.The different shading patterns that have been used are listed below:Case:1: Type A: with no shading (Group A, B, C, D=1) Case-2: Type B: with partial shading (Group A=1, Group B=1, Group C=1, Group D=0.75) Case-3: Type C: with partial shading (Group A=1, Group B=1, Group C=0.75, Group D=0.5) Case-4: Type D: with partial shading (Group A=1, Group B=0.75, Group C=0.5, Group D=0.25) Where, 1 corresponds to illumination current of 4A. Likewise, 0.75, 0.5 and 0.25 corresponds to 3A, 2A and 1A illumination current respectively. The shading pattern of type D has been clearly shown in Fig.2. Here, the group with blue series-connected modules depicts that 4A illumination current has been provided while grey, pink and yellow depicts 3A, 2A and 1A illumination current respectively.Similarly the circuits with other shading pattern configurations can be developed easily.
Fig.2: PV array with type D shading pattern The simulation study of PV array with different levels of irradiance at 25˚C and 50 ˚C have been carried out effectively.
III.4.
EFFECT OF BYPASS DIODE
The bypass diode was connected to each PV module to prevent hot spot formation in the PV array. The type D shading pattern has been used to clearly explain the effect of shading. However, the simulations have also been carried out for the other shading patterns. During Uniform Shading Condition (USC), the entire PV modules generate same amount of current. However, the shaded cell will generate less current during PSC. The shaded module limits the overall current generation of the PV array. As a result, the solar cells get reversebiased due to the mismatched effect and dissipate power in the form of heat.
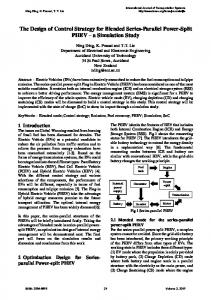
Fig.3: PV array with bypass diodes in type D shading pattern Hence, the shaded cells start consuming instead of generating power as reverse current flowsacross the shaded cells, thus reducing the generated output power. In order to avoid this, the bypass diodes are connected in parallel across each PV module of the array with the above mentioned shading patterns. The bypass diode provides a path to bypass the reverse current across the PV module and hence all the cells of the module become forward-biased. III.5.
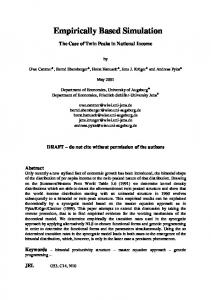
EFFECT OF BLOCKING DIODE The blocking diodes were connected in series with the string of series connected PV modules in order to avoid current imbalance caused by shading. The function of blocking diode is to prevent the reverse flow of current particularly from the secondary power sources such as batteries or inverters during the absence of light. It has been used for all the above mentioned shading patterns. The simulations have been carried out for all the above mentioned shading patterns while Fig.3 shows the type D configuration clearly.
www.ijesi.org
70 | Page
Spice Based Modeling and Simulation to Study the Effects of…
Fig.4: PV array with bypass and blocking diodes in type D shading pattern Besides removing the current imbalance condition, blocking diode prevents the module from loading the battery at night by avoiding current flow from the battery through the PV array.
IV.
SIMULATION RESULTS
This section describes the usefulness of the proposed simulation circuits in simulating and understanding the effect of bypass and blocking diodes in array configuration with different shading patterns. IV.1.
ILLUSTRATION 1 Theeffect of shading on the PV characteristics has been simulated for the single PV cell.
Fig.5: I-V & P-V characteristic curves for the single
Table1: Shading effect on single PV cell
PV cell Where, the pink and yellow curves show the I-V and P-V characteristics respectively. It has been clearly shown in Fig.5 and Table1 that the maximum power was obtained at full illumination of 4A current. As the illuminating current wasgradually decreased by 25% i.e. the shading was increased across the cell, the values of Voc, Vm, Im and Pm were decreased which can be seen from the graph, as well as table. The value of Pm was reduced by approximately 0.4 W per 1A reduction in the illumination current across the cell.
IV.2
ILLUSTRATION 2
The effect of shading on PV curve for the PV array with different shading patterns has been simulated at 25˚C as well as 50˚C. Here, the PV curves for Type D shading pattern has been shown in Fig.6.
(a) (b) Fig.6: I-V and P-V characteristic curves of PV array with Type D shading pattern at (a) 25˚C (b) 50 ˚C
www.ijesi.org
71 | Page
Spice Based Modeling and Simulation to Study the Effects of… The effect of shading and temperature has been tabulated in Tables 2-5 for the above mentioned shading patterns.
Table 2: Type ATable 3: Type B
Table 4: Type C
Table 5: Type D
Observations from simulations of PV arrays with different shading patterns at 25˚C as well as 50˚C are shown in Fig.6 and Table 2-5. It can be observed that the increase in temperature and shading level adversely affected the power from the PV array. It has also been observed that the power detoriates by 11-12% with the increase in temperature by 25˚C. IV.3: ILLUSTRATION 3 The effect of bypass diodes on PV curve for the PV array with different shading patterns has been simulated at 25˚C as well as 50˚C.
Observations from simulations of PV arrays with bypass diodes having different shading patterns at 25˚C as well as 50˚C are shown in Fig.7 and Table 6-9. It can be observed that the increase in temperature and shading level adversely affected the power from the PV array. It can also be observed that as the level of shading was increased, the performance of the array was improved i.e. the generated power of the array was increased. However, with the usage of bypass diodes in the PV array, the generated output power has been improved. IV.4
Illustration 4
The effect of bypass and blocking diodes on PV curve for the PV array with different shading patterns has been simulated at 25˚C as well as 50˚C.
www.ijesi.org
72 | Page
Spice Based Modeling and Simulation to Study the Effects of…
Table 10: Type ATable 11: Type B
Table 12: Type C
Table 13: Type D
Observations from simulations of PV arrays with bypass diodes having different shading patterns at 25˚C as well as 50˚C are shown in Fig.8 and Table 10-13 The function of blocking diodes is to avoid current imbalance caused by shading, hence preventing damage to the array.
V.
CONCLUSION
A general approach on modeling and simulation of PV cells and arrays has been proposed. The simulation study of such circuits has been carried out in LT-Spice as it is simple and easy to use. The PV characteristics for each case have been investigated under the partial shading conditions (PSCs) and its affect has been observed. The power detoriates as the level of shading has been increased in the cell. The simulation studies of bypass and blocking diodes have been carried out and it has been observed that the introduction of such diodes in the array improves the generated output power during PSCs. Under PSCs, the PV curves show MPPsand the number of peak points in the curve is equal to the number of shading patterns provided in the array. This paper provides the reader with all necessary information to easily develop the PV array model for analyzing and simulating the array.
REFERENCES [1]. [2]. [3]. [4]. [5]. [6].
[7].
Kashif Ishaque, Zainel Salam, Syafaruddin, “A comprehensive MATLAB Simulink PV system simulator with partial shading capability based on two-diode model”, Elsevier, Solar Energy 85 (2011), 2217-2227. Sheriff M.A., Babagana B. and Maina B.T., “A Study of Silicon Solar Cells and Modules using PSpice”, World Journal of Applied Science and Technology, Vol.3. No.1 (2011), 124-130. Marcelo Gradella Villalva, Jonas Rafael Gazoli and Ernesto Ruppert Filho, “Comprehensive approach to modeling and simulation of photovoltaic arrays, IEEE Transactions on power electronics, Vol. 24, No. 5 (2009). R.K. Nema1, SavitaNema, and GayatriAgnihotri,”Computer Simulation Based Study of Photovoltaic Cells/Modules and their Experimental Verification”, International Journal of Recent Trends in Engineering, Vol 1, No. 3 (2009). Hiren Patel and VivekAggarwal,”Matlab - based modelling to study the effects of partial shading on PV array characteristics”, IEEE Transactions on Energy Conversion, Vol. 23, No.1 (2008). Atsushi Kajihara and TetsumiHarakawa, “Model of Photovoltaic cell circuits under partial shading”, IEEE (2005). LT-Spice IV User Manual.
www.ijesi.org
73 | Page