World Academy of Science, Engineering and Technology International Journal of Electrical, Computer, Electronics and Communication Engineering Vol:7, No:10, 2013
Static Voltage Stability Margin Enhancement Using SVC and TCSC Mohammed Amroune, Hadi Sebaa, Tarek Bouktir
International Science Index Vol:7, No:10, 2013 waset.org/Publication/9997161
Abstract—Reactive power limit of power system is one of the major causes of voltage instability. The only way to save the system from voltage instability is to reduce the reactive power load or add additional reactive power to reaching the point of voltage collapse. In recent times, the application of FACTS devices is a very effective solution to prevent voltage instability due to their fast and very flexible control. In this paper, voltage stability assessment with SVC and TCSC devices is investigated and compared in the modified IEEE 30-bus test system. The fast voltage stability indicator (FVSI) is used to identify weakest bus and to assess the voltage stability of power system.
Keywords—SVC, TCSC, Voltage stability, Fast Voltage Stability Index (FVSI), Reactive power. I. INTRODUCTION
N
OWADAYS, voltage collapse is one of the major problems which electric power networks might face [1]. According to the IEEE Power System Engineering Committee, voltage stability is being defined in the following way: “Voltage stability is the ability of a system to maintain voltage so that when load admittance is increased, load power will increase and so that both power and voltage are controllable” [2]. The only way to save the system from voltage collapse is to reduce the reactive power load or add additional reactive power prior to reaching the point of voltage collapse. Introducing the sources of reactive power such as shunt capacitors and/or Flexible AC Transmission System (FACTS) controllers at the suitable location is the most effective technique for utilities to improve voltage stability of the system. In recent times, the application of FACTS devices is a very effective solution to prevent a voltage instability and voltage collapse due to their fast and very flexible control. FACTS devices have been defined by the IEEE as “alternating current transmission system incorporating power electronic based and other static controllers to enhance controllability and increase power transfer capability” [3]. The potential benefits offered by these controllers are reduced cost of operation, increased reliability of power system and improve voltage stability. FACTS are also applied to improve the performance of the power system under transient stability conditions [4], [5]. There are many types of FACTS devices such as Static Var Compensator (SVC), Static Synchronous Compensator (STATCOM), Thyristor Controlled Series Capacitor (TCSC), M. Amroune, H. Sebaa, and T. Bouktir are with the Department of Electrical Engineering, University of Setif 1, Algeria (e-mail:
[email protected], sebaa_73@ yahoo.fr, tbouktir@ yahoo.fr).
International Scholarly and Scientific Research & Innovation 7(10) 2013
Static Series Synchronous Compensator (SSSC), Unified Power Flow Controller (UPFC), Thyristor Controlled Series Reactor (TCSR), Thyristor Controlled Phase Shift Transformer (TCPST) and Phase Shift Transformer (PST). Placement of these devices in suitable location can lead to control in line flow and maintain bus voltages in desired level and so improve voltage stability margins. The best location for reactive power compensation to improvement voltage stability margin is by considering the identified “weakest buses or lines” of the system. These critical buses and lines constitute the set of candidate points for the reinforcement against voltage stability. In practice, placing adequate reactive power support at the weakest bus enhances static voltage stability margins. The weakest bus is defined as the bus which is near to experience a voltage collapse. Equivalently, the weakest bus is one that has a large ratio of differential change in voltage to differential change in load (dv/dptotal) [6]. In this paper, voltage stability assessment with SVC and TCSC devices is investigated and compared in the modified IEEE 30-bus test system. The Fast Voltage Stability Index (FVSI) is used for identifying the most suitable locations of FACTS devices. Rest of the paper is organized as follows: A brief introduction of voltage stability analysis is presented in Section II. The Fast Voltage Stability Index (FVSI) needed for voltage stability analysis and suitable location of FACTS identification is discussed in Section III. In Section IV, modeling of SVC and TCSC is presented. Section V examines the effects of FACTS controllers on voltage stability using a 30-bus test system. II. VOLTAGE STABILITY ANALYSIS A system experiences a state of voltage instability when there is a progressive or uncontrollable drop in voltage magnitude after a disturbance, increase in load demand or change in operating condition. The main factor, which causes these unacceptable voltage profiles, is the inability of the distribution system to meet the demand for reactive power. Under normal operating conditions, the bus voltage magnitude (V) increases as Q injected at the same bus is increased. However when V of any one of the system’s buses decreases with the increase in Q for that same bus, the system is said to be unstable. Although the voltage instability is a localized problem, its impact on the system can be wide spread as it depends on the relationship between transmitted P, injected Q and receiving end V [7]. There are many methods currently in use to help in the
900
World Academy of Science, Engineering and Technology International Journal of Electrical, Computer, Electronics and Communication Engineering Vol:7, No:10, 2013
analysis of static voltage stability. Some of them are PV and QV analysis [8], Modal Analysis [9], Maximum Loading Margin Index (MLM) [10], load proximity index [11], [12], impedance index [13], Fast Voltage Stability Index (FVSI) [14], Line stability index [15]. The results from this study could also identify the weak buses or lines in power system network. The easy to calculate Fast Voltage Stability Indicator proposed by Rahman is used for stability assessment.
International Science Index Vol:7, No:10, 2013 waset.org/Publication/9997161
III. VOLTAGE STABILITY INDICATOR FORMULATION The Fast Voltage Stability Index symbolized (FVSI) proposed by I. Musirin et al. [14] is formulated based on a power transmission line. This index is basically used to determine the maximum load-ability in a power system. The voltage stability index referred to a line was formulated from the 2-bus representation of a system. The value of line index that is closed to the unity indicates that the respective line is closed to its stability limit. The representation of a 2-bus model is illustrated in Fig. 1. Vi
0
Vj
δ
R+jX Pj+jQj
Pi+jQi
Fig. 1 Model of simple branch for voltage stability research
By taking the sending bus (bus i) as the reference, the voltage of receiving end Vj can be calculated by [9]:
R2 R V j2 − sin δ + cos δ ViV j + X + Qj = 0 X X
(1)
applied in power systems in shunt and/or in series. FACTS solutions are particularly justifiable in applications requiring rapid dynamic response, ability for frequent variations in output, and/or smoothly adjustable output. Under such conditions, FACTS is a highly useful option for enabling or improving the utilization of power systems [16]. FACTS devices can basically be sub-divided into three categories: • Shunt devices such as Static Var Compensator (SVC); • Series devices such as Thyristor Controlled Series Capacitors (TCSC); • Combined series-shunt controllers such as Unified Power Flow Controller (UPFC). This section describes the models of the Static Var Compensator (SVC), and the Thyristor Controlled Series Capacitor (TCSC). A. SVC Model Static Var Compensators (SVC’s) are part of the Flexible AC transmission system (FACTS) device family, regulating voltage and stabilizing the system. The most popular configuration for continuously controlled SVC’s is the combination of either fix capacitor (FC) and thyristor controlled reactor (TCR) or thyristor switched capacitor (TSC) and thyristor reactor (TCR) [17], [18]. In this paper, the FCTCR structure is used for analysis of SVC which is shown in Fig. 2. The TCR consists of a fixed reactor of inductance L and a bi-directional thyristor valve that are fired symmetrically in an angle control range of 90° to 180°, with respect to the SVC voltage. Through a suitable coordination of the capacitors and the controlled reactor, the bus reactive power injected (or absorbed) by the SVC can be continually varied in order to control the voltage or to maintain the desirable power flow in the transmission network either over normal operating or under disturbances conditions [19], [20].
In (1), the condition for obtaining the real roots of Vj is that the discriminate must be set greater than or equal to 0, i.e.
4Z 2Q j X Vi 2 ( R sin δ + X cos δ )
≤1
K
(2) α
Considering the angle difference δ is very small, i.e. 0≈δ, the index is formulated as
XC XL
2
FVSI =
4Z Q j Vi 2 X
≤1
(3) Fig. 2 Basic structure of SVC
where: Z is the line impedance, X is the line reactance, Vi is the voltage at the sending end and Qj is the reactive power at the receiving end.
The TCR at fundamental frequency can be considered as variable inductance given by [21], [22]:
XV = X L
IV. MODELING OF SVC AND TCSC CONTROLLERS FACTS make up a family of high power devices that are
International Scholarly and Scientific Research & Innovation 7(10) 2013
901
π 2 (π − α ) + sin 2α
(4)
World Academy of Science, Engineering and Technology International Journal of Electrical, Computer, Electronics and Communication Engineering Vol:7, No:10, 2013
International Science Index Vol:7, No:10, 2013 waset.org/Publication/9997161
where XL is the reactance caused by the fundamental frequency without thyristor control and α is the firing angle. B. TCSC Model Thyristor Controlled Series Capacitors (TCSC) is a type of series compensator, can provide many benefits for a power system including controlling power flow in the line, damping power oscillations, and improving of voltage stability. A TCSC is a capacitive reactance compensator, which consists of a series capacitor bank shunted by a thyristor controlled reactor in order to provide a smoothly variable series capacitive reactance [23]. Fig. 3 shows a schematic representation of a TCSC connected in a transmission line between bus n and m of power system. The principle of TCSC in voltage stability enhancement is to control the transmission line impedance by adjust the TCSC reactance. The equivalent reactance of TCSC is a function of the firing angle α of the TCR. XC n
RLine
π π − 2α − sin α
X l (α ) = X L
(6)
with: X L = ω L α is the firing angle, XL is the reactance of the inductor and Xl is the effective reactance of the inductor at firing angle. The effective series transmission impedance is given by: X eff = (1 − K ) X Line
(7)
where k is the degree of series compensation;
X TCSC (α )
K=
(0 < K < 1)
X Line
(8)
While choosing K, 100% compensation should not be provided to avoid series resonance in transmission line. Practically up to 70% of series compensation is chosen for line reactance compensation [26].
m
XLine
V. SIMULATION RESULTS AND DISCUSSION
α
XL α XTCSC
Fig. 3 Transmission Line with TCSC Controller
The firing angles of the thyristors are controlled to adjust the TCSC reactance according to the system control algorithm, normally in response to some system parameter variations. According to the variation of the thyristor firing angle or conduction angle, this process can be modeled as a fast switch between corresponding reactance offered to the power system. Assuming that the total current passing through the TCSC is sinusoidal, the equivalent reactance at the fundamental frequency can be represented as a variable reactance XTCSC. The TCSC can be controlled to work either in the capacitive or the inductive zones avoiding steady state resonance [24]. Thus, impedance characteristics of TCSC shows, both capacitive and inductive region are possible though varying firing angle (α): • Thyristor valve bypass mode (inductive region operation): From 90° to αLlim ; • Thyristor valve blocked mode (resonance region for inhibited operation): Between αLlim and αClim; • Vernier control mode (capacitive region operation): From αLlim to 180°. There exists a steady-state relationship between the firing angle α and the reactance XTCSC. This relationship can be described by the following equation [25]: X C X l (α ) (5) X TCSC (α ) = X l (α ) − X C where:
International Scholarly and Scientific Research & Innovation 7(10) 2013
The simulation work conducted on the IEEE 30-bus Test system, which consists of six generators (bus 1 is a slack bus 2, 5, 8, 11 and 13 are PV buses), 24 loads and 41 lines, ( 6-9, 610, 4-12 and 28-27) in which four lines are with the tap changing transformers. The line parameters and loads are taken from [27]. Simulation results have been obtained by using MATLAB software package. 25 23
24
26
4 14
15
18
16
19
20
21
22
17 G
27
28
G
12
10
1
1 1
30
G G
29 2 9
9
13 G G
1
1
3
4
6 G G
8
2
2
5
7
G G
G G
Fig. 4 Single line diagram of the IEEE 30-bus system
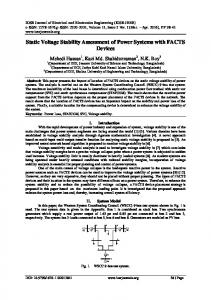
A. Identification of Best Location of Compensation Devices To define the appropriate placement of FACTS devices, the Fast Voltage Stability Index (FVSI) is computed and ranked, and the most ten severe lines according to FVSI values are recorded in Table I. The margin of reactive power of load buses is given in Fig. 5. It shows that buses 26, 29 and 30 have
902
World Academy of Science, Engineering and Technology International Journal of Electrical, Computer, Electronics and Communication Engineering Vol:7, No:10, 2013
the lowest margin of reactive power and lines 25-26, 27-30, 27-29 have highest values of FVSI. These buses and lines are considered as the best location to provide desired reactive power support.
1 FVSI VM
0.9 0.8 0.7 0.6
TABLE I THE HIGHEST RANKED LINES ACCORDING TO FVSI
0.4
FVSI 0.9479 0.9452 0.8944 0.6972 0.5528 0.4388 0.3659 0.3602 0.3574 0.3518
0.3 0.2 0.1 0
0
5
10
15 20 Q (MVar)
25
30
35
Fig. 7 FVSI and Bus voltage versus Reactive Power Demand for Bus- 26
The results above validates the expected outcome, whereby high reactive power demand will tend to cause a drop in bus voltage and also increase the branch load level, which in turn is represented by the FVSI characteristic.
70
60
50
Q(M Var)
40
30
20
10
0
3
4
7
10
12
14 15 1617 18 19 20 21 Load Bus N°
23 24
26
29 30
Fig. 5 Margin of reactive power for IEEE 30-bus test system
To define the most critical line the reactive power demand (Qd) in the test system was increased gradually at the following observed busses (bus 26, 29 and 30). Fig. 6 gives the idea of most critical line in the system with respect to a bus. The line connected between buses 25 and 26 is most critical with variation in reactive power loading at bus 26 as its FVSI value is close to 1. Fig. 7 shows the FVSI Index and Bus voltage versus reactive power demand for Bus 26. It can be seen that as reactive power demand is increased, the FVSI would rise eventually to a value close to 1. However the bus voltage value reduces gradually as reactive power demand increases. 1 Line 25-26 (bus 26) Line 27-29 (bus 29) Line 27-30 (bus 30)
0.9 0.8 0.7 0.6 FVSI
International Science Index Vol:7, No:10, 2013 waset.org/Publication/9997161
Lines (From - To) 25-26 27-30 27-29 29-30 28-27 14-15 24-25 15-23 15-18 25-27
0.5
0.5
B. Effect of SVC and TCSC Devices The best location for shunt reactive power compensation for steady state voltage stability margin is the weakest bus of the system [20]. The ideal location for Series compensation is still under investigation. However, a commonly used method is by placing the series compensator one at a time in the lines between weakest buses [20]. It is clear from the results that line between buses 25 and 26 is the most critical line and bus 26 is the most critical bus. The most suitable location for SVC and for TCSC to improve voltage stability is found to be bus number 26 and line (25-26). Figs. 8 to 11 show the FVSI Index versus reactive power demand increases at bus 14, 24, 29 and 30 separately with and without of FACTS devices. Voltage profiles at these buses with and without FACTS devices are also shown in Figs. 1215. It can be observed that the improvement of voltage stability margin and voltage profiles at these buses with SVC is more than the case that TCSC inserted in the system. This is due to the reason that the SVC is installed at the weakest bus (bus26), but TCSC device inserts the reactive power at the connected line (25-26). The test system needs reactive power at the load bus more than the line. Fig. 16 shows the voltage values at all buses of IEEE 30-bus system without and with insertion of SVC and TCSC. It is clearly shown that the system voltage magnitudes at load buses 24, 25, 26, 27, 28, 29 and 30 of the system is better in case of SVC compared to TCSC.
0.4 0.3 0.2 0.1 0
0
5
10
15
20 Q (MVar)
25
30
35
40
Fig. 6 FVSI profiles computed with load varies at bus 26, 29 and 30
International Scholarly and Scientific Research & Innovation 7(10) 2013
903
World Academy of Science, Engineering and Technology International Journal of Electrical, Computer, Electronics and Communication Engineering Vol:7, No:10, 2013
0.35
1.4
Without FACTS With SVC With TCSC
0.3
1
0.2
0.8
FVSI
VM (pu)
0.25
0.15
0.6
0.1
0.4
0.05
0.2
0
0
5
10
Without FACTS With SVC With TCSC
1.2
15
20 Q (MVar)
25
30
35
0
40
Fig. 8 FVSI versus reactive power demand increases at bus 14
0
10
20 Q (MVar)
30
40
Fig. 12 Voltage versus reactive power demand increases at bus 14
0.2
1.4
Without FACTS With SVC With TCSC
0.18
Without FACTS With SVC With TCSC
1.2
1
0.12
VM (pu)
FVSI
0.14
0.1
0.8
0.6
0.08 0.4
0.06 0.2
0.04 0.02
0
0
5
10
15
20 Q (MVar)
25
30
35
40
Fig. 9 FVSI versus reactive power demand increases at bus 24
0
10
20 Q (MVar)
30
40
Fig. 13 Voltage versus reactive power demand increases at bus 24 1
0.7 Without FACTS With SVC With TCSC
0.6
Without FACTS With SVC With TCSC
0.9 0.8
0.5
0.7 0.6
FVSI
VM (pu)
0.4
0.3
0.5 0.4 0.3
0.2
0.2 0.1
0.1 0
0
5
10
15
20 Q (MVar)
25
30
35
0 -5
40
Fig. 10 Voltage versus reactive power demand increases at bus 29
5
10
15 20 Q (MVar)
25
30
35
40
1 Without FACTS With SVC With TCSC
0.9
Without FACTS With SVC With TCSC
0.9 0.8
0.8
0.7
0.7
0.6 VM (pu)
0.6 0.5
0.5
0.4
0.4
0.3
0.3
0.2
0.2
0.1
0.1
0
0
Fig. 14 Voltage versus reactive power demand increases at bus 29
1
FVSI
International Science Index Vol:7, No:10, 2013 waset.org/Publication/9997161
0.16
0
5
10
15 20 Q (MVar)
25
30
0 -5
35
Fig. 11 Voltage versus reactive power demand increases at bus 30
International Scholarly and Scientific Research & Innovation 7(10) 2013
0
5
10
15 20 Q (MVar)
25
30
35
40
Fig. 15 Voltage versus reactive power demand increases at bus 30
904
World Academy of Science, Engineering and Technology International Journal of Electrical, Computer, Electronics and Communication Engineering Vol:7, No:10, 2013
[9]
[10]
[11]
[12]
[13]
[14]
Fig. 16 Voltage profile at all buses of IEEE 30-bus system with and without FACTS International Science Index Vol:7, No:10, 2013 waset.org/Publication/9997161
[15]
VI. CONCLUSION A comparison study of SVC and TCSC in static voltage stability margin enhancement is presented. Both SVC and TCSC capable of increasing static voltage stability margin, though SVC provides higher voltage stability margin and better voltage profiles compared to TCSC because the SVC is a shunt compensation device, which inject the reactive power at the connected bus (weakest bus) where power system requires reactive power the most at this bus. Injection of reactive power at this bus using SVC can improve voltage stability margin the most. However the TCSC is series compensation devices, which inject reactive power through the connected line. This may not be effective when the system required reactive power at the load bus. REFERENCES [1]
[2]
[3]
[4]
[5]
A. Guzmán, D. Tziouvaras, E. O. Schweitzer and Ken E. Martin, “Local and wide-area network protection systems improve power system reliability,” Schweitzer Engineering Laboratories technical papers, 2004. A. Wiszniewski, “New criteria of voltage stability margin for the purpose of load shedding,” IEEE trans. Power del, vol. 22, no. 3, July 2007, pp. 1367-1371. IEEE “Proposed terms and definitions for flexible AC transmission system (FACTS)”, IEEE Transactions on Power Delivery, Vol. 12, No. 4, pp. 1848-1853, October 1997. A. Hernandez, M.A. Rodriguez, E. Torres, P. Eguia, “A Review and Comparison of FACTS Optimal Placement for Solving Transmission System Issues”, Renewable Energy and Power Quality Journal (RE&PQJ), No.11, March 2013. M. Amroune, A. Bourzami, and T. Bouktir, “Improvement of Transient Stability Margin in Power Systems with Integrated Wind Generation Using the SVC”, 13th International conference on Sciences and
[16] [17] [18]
[19]
[20]
[21]
[22]
[23]
[24]
[25]
[26]
[27]
Techniques of Automatic control & computer engineering, [6]
[7] [8]
December 17-19, 2012, Monastir, Tunisia. D. Thukaram and A. Lomi, “Selection of Static VAR Compensator Location and Size for System Voltage Stability Improvements”, Electrical Power System Research, vol. 54, pp. 139-150, 2000. Kundur P, Power System Stability and Control, EPRI Power System Engineering Series, McGraw-Hill, 1994. MINAMI, Shoichi, MORII, Satoshi and KAWAMOTO, Shunji “Voltage Stability Analysis for Bulk Power System by P-V and Q-V Curves Considering Dynamic Loads”, International Conference on Electrical Engineering, 2008.
International Scholarly and Scientific Research & Innovation 7(10) 2013
905
B. Gao, G. K. Morison and P. Kundur, “Voltage Stability Evaluation Using Modal Analysis”, IEEE Trans on Power Sys, vol. 7, pp 15291542, November 1992. Arthit Sode-Yome, Nadarajah Mithulananthan, Kwang Y. Lee, “A Maximum Loading Margin Method for Static Voltage Stability in Power Systems,” IEEE Transactions on Power Systems, vol. 21, NO. 2, May 2006. T. Nagao, K. Tanaka and K. Takenaka, “Development of static and simulation programs for voltage stability studies of bulk power system,” IEEE Transactions on Power Systems, vol. 12, pp: 273-281, Jan. 1997. K. Lba, H. Suzuki, M. Egawa, et al. “Calculation of critical loading condition with nose curve using homotopy continuation method,” IEEE Trans on Power Systems, vol. 6, pp: 584-593, May. 1991. Liu Zhuo. “The impedance analyses of heavy load node in voltage stability studies,” Proceedings of the CSEE, vol. 20, pp: 35-39, Apr. 2000. I. Musirin, T.K.A Rahman, “Novel Fast Voltage Stability Index (FVSI) for Voltage Stability Analysis in Power Transmission System,” Student Conference on Research and Development Proceedings, Shah Alam, Malaysia, July 2002. Mahmoud Moghavvenni, M.Faruque,”Estimation of Voltage Collapse From Local measurement of Line Power Flow and Bus Voltages”, Proc. of International conference on Electrical Power Engineering, Budapest, pp77, February 1999. R. Grünbaum, M. Noroozian, and B. Thorvaldsson, “FACTS: solutions to power flow control & stability problems,” ABB Review, vol. 5, 1999. T. J. E Miller, Reactive Power Control in Electric Systems, Wiley Interscience, 1982, vol. 4, pp. 204-214. H. A. Perez, E. Ache, and C. R. F. Esquivel, “Advanced SVC Models for the Newton Raphson load flow and Newton optimal power flow studies”, IEEE Transactions on the power systems, vol. 15, no. 1, pp. 129-136, February 2000. C. A. Caizares, “Power flow and transient stability models of FACTS controllers for voltage and angle stability studies,” Proc. 2000 IEEE Power Engineering Society Winter Meeting, pp. 8, Jan. 2000. Arthit Sode-Yome, Nadarajah Mithulananthan and Kwang Y. Lee, “A Comprehensive comparison of FACTS Devices for Enhancing Static Voltage Stability,” IEEE Power Engineering Society General Meeting, June 2007. C. A. Canlzares, Z. T. Faur, “Analysis SVC and TCSC Controllers in Voltage Collapse,” IEEE Transactions on the power systems, vol. 14, No. 1, February 1999, pp. 158-165. N. Talebi, M. Ehsan, S.M.T Bathaee, “Effects of SVC and TCSC Control Strategies on Static Voltage Collapse Phenomena,” IEEE Proceedings, Southeast Con, pp. 161 - 168, Mar 2004. N. Hingorani and L. Gyugyi, Understanding FACTS Concepts and Technology of Flexible AC Transmission Systems, Piscataway, NJ: IEEE Press/Wiley, 2000. Abouzar Samimi, Peyman Naderi, “A New Method for Optimal Placement of TCSC Based on Sensitivity Analysis for Congestion Management”, Smart Grid and Renewable Energy, 2012, 3, 10-16. C. Schaffner and G. Andersson, “Performance of a TCSC for Congestion Relief,” Proceedings of the Conference on Power Technology, St. Petersburg, 23-27 June, 2005, pp. 1-3. S. Meikandasivam, Rajesh Kumar Nema, and Shailendra Kumar Jain, “Selection of TCSC Parameters: Capacitor and Inductor”, International Conference on Power Electronics (IICPE), 28-30 Jan. 2011 India, pp.1-5. E. De Tuglie, S. M. Iannone, F. Torelli “A coherency based method to increase dynamic security in power systems”, Electric Power Systems Research. 78 (2008) 1425 – 1436.