Stochastic Approach to Secret Message Length Estimation in ±k Embedding Steganography Taras Holotyak, aJessica Fridrich∗ , and bDavid Soukal a Department of Electrical and Computer Engineering b Department of Computer Science SUNY Binghamton, Binghamton, NY 13902-6000, USA a
ABSTRACT In this paper, we propose a new method for estimation of the number of embedding changes for non-adaptive ±k embedding in images. By modeling the cover image and the stego noise as additive mixture of random processes, the stego message is estimated from the stego image using a denoising filter in the wavelet domain. The stego message estimate is further analyzed using ML/MAP estimators to identify the pixels that were modified during embedding. For non-adaptive ±k embedding, the density of embedding changes is estimated from selected segments of the stego image. It is shown that for images with a low level of noise (e.g., for decompressed JPEG images) this approach can detect and estimate the number of embedding changes even for small values of k, such as k=2, and in some cases even for k=1.
1. INTRODUCTION Steganography is the art of invisible communication. Its purpose is to hide the very presence of communication by embedding messages into innocuous-looking cover objects. Each steganographic communication system consists of an embedding algorithm and an extraction algorithm. To accommodate a secret message in a digital image, the original cover image is slightly modified by the embedding algorithm. As a result, the stego image is obtained. The most important requirement for a steganographic system is undetectability: stego images should be statistically indistinguishable from cover images. In other words, there should be no artifacts in the stego image that could be detected by an attacker with probability better than random guessing, given the full knowledge of the embedding algorithm, including the statistical properties of the source of cover images, except for the stego key (Kerckhoffs’ principle). For a more exact treatment of the concept of steganographic security, the reader is referred elsewhere 1,2,3 . By far the most popular and frequently used steganographic method is the Least Significant Bit embedding (LSB). It works by embedding message bits as the LSBs of randomly selected pixels. The pixel selection is usually determined by a secret stego key shared by the communicating parties. Today, a fairly large portion of steganographic programs (http://www.stegoarchive.com) available for download on the Internet use this technique (Steganos II, S-Tools 4.0, Steghide 0.3, Contraband Hell Edition, Wb Stego 3.5, Encrypt Pic 1.3, StegoDos, Wnstorm, Invisible Secrets Pro, and many others). The popularity of the LSB embedding is most likely due to its simplicity as well as the [false] belief that modifications of LSBs in randomly selected pixels are undetectable because of the noise commonly present in naturalscene digital images. However, flipping the bits of the LSB plane is a very unusual operation that does not occur naturally. The even pixel values are either unmodified or increased by one, while odd values are either decreased by one or left unchanged. This imbalance in the embedding distortion was recently utilized to mount successful attacks4,5,6,7 . The current state-of-the-art in detection of LSB embedding is represented by RS analysis 7 , Sample Pairs analysis 6 , and their improved versions8,9 . These methods can detect stego images with an extremely high reliability as well as accurately estimate the number of changes due to embedding. A better approach than manipulating bit planes is embedding by adding noise of specific properties. The early example of this approach is the work of Marvel10 , Alturki11 , and Sharp12 . Recently, Stochastic Modulation13 was proposed, in which the act of embedding is realized by superimposing noise with an arbitrary (user-selected) probability distribution. ∗
[email protected]; phone 1 607 777-2577; fax 1607 777-4464; http://www.ws.binghamton.edu/fridrich
This method attempts to mask the act of embedding as adding a device noise of specific properties. A special case of this method is the so-called ±k embedding that is investigated in this paper. In ±k embedding, some pixel values are left unchanged, while others are either increased or decreased by k. The modifications can be either content independent or adapted to the image content. The ±k embedding for k=1 is a trivial generalization of LSB embedding. Instead of flipping the LSB, the sender increases or decreases the pixel value by one to match its LSB with the message bit. This seemingly innocent modification of the LSB embedding is significantly harder to detect because the pixel values are no longer paired. As a result, none of the existing attacks on LSB embedding can be adapted to attack ±1 embedding. One of the first papers on detection of embedding by noise adding is the paper by Harmsen14 , where the detection relies on the fact that adding noise to the cover image smoothes out its histogram. This method seems to work reasonably well for images that have low level of high frequency noise, such as decompressed JPEG images. It is not clear, however, if one can find a universal threshold distinguishing cover and stego images for a sufficiently wide class of images and whether the method can reliably estimate the number of embedding modifications, which is an important piece of knowledge for the steganalyst. Also, the method is much less reliable for grayscale images. A different method for detection of steganography based on noise adding was proposed by Westfeld 15 . Noise adding creates many (up to 26) neighbors for each color present in the cover image. In decompressed JPEG images and images with a low level of noise, each color typically has no more than 10– 15 neighboring colors. In ±1 embedding, however, the number of neighbors increases quite significantly even for low embedding rates. Thus, by counting the number of neighbors for each unique color in the image, one can detect the presence of ±1 steganography. This method cannot be used for grayscale images and it is not known if it can estimate the number of embedding changes. Also, images with a large noise component, such as scans of photographs or certain resampled images often form false positives. In this paper, we propose a method for estimation of the number of embedding changes for non-adaptive ±k embedding in color or grayscale images. The method consists of a sequence of estimation procedures that use spatial and wavelet domains representations of the cover and stego images to estimate the length of a message embedded using ±k steganography. In Section 2, we describe the new approach and then in Section 3 we experimentally evaluate its performance. In the last section, we discuss the limitations of the proposed approach and conclude the paper.
2. PROPOSED METHOD A grayscale n×m image will be represented with a two-dimensional array of integers xij , xij ∈{0, …, 255}, i∈{1, …, n}, j∈{1, …, m}. A true color 24 n×m bit image will be represented as three grayscale n×m images rij , g ij , bij . The distortion due to non-adaptive ±k embedding is modeled as an additive i.i.d. noise signal η with the following Probability Density Function (PDF) with p∈[0,1] P(η = 0) = 1–p/2 (1) P(η = k) = P(η = –k) = p/4 . Pixel value x 2i, 0 < i < 255 2i+1, 0 < i < 255 0 255
To embed bit b, modify x to b=0 b=1 2i 2i+1 or 2i–1 2i or 2i+2 2i+1 0 1 254 255
Table 1. PM1 embedding operation.
For k=1, for example, (1) corresponds to embedding a random binary bit-stream of length pmn in randomly selected pixels using the embedding rule from Table 1.
2.1 Problem analysis From the signal processing point of view, steganography can be considered as adding a certain type of noise s to the cover image x thus obtaining the stego image y=x+s. Because of the undetectability requirement, stego message embedding is performed with a low stego message/cover image ratio. In this paper, the amplitude of s is equal to k. Communication theory considers steganography as data transmission through a noisy channel corrupted by the cover image16 . The character of non-adaptive ±k embedding allows us to consider the stego image as a set of parallel communication channels (Fig. 1) and perform independent estimation of the stego message in each channel16 .
y(k )
x( k )
s(k )
. . .
x( n )
y(n ) s(n)
Fig. 1. Stego image as set of parallel communication channels.
2.2 General structure of the proposed method Taking into account the specifics of ±k embedding, especially for small k (e.g., k=1, …, 3), we note that direct stego message estimation sˆ from the mixture y is a complicated problem. The general structure of the proposed stego message estimation method is shown in Fig. 2, where e = x − xˆ is the error of the cover image estimation.
y= x+s
+ Cover image estimation
s+e
Stego message estimation
sˆ
Stego message length estimation
pˆ
xˆ
Fig. 2. Structure of proposed method.
The proposed method solves this problem in 3 stages. In the first stage, we estimate the cover image from the stego image. Because of the low level of distortion caused by ±k embedding (or a high cover image SNR), it can be done with high accuracy. Using the estimate xˆ , estimation of the stego message s+e from the mixture is performed in the second stage, capitalizing on the fact that the previous removing of the cover image substantially improves the stego message SNR. The third stage consists of the estimation of the stego message length p. A potential advantage of this approach is the possibility that not only length, but also estimates for the location and sign of the embedding changes are obtained. Due to absence of a priori knowledge about p, the Maximum Likelihood (ML) is used for estimation of the stego message length. Grid search approach was applied to find maximum of likelihood function consists of the ratio of the estimated stego message length to its assumed value. Due to absence of a priori knowledge about p, we first use the Maximum Likelihood (ML) for estimation of the stego message length and then later propose another approach using the MAP estimator. 2.3 Cover image estimation Separation of the cover image and the stego message from the stego image y and the following stego message length estimation require appropriate stochastic models. Although we have the model of the stego message (Table 1), good stochastic models for real images in the spatial domain do not exist. To solve this problem, we transform the stego image
to another domain using a linear transform that has good energy compactification and decorrelation properties (the linearity makes the transformed stego image also an additive mixture of random processes). All these properties are needed to obtain a good separation between the cover image and the stego message. For this purpose, the wavelet transform is commonly used. Thus, the first stage of the proposed approach can be considered as wavelet domain stego image denoising. In this text, we use capital letters to denote wavelet transforms of lower case symbols (e.g., X=W(x) and Y=W(y), where W is the wavelet transform). Initially, we modeled the histograms of subband coefficients using the stationary Generalized Gaussian Distribution (GGD) 17,18,19 . However, because of the complex nature of real images, the stationary assumption of this description was not accurate enough. Also the GGD does not allow obtaining a closed form solution for the denoising problem. Consequently, we turned our attention to non-stationary models 20 and replaced the stationary GGD model with a non-stationary Gaussian Distribution (GD), N(0,CX ), where CX is the cover image covariance matrix that has to be estimated from the stego image. In Fig. 3, we show the block-diagram of the cover image estimation. The ML20 or Maximum A Posteriori (MAP) estimation21,22 were applied to estimate the parameters of the cover image model.
ML/MAP estimation of cover image model parameters
Y
Parameters of the stego message model (p)
Cˆ X Xˆ
MAP estimation of cover image Fig. 3. Block diagram of cover image estimation method.
The wavelet domain cover image estimation is performed according
(
)
Xˆ = argmax PY X ( Y X ) PX ( X ) , X ∈ℜ
where PY
X
(2)
(Y X ) is the likelihood function and PX ( X ) denotes the cover image model.
For large message length, in the wavelet domain the stego message can be represented with a stationary GD model, N 0, σ S2 (Fig. 4, a).
(
)
4
6000
2
x 10
5000 1.5 4000 3000
1
2000 0.5 1000 0 -3
-2
-1
0
1
2
3
a)
0 -1.5
-1
-0.5
0
0.5
1
1.5
b)
Fig. 4. Histograms of H2 subband coefficients for stego message realizations with p=0.2 (a) and p=0.05 (b).
The advantage of this model, considering the non-stationary GD cover image model, is the existence of a closed form solution for the cover image estimator because it reduces to the Wiener filter (Fig. 5, a)
(
Xˆ (i , j ) = Cˆ X (i , j ) Cˆ X (i , j ) + σ S2
)
−1
Y (i , j ) ,
(3)
where Cˆ X is the estimated cover image covariance matrix. However, with decreasing stego message length, the non-Gaussian character of the histogram becomes apparent (Fig. 4, b). Therefore, a more general, stationary GGD model, GGD ( 0, α S , β S ) , was used in this paper. The estimation of the GGD model parameters was done using the ML approach. Because a closed form solution does not exist for this case, a numerical method for the cover image estimation was adopted.
Xˆ
40
40
30
30
20
20
10
10
Xˆ
0 -10
0
-10 σ σ σ σ
-20 -30 -40 -40
-30
-20
-10
0
Y
10
20
30
β =0.3 β =1.0 β =2.0 β =5.0
-20
=5 =10 =15 =20
-30 -40 -40
40
-30
-20
a)
-10
0
10
20
30
Y
40
b)
Fig. 5. MAP estimator of GD random process from GD+GD mixture (a); MAP estimator of GD random process from GD+GGD mixture (b).
In Fig. 5, we show dependence of cover image from stego image, where cover image was described by non-stationary GD model and stego message was presented by stationary GD (Fig. 5,a) or stationary GGD (Fig. 5,b) models. The four curves correspond to four different values of the parameter σ for the GD model and β for the GGD model of the stego message. Fig. 5, a shows that estimation of cover image from GD+GD mixture is linear, whereas dependences in Fig. 5,b have strongly nonlinear character. The parameter β for the stego message is typically in the range [1.4, 2.3]. In contrast to the classical wavelet domain denoising approach where the parameters of the noise model can be estimated directly from the wavelet representation of the noisy image19 , in the case of ±k embedding steganography this is rather hard to do because of the small stego message SNR. Our analysis shows that the parameters of subband coefficients distribution are robust with respect to different realizations of the stego message. For 1000 stego message realizations with varying p∈[0,1], the normalized standard deviation of the estimation error was less than 3–5% of the parameter values. This suggests the possibility to use pre-calculated parameters of the wavelet domain stego message model. The type of the wavelet transform also plays an important role in the cover image estimation. We illustrate this point on the denoising problem (which is the removal of additive white Gaussian noise) with two wavelet transformations – the decimated and undecimated orthogonal wavelet transforms (Db8)23 . For testing, a mixture of the 512×512 grayscale “Lena” image and AWGN N (0,100) noise (PSNR=28.13dB) was taken.
1 2
Methods Orthogonal WT (Db8) (ML) 20 Undecimated orthogonal WT (Db8) (ML)
Performance PSNR (original, denoised) 34.38 dB 35.02 dB
Table 2. Performance of denoising methods.
We see from Table 2 that the redundancy of wavelet domain data representation in Method 2 gives a gain of approximately 0.65 dB. However, Method 2 also increases the computational complexity by the factor of 3.75. 2.4 Stego message estimation After estimating the cover image, the stego message estimate is obtained as follows
sˆ = y − xˆ = x + s − xˆ = s + e .
sˆ
p/4
“–k”
(4)
“–k” k
1–p/2 “0”
“0”
s+e
-T T
“+k”
“+k”
p/4
-k
a)
b)
Fig. 6. Stego message model: 3-PAM with non-uniform symbol probability (a) and stego message estimator (b).
1
0.9
0.9
0.8
0.8
Probability of error
Probability of error
The error of the cover image estimation e is caused by the stochastic behavior of the estimated stego message and usage of the averaged precalculated parameters for the stego message model. Taking into account non-stationary behavior of the cover image, e can be described as a non-stationary GD process. In this case, the stego message estimation transforms into the 3-PAM (Pulse Amplitude Modulation) communication problem with a non-uniform probability of symbols (Fig. 6, a).
0.7 0.6 0.5 0.4 0.3 0.2
0.7 0.6 0.5 0.4 0.3 0.2 0.1
0.1 0 -30
p=0.2 p=0.4 p=0.6 p=0.8 p=1.0
-25
-20
-15
-10
-5
0
5
0 -30
10
SNR
-25
a)
-20
-15
-10
-5
0
SNR
5
10
b)
Fig. 7. Probability of error vs. stego message SNR for ML (a) and MAP (b) estimators.
The estimation of the stego message will be performed in a pixel-wise manner. The assumption about equal probability of each symbol allows applying the ML stego message estimator with the threshold T=k/2 (Fig. 6, b). Fig. 7, a) shows the probability of an error in stego message symbol estimation as a function of the stego message SNR. The fact that the ML estimator does not use any information about the error of the cover image estimation increases the probability of incorrect symbol estimation. This drawback can be overcome by replacing the ML estimator with a MAP stego message estimator. The MAP estimator can incorporate the non-stationary GD model for e and the a priori value of p. The MAP estimator will have the same shape as in Fig. 6, b) but the threshold T is calculated for each pixel separately
T (i ) =
k σ e (i ) p / 2 − ln , 2 k 1− p 2
(5)
where σe is the standard deviation of e. Fig. 7, b) shows the error probability for the MAP estimator for different values of the stego message length p. The comparison of both estimators shows that for the same stego message SNR, the MAP
estimator gives a lower probability of error. Also, for the MAP estimator the probability of error decreases with increasing embedding rate. 2.5 Stego message length estimation Having obtained the estimate for the message, we can now estimate the parameter p – the message length. Taking into account the highly non-stationary character of the cover image and the correlation between the stego message SNR and the accuracy of the stego message estimation, we expect the stego message signal to be estimated with different accuracy depending on the stego message SNR in various stego image regions. This fact will have impact on the accuracy of the estimation of the global stego message parameter p. Fortunately, for non-adaptive ±k embedding, this impact can be reduced by estimating the parameter p only in those regions in the stego image that have a relatively high stego message SNR and extrapolating the results to the whole stego image. The division of the stego image into regions with different stego message SNR can be done using common segmentation methods. In this paper, we used stego image segmentation based on the local variation24 .
3. EXPERIMENTAL RESULTS To test the proposed stego message length estimation method, a series of experiments were performed. First, we used 10 512×512 grayscale images (decompressed JPEGs with quality factor QF=90%) and 6 stego message length estimation methods for ±1, ±3 embedding and p=0, 0.25, 0.5, 0.75, 1.0. Table 3, b shows the mean and standard deviation of the stego message estimate. #
1 2 3 4 5 6
Method description Orthogonal WT (Db8) (non-stationary GD cover image model + stationary GD stego message model) ML stego message estimator Orthogonal WT (Db8) (non-stationary GD cover image model + stationary GD stego message model) MAP stego message estimator Undecimated orthogonal WT (Db8) (non-stationary GD cover image model + stationary GD stego message model) ML stego message estimator Undecimated orthogonal WT (Db8) (non-stationary GD cover image model + stationary GD stego message model) MAP stego message estimator Undecimated orthogonal WT (Db8) (non-stationary GD cover image model + stationary GGD stego message model) ML stego message estimator Undecimated orthogonal WT (Db8) (non-stationary GD cover image model + stationary GGD stego message model) MAP stego message estimator Table 3, a. Description of stego message length estimation methods. Method # 1
Method # 2
Method # 3
Method # 4
Method # 5
µ
σ
µ
σ
µ
σ
µ
σ
µ
σ
µ
σ
0.00 0.25 0.50 0.75 1.00
0.432 0.542 0.624 0.702 0.706
0.1724 0.1772 0.1792 0.1916 0.1925
0.430 0.544 0.614 0.702 0.706
0.1713 0.1771 0.1793 0.1916 0.1925
0.080 0.388 0.522 0.570 0.642
0.1265 0.1968 0.2004 0.2133 0.2246
0.080 0.388 0.518 0.570 0.646
0.1265 0.1968 0.2005 0.2133 0.2259
0.362 0.396 0.638 0.720 0.814
0.1752 0.1651 0.1421 0.1423 0.1536
0.366 0.400 0.632 0.716 0.810
0.1771 0.1661 0.1426 0.1406 0.1502
0.00 0.25 0.50 0.75 1.00
0.118 0.434 0.596 0.748 0.884
0.1322 0.1164 0.1127 0.0775 0.0379
0.118 0.426 0.588 0.734 0.882
0.1322 0.1157 0.1117 0.0833 0.0370
0 0.414 0.532 0.736 0.872
0 0.0966 0.0687 0.0449 0.0495
0 0.416 0.530 0.730 0.860
0 0.0974 0.0698 0.0450 0.0558
0 0.290 0.618 0.782 0.896
0 0.1228 0.1035 0.0656 0.0382
0 0.268 0.610 0.792 0.922
0 0.1134 0.0976 0.0538 0.0354
k=±3
k=±1
p
Method # 6
Table 3, b. Results of stego message length estimation.
W e can see from Table 3 that the undecimated wavelet transform (Method 1 vs. Method 3) gives a more accurate estimation of stego message length, especially for low embedding rates, which is compatible with the results from Table
k=±2
2. Second, the usage of MAP estimator did not lead to any significant improvement in comparison with ML estimation (Method 1 vs. Method 2, Method 3 vs. Method 4, and Method 5 vs. Method 6). This is caused by our inability to suppress the error term e introduced by imperfect estimation of the cover image (low stego message SNR). Third, the advantage of a more precise GGD stego message model (Method 5 vs. Method 3) was negatively influenced by the absence of a closed form solution for the GGD model parameters estimation (it was realized using an ML estimator) and for the estimation of the cover image from the stego image (the numerical solution is ill-conditionined). Fourth, the necessity to test our method on a large number of images imposes an upper limit on the acceptable computational complexity of the proposed methods. While replacing the decimated wavelet decomposition with undecimated increases the complexity by the factor of 3.75 (for a 5 level decomposition), it improves the estimation of low embedding rates. For practical implementations, we recommend to use only stochastic approaches with closed form solutions. Out of the six considered methods, Method 3 and 4 can be considered as the best candidates considering the accuracy/computational complexity trade off. Also, for k=±3 and given image database the undecimated decomposition based methods (Methods 3–6) perfectly separate all stego images from cover images. pˆ p pˆ p pˆ p 1
1
1
0.9
0.9
0.9
0.8
0.8
0.8
0.7
0.7
0.7
0.6
0.6
0.6
0.5
0.5
0.5
0.4
0.4
0.4
0.3
0.3
0.3
0.2
0.2
0.2
0.1
0.1
0
a) 0
50
100
150
200
250
300
350
400
450
0
b) 0
50
100
150
250
300
350
400
450
0.1 0
pˆ p
1
0.9
0.9
0.9
0.8
0.8
0.8
0.7
0.7
0.7
0.6
0.6
0.6
0.5
0.5
0.5
0.4
0.4
0.4
0.3
0.3
0.3
0.2
0.2
0.2
0.1
0.1
50
100
150
200
250
100
150
300
region #
350
400
450
d)
0
200
250
300
350
400
450
300
350
400
450
pˆ p
pˆ p 1
0
50
region #
1
0
c) 0
region #
region #
k=±3
200
0.1
0
50
100
150
200
250
region #
300
350
400
450
e)
0
0
50
100
150
200
250
f)
region #
Fig. 8. The ratio pˆ p for different cover image formats and stego message embedding amplitude: a) BMP; b) JPEG (QF=90%); c) JPEG (QF=75%) for k=±2, and d) BMP; e) JPEG (QF=90%); f) JPEG (QF=75%) for k=±3.
To investigate the impact of the cover image format on the accuracy of stego message length estimation, we used three versions of the 512×512 grayscale “Lena” image: 1) the uncompressed BMP format; 2) compressed JPEG format (QF=90); 3) compressed JPEG format (QF=75) (Fig. 8). These dependences were obtained for ±2 and ±3 embedding steganography. As the results show, correctness of stego message length estimation (the ratio of the estimated stego message length to its correct value) strongly depends on the stego image region properties, which were obtained based on the stego image segmentation using local variance as the segmentation parameter. In regions with a smaller local variance, the stego message length can be estimated more accurately. As can be seen in Fig. 8, a (BMP format), only one region gave a reasonably accurate estimation pˆ p =0.82. Better results ( pˆ p =0.99) were obtained for a high quality decompressed JPEG image (Fig. 8, b): image with QF=90 (Fig. 8, b) and QF=75 (Fig. 8, c). This is because for decompressed JPEG images the estimation accuracy as well as the number of regions, where estimation can be performed, has increased significantly because lossy compression suppresses high frequency components, which in turn decreases the term e = x − xˆ and improves the stego message SNR. The results show that in the BMP image only two regions lead to pˆ p > 0.8, whereas in decompressed JPEGs this value was reached for 5 (QF=90) and 32 (QF=75)
regions. Quite understandably, the estimator reliability improves with an increasing number of stego image regions where the stego message model parameter estimation can be performed with a high accuracy. Thus, for the ±3 embedding steganography, the ratio pˆ p was always larger than 0.96 and the number of regions with pˆ p > 0.8 was 31, 46, and 78 for the BMP image (Fig. 8, d), decompressed JPEG with QF=90 (Fig. 8, e), and decompressed JPEG with QF=75 (Fig. 8, f), respectively. In Table 4, we show the performance of Methods 1, 3, and 5 for ±1 embedding with p = 0.2, 0.4, 0.6, 0.8, 1.0 and the 512×512 grayscale “Lena” image. For these methods, the stego message SNR gain was in the range of 37– 43 dB. Stego message SNR, dB -43.1046 -40.0942 -38.3333 -37.0839 -36.1148
p 0.2 0.4 0.6 0.8 1.0
Method #1
Method #3
Method #5
+0.1792 +0.3252 +0.4583 +0.5701 +0.6632
+0.3291 +0.5630 +0.7403 +0.8821 +0.9989
+0.3957 +0.7137 +0.8804 +0.9921
Table 4. Comparison of stego message SNR improvement for Methods #1, 3, and 5.
0.35
0.35
0.34
0.34
0.34
?
0.33 0.32
x
0.31
o
0.3
+
0.29
*
0.28 0.27 0.26 0.25
a) -0.2
0
0.2
0.4
SNR
0.6
0.8
1
1.2
Probability of error
0.35
Probability of error
Probability of error
Fig. 9 shows that for all three methods and k = ±1 the probability of error, appeared during stego message estimation is between 0.25 and 0.35 depending on the stego message length, which is rather high for reliable steganalysis. We also see that the undecimated wavelet transform provides the best results (approximately 0.3 dB gain in stego message SNR). Despite the more general (GGD) model for the stego message in the wavelet domain used in Method 5, the performance of Method 5 is worse than for Method 3, which can be explained by the unstable behavior of the model parameter estimator (especially for low embedding rates) due to an ill-conditioned cover image estimator. Therefore we conclude that for estimating signals with small SNR (e.g., estimating stego message from stego image) both accurate models and existing of the estimators with closed form solution are necessary for reliable steganalysis.
0.33 0.32
?
0.31 0.3
x
0.29 0.28
o
0.27
+
0.26
*
0.25 -0.2
0
0.2
0.4
SNR
0.6
0.8
1
b) 1.2
0.33 0.32 0.31
x
0.3 0.29 0.28
o
0.27
+
0.26 0.25 -0.2
0
0.2
0.4
0.6
0.8
* 1
c) 1.2
SNR
Fig. 9. Probability of error as a function of the stego message SNR: a) Method 1; b) Method 3; c) Method 5 (? - p=0.2, x – p=0.4, o - p=0.6, + - p=0.8, * - p=1.0)
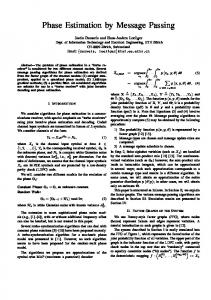
To test the proposed detection method on real images, the stego message length estimation (for k = ±1) was done for a set of 120 grayscale images acquired by three types of digital cameras (Fig. 10) with different image resolution (8 images with 1024×756 pixels, 70 with 1280×960, and 42 with 1600×1200) and different level of compression corresponding to JPEG quality factors ranging from 65 to 93. Fig. 10 illustrates the fact that the accuracy of stego message length estimation strongly depends on the image source, resolution, and content because these factors influence the local image variation and thus the stego message SNR. The limitation of the proposed method is illustrated in Fig. 11, where the mo st interesting case of ±k steganography, k = ±1, is analyzed. Fig. 11 was calculated for ML stego message estimation from (4) (see Fig. 7, a). Marked areas were obtained by averaging the stego message SNR over a set of cover images.
1
0.8
0.6
0.4
0.2
0 0
20
40
60
80
100
120
Fig. 10. Stego message length estimation for 120 digital camera images (plus - p=0; diamond - p=0.25, star - p=0.5, square - p=0.75, cross - p=1).
The proposed estimation procedures for the cover image and the stego message lead to an improvement in the stego message SNR from the original range of [–43, –36]dB to [0.3, 1]dB. However, this improvement still does not allow reliable stego message detection. Reliable results are expected after further improving the stego message SNR by additional 3–5dB. We support this claim based on our analysis of the embedding with k = ±2, ±3 because increasing the stego message amplitude causes approximately the same improving of the stego message SNR, as required by the proposed method to achieve reliable stego message estimation. Also it has to be mentioned, that all results presented in this paper were obtained for decompressed JPEG images that were previously compressed with different quality factors. Application of even high quality compression causes significant reduction of the local variation of cover image intensity, therefore, reliable stego message detection and parameter estimation in raw images is a more complex problem. 1
Initial stego message SNR
Probability of error
0.9 0.8 0.7 0.6
Stego message SNR after proposed method application
0.5 0.4 0.3 0.2
Area of reliable stego message estimation
0.1 0 -40
-35
-30
-25
-20
-15
-10
-5
0
5
10
SNR Fig. 11. Probability of erroneous estimation as a function of stego message SNR obtained from Fig. 7, a) (ML estimator). The highlighted areas were obtained by averaging the stego message SNR over a small set of cover images
4. CONCLUSIONS AND FUTURE PERSPECTIVE In this paper, we develop steganalysis methods for ±k steganography – an embedding process equivalent to adding a noise signal with three possible values –k, 0, and k to the cover image. For k=1, this type of embedding is a trivial modification of LSB embedding (the message reader stays the same). The detection of this steganography, however, is much more difficult than for LSB embedding for which reliable detection is known 4–9 .
In our approach to steganalysis, we strive to estimate the number of embedding changes and thus estimate the relative length of the embedded message. We present a stochastic approach based on sequential estimation of cover image and stego message. We work in the wavelet domain where the cover image is modeled using the non-stationary Gaussian model and the stego signal using Gaussian and Generalized Gaussian models. ML and MAP estimators were created for stego message estimation. As opposed to previous approaches to detection of this type of steganography14,15 , the proposed method works for both grayscale and color images. In fact, we treat color images as three-times larger grayscale images. The performance of the method improves with increasing amplitude of the stego signal. For k = ±3, a good separation between embedded and non-embedded images was obtained using Method #3 and 4 (see Section 3). Because the larger amplitude increases the stego message SNR, stego messages can be successfully detected in a wider range of cover images and in a larger number of image regions. Taking into account the dependence of stego message parameters estimation on the cover image content, decreasing the amplitude k reduces the estimation reliability. However, for certain types of cover images successful estimation can still be obtained even for k = ±1. The accuracy of the message length estimation is better for images with a suppressed high frequency component, for example due to lossy JPEG compression. We have also estimated the necessary improvement in the stego message SNR that would enable reliable steganalysis using the proposed approach. The results presented in this paper confirm the importance of accurate cover image estimation for steganalysis because its quality influences the reliability of the detection in a major manner. Also, in this paper we used the simplest assumption about the cover image model (i.i.d.). Further improvement is expected by taking into consideration inter and intraband dependencies of wavelet coefficients in the cover image model. In our future work, we plan to investigate other redundant wavelet transforms (overcomplete wavelets, steerable pyramid, etc.) and improve the cover image and the stego message stochastic models. It remains to be seen if these improvements will be sufficient for reliable and accurate estimation of secret message length in noisy images, such as never compressed images, scans, or certain resampled images. We consider this challenging problem as an open field for future investigation. The results obtained in this paper also point to certain design principles for building better steganographic schemes. First, non-adaptive embedding in the spatial domain should be replaced with adaptive embedding based on either local structure or some other side information available to the sender. The approach presented in this paper heavily relies on the fact that the embedding is non-adaptive and es timates the message length from those segments in the stego image that allow easier and more accurate modeling, such as flat or smooth areas. Second, the steganographer should pay close attention to the selection of the cover image. Obviously, images with rich texture and/or areas that do not allow reliable modeling should be chosen. Decompressed (and processed) JPEG images are highly discouraged for spatial domain steganography (also due to the threat of JPEG compatibility steganalysis 25 ).
5. ACKNOWLEDGEM ENTS The work on this paper was supported by Air Force Research Laboratory, Air Force Material Command, USAF, under a research grant number F30602-02-2-0093. The U.S. Government is authorized to reproduce and distribute reprints for Governmental purposes notwithstanding any copyright notation there on. The views and conclusions contained herein are those of the authors and should not be interpreted as necessarily representing the official policies, either expressed or implied, of Air Force Research Laboratory, or the U. S. Government.
6. REFERENCES 1. R.J. Anderson and F.A.P. Petitcolas, “On the Limits of Steganography”, IEEE Journal of Selected Areas in Communications, Special Issue on Copyright and Privacy Protection, vol. 16(4), pp. 474−481, 1998. 2. C. Cachin, “An information-theoretic model for steganography”, in: D. Aucsmith (ed.): Information Hiding, 2nd International Workshop, LNCS vol. 1525, pp. 306–318, 1998. 3. S. Katzenbeisser and F.A.P. Petitcolas, “On Defining Security in Steganographic Systems”, Proc. SPIE Electronic Imaging, Security, Steganography, and Watermarking of Multimedia Contents IV, San Jose, pp. 50–56, 2002. 4. A. Westfeld and A. Pfitzmann, “Attacks on Steganographic Systems”, in: A. Pfitzmann (ed.): Informatin Hiding, 3 rd International Workshop, LNCS vol.1768, Springer-Verlag, Berlin, pp. 61−75, 2000.
5. R. Chandramouli and N. Memon, “Analysis of LSB Based Image Steganography Techniques”, Proc. of ICIP 2001, Thessaloniki, Greece, October 7– 10, 2001. 6. S. Dumitrescu, X. Wu, and Zhe Wang, “Detection of LSB Steganography via Sample Pair Analysis”, in: F.A.P. Petitcolas (ed.): Information Hiding, 5th International Workshop, LNCS vol. 2578, Springer-Verlag, New York, pp. 355–372, 2003. 7. J. Fridrich, M. Goljan, and R. Du, “Detecting LSB Steganography in Color and Gray-Scale Images”, Magazine of IEEE Multimedia, Special Issue on Security, October-November issue, pp. 22–28, 2001. 8. A. Ker, “Quantitative Evaluation of Pairs and RS Steganalysis”, Proc. SPIE Electronic Imaging, Security, Steganography, and Watermarking of Multimedia Contents VI, San Jose, January 19–22, pp. 83–97, 2004. 9. A. Ker, “Improved Detection of LSB Steganography in Grayscale Images”, in: J. Fridrich (ed.): Information Hiding, 6 th International Workshop, LNCS, vol. 3200, 2004 (to appear). 10. L.M . Marvel, C.G. Boncelet, and C.T. Retter, “Reliable Blind Information Hiding for Images”, in: D. Aucsmith (ed.): Information Hiding: 2nd International Workshop, LNCS, vol. 1525, Springer-Verlag, New York, pp. 48–61, 1998. 11. F. Alturki and R. Mersereau, “A Novel Approach for Increasing Security and Data Embedding Capacity in Images for Data Hiding Applications”, Proc. of ITCC, Las Vegas, Nevada, pp. 228– 233, 2001. 12. T. Sharp, “An Implementation of Key-Based Digital Signal Steganography”, in: I. S. Moskowitz (ed.): Information Hiding, 4 th International Workshop, LNCS 2137, Springer-Verlag, New York, pp. 13–26, 2001. 13. J. Fridrich and M. Goljan, “Digital Image Steganography Using Stochastic Modulation”, Proc. SPIE Electronic Imaging, vol. 5020, Santa Clara, pp. 191–202, 2003. 14. J.J. Harmsen and W.A. Pearlman, “Steganalysis of Additive Noise Modelable Information Hiding”, Proc. SPIE Electronic Imaging, Security, Steganography, and Watermarking of Multimedia Contents V, vol. 5020, Santa Clara, pp. 131–142, 2003. 15. A. Westfeld, “Detecting Low Embedding Rates”, in F.A.P. Petitcolas (Ed.): Information Hiding, 5th International Workshop, LNCS, vol. 2578, 2002, pp. 324–339. 16. P. Moulin and M.K. Michak, “The Parallel-Gaussian Watermarking Game”, IEEE Trans. on Information Theory, vol. 50(2), pp. 272– 289, February 2004. 17. S. Mallat, “A Theory for Multiresolution Signal Decomposition: The Wavelet Representation,” IEEE Trans. on Pattern Anal. Machine Intell., vol. 11, pp. 674–693, July 1989. 18. D.L. Donoho and I.M. Johnstone, “Ideal Spatial Adaptation by Wavelet Shrinkage,” Biometrika, pp. 425– 455, 1994. 19. S.G. Chang, B. Yu, and M. Vetterli, “Spatially Adaptive Wavelet Thresholding with Context Modeling for Image Denoising,” in: Proc. IEEE Int. Conf on Image Proc., Chicago, October 1998. 20. S.M. LoPresto, K. Ramchandran, and M.T. Orchard, “Image Coding Based on Mixture Modeling of Wavelet Coefficients and a Fast Estimation-Quantization Framework,” in: Proc. Data Compression Conf., March 1997. 21. M.K. Michak, I Kozintsev, and K. Ramchandran, “Lo w-Complexity Image Denoising Based on Statistical Modeling of Wavelet Coefficients,” IEEE Signal Processing Letters, vol. 6(12), pp.300–303, December 1999. 22. S. Voloshynovskiy, O. Koval, and T. Pun, “Wavelet-Based Denoising Using Non-stationary Stochastic Geometrical Image Priors”, in: Proc. SPIE Electronic Imaging, Image and Video Communications and Processing V, Santa Clara, California, January 20–24, 2003. 23. M. Lang, H. Guo, J. Odegard, C. Burrus, and R. Wells, “Noise Reduction Using an Undecimated Discrete Wavelet Transform”, IEEE Signal Processing Letters, vol. 3(1), pp. 10–12, January 1996. 24. P. Felzenszwalb, D. Huttenlocher, “Image Segmentation Using Local Variation,” Proc. IEEE Conference on Computer Vision and Pattern Recognition, pp. 98– 104, 1998. 25. J. Fridrich, M. Goljan, and R. Du, “Steganalysis Based on JPEG Compatibility”, SPIE Multimedia Systems and Applications IV, vol. 4518, Denver, CO, August 20−24, pp. 275–280, 2001.