subtraction method for enhancing the flaw signal to structural noise ... Second step, the wavelet domain processing, usually use a non-linear ... However, the noise is random, and it is not possible to obtain a .... step are negative are set to zero.
Proceedings of the International Congress on Ultrasonics, Vienna, April 9-13, 2007, Paper ID 1290, Session R15: NDT: Industrial doi:10.3728/ICUltrasonics.2007.Vienna.1290_izquierdo applications
Structural noise reduction using multiresolution-based spectral subtraction MAG Izquierdo1, M.G. Hernández2, M.Molero1,2, J.J. Anaya2 1
Departamento de Señales, Sistemas y Radiocomunicaciones. ETSI Telecomunicación (UPM). Madrid. Spain 2 Instituto de Automática Industrial (CSIC). Arganda del Rey, (Madrid). Spain.
filtering [5] or adaptive filtering techniques [6].
Abstract: In ultrasonic non destructive evaluation (UT-NDE) of highly scattering materials, detection of little flaw echoes is difficult due to the masking effect of the structural noise. Most of the proposed techniques for enhancing the flaw visibility do not exploit the spectra of the structural noise and the incoming flaw signal depth dependency. They assume homogeneous behavior of the insonified material in order to design the processing algorithms. In this work, a multiresolution-based spectral subtraction method for enhancing the flaw signal to structural noise ratio (SNR) is proposed. This method, using the wavelet transform, exploits the non-stationary characteristic of the structural noise. First step of this algorithm is the time-scale estimation of several statistics of the structural noise. On the second step, non-linear over-subtraction of the raw signal wavelet transform is applied. This strategy produces improved results in SNR compared with linear and non- over-subtraction techniques. Next, a post-processing based on exploiting additional information from the physical knowledge of the structural noise is applied and finally the inverse Wavelet Transform obtains the output processed signal. Experimental results are also included showing that the proposed method dramatically increase the visibility of the flaw echoes.
Many of these techniques assume stationarity of the structural noise as an initial hypothesis in order to validate the proposed algorithms. However, received echo has a nature that can dramatically differ from stationarity. When a transducer is excited by an electrical pulse and generates an ultrasonic wave, this wave travels through the grained and scattering structure of the material. This structure change the shape and the spectral content of the front wave. Attenuation produced by dispersion produce that high frequencies are more severely attenuated than low frequencies. In this work, a wavelet de-noising method for the reduction of the structural noise is proposed. Wavelet is a time-scale processing tool oriented to the analysis of nonstationary signals like traces containing structural noise. Wide majority of wavelet de-noising procedures can be summarized as (i) wavelet transform of the noisy register (ii) transform domain processing, that generally is pruning and/or thresholding of the wavelet coefficients and (iii) reconstruction of the de-noised signal by inverse transform. This structure has been followed in the proposed method but with several variations. Most previous works on wavelet de-noising use the Discrete Wavelet Transform (DWT). The transform tool used in this work is the undecimated wavelet (UWT) due to the following useful properties: (i) UWT is a translation invariant transform. This property is very desirable because the flaw is represented by the same coefficients with position independency. DWT does not have this property. (ii) UWT is a redundant representation of the analyzed signal. This property can facilitate and enhance the statistical analysis and characterization of noisy signals. This analysis is an important step of the proposed method. DWT is a nonredundant representation.
Key words: Ultrasonic NDE/NDT, dispersive materials, signal processing, SNR enhancement.
A Introduction In UT non-destructive evaluation of highly scattering materials (stainless and austenitic steel, titanium, composite materials) little flaw signals are usually masked by the structural noise. This coherent noise cannot be eliminated by conventional techniques like classical filtering or temporal averages.
Second step, the wavelet domain processing, usually use a non-linear method for cancelling the noise coefficients. Two main strategies are chosen hard and softthresholding. Last strategy has superior performance in structural noise elimination. After the election of the strategy, wavelet processor designer has to choose the threshold level. Most proposed rules in order to chose the proper level are based in white noise reduction applications like Minimax, Universal and SURE [7]. However, due to the original applications, these rules do not consider the non-stationary nature of the structural
In the literature, several techniques have been proposed for enhancing the signal to noise ratio (SNR) of signals coming from scattering materials. Spatial and spectral diversity techniques [1] compose several A-scan traces for obtaining a unique trace with enhanced SNR. On the other hand, a more interesting approach is to use only one trace for enhancing the defect visibility, like Split Spectrum Processing (SSP)[2], maximum likelihood estimation (MLE) [3], group delay moving entropy [4] noise suppression with low-frequencies band pass
-1-
Proceedings of the International Congress on Ultrasonics, Vienna, April 9-13, 2007, Paper ID 1290, Session R15: NDT: Industrial doi:10.3728/ICUltrasonics.2007.Vienna.1290_izquierdo applications
given by [8]:
noise. The pruning method used in this work is a variation of the spectral subtraction technique. This method has been traditionally used in voice applications and is based on the power spectral density analysis of the interfering noise. The principles of this technique have been adapted to the time-scale processing.
( ) { }
std eˆi ,k α (SNRi ,k ) = 1 + E eˆi ,k
( )
where the function std eˆi ,k is the standard deviation of the noise coefficients at scale i and time k. The idea behind the expression in (6) is to apply a minimal substraction factor in high SNR levels. Expressions for evaluating the non-linear estimate of the spectral density has been proposed in voice applications. Lockwood and Budy [9] suggested the following function as a nonlinear estimator of the noise spectrum.
B Principles of the multiresolution spectral subtraction method B.1 SPECTRAL SUBSTRACTION The noisy flaw trace register x, is assumed to consist of the noise-free flaw echo s, and the random coherent noise e. x=s+e
eˆi , k
(1)
Because the Wavelet transform is linear, the corresponding WT coefficients can be written as: x i , k = s i ,k + ei ,k
{ }
max eˆi ,k
(8)
over M traces
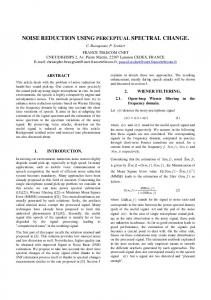
B.2 THE MULTIRESOLUTION SPECTRAL SUBSTRACTION METHOD Proposed method is described by the block diagram shown in figure 1. Two different stages can be distinguished in this method: (a) Information extraction from pure coherent noise, and (b) raw signal processing for visibility enhancement of the defects. Pure noise traces WT
Estructural noise scalogram estimation Scalogram statitics
(4)
where the estimation of the noise is performed with the linear expected value operator, E{·}, and α is a gain factor to rescale the threshold level. Note that using the spectral subtraction technique, the sign information is lost. Soft-thresholding operation is performed on the expected WT coefficients module. Coefficients moduli higher than the threshold is shrunk toward zero, and the others are set zeros.
(7)
max eˆi , k
over M traces
std eˆi ,k sˆi ,k = xi ,k − 1 + E eˆi ,k
(3)
sˆi ,k = x i ,k − α ·E eˆi ,k
=
( )· { }
where xi,k , si,k and ei,k are the WT coefficients of the noisy signal, the noise-free signal, and the noise respectively. Thus, when the WT coefficients from noise, ei,k, are available, the noise free coefficients can be recovered by subtracting ei,k form xi,k at any scale i and translate k. However, the noise is random, and it is not possible to obtain a precise estimation of the WT coefficient for the noise. Characterization of the noise is based on the distribution of the energy on the time-scale plane (scalogram). Thus, based on this information it is possible to apply a linear spectral-subtraction-like method (scalogram subtraction) that follows the expression:
NL
So, the final time-scale non-linear spectral subtraction method has the following expression, that results by combining (7), (8) and (9).
(2)
si ,k = xi ,k − ei ,k
(6)
{ }
E eˆi,k , std( eˆi ,k ),α(SNRi,k ), eˆi,k NL
_ Raw data
WT
Eliminate lower details
|·|
+
+
PSSP
+
IWT
Processed trace
sign(·) Second stage
Figure 1. Multiresolution Spectral Subtraction algorithm block diagram.
However, the algorithm presented in this paper use a non-linear spectral subtraction method. These family of techniques are heuristic methods that utilise estimates of the local signal to noise ratio, and the observation that at a low signal to noise ratio over-subtraction can produce improved results. The general expression of nonlinear spectral subtraction may be described by the following equation: sˆi ,k = xi ,k − α (SNR i ,k )· eˆi ,k (5)
First stage: Information extraction from pure coherent noise traces. In this phase, that is off-line, several noisy traces are processed in order to obtain several time-scale noise statistics:
NL
where α(SNRi,k) is a SNR-dependent subtraction ˆi,k is a non linear estimate of the noise factor, and e NL spectrum.
•
The average estimation of the structural noise scalogram E{ eˆi ,k } .
•
The scalogram standard deviation std ( eˆi ,k ) .
•
, by selecting The non-linear estimator eˆi , k NL the maxima of all the scalograms, proposed in (7).
Another information that is extracted in this phase is the scale with the highest energy. This information is
One form of a SNR dependent subtraction factor is
-2-
Proceedings of the International Congress on Ultrasonics, Vienna, April 9-13, 2007, Paper ID 1290, Session R15: NDT: Industrial doi:10.3728/ICUltrasonics.2007.Vienna.1290_izquierdo applications
only structural noise.
going to be used in the second phase for exploiting the fact that the flaw energy is in the lower half-band of the transducer [6,7]. So, details that represent to higher halfband frequencies can be eliminated.
Figure 2 shows the time-frequency distribution of the structural noise. The spectrogram has been computed by averaging 30 noise traces. In order to eliminate the interface echoes, the figure shows the structural noise ranging from 12 to 100 mm. depth.
Second stage: Raw signal processing for visibility enhancement of the defects.
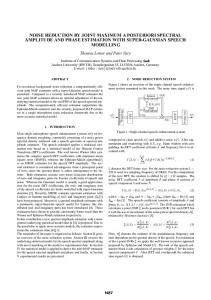
The Multiresolution Spectral Subtraction Method use 30 noisy signals for estimating the parameters related with the first stage of the algorithm. Mother wavelet dB6 has been employed. Figure 3 shows four details and the approximation of the structural noise. Continuous line shows the scalogram average, E{ eˆi ,k } , and with dotted line we can see the maxima of the scalograms, .eˆi ,k NL
First step of this phase is to make a UWT transform of the flaw trace. Coefficients of lower scales to the scale with the highest energy are set to zero. Moduli of the coefficients are computed and sign information is stored to be recovered at the end of the processing. Next step is to apply the modified spectral subtraction method explained above (8). Coefficients that after this step are negative are set to zero. However, when applying the non-linear spectral subtraction method is easy that survive isolated and little coefficients that will appear in the reconstructed signal as artifacts. When a spectral subtraction method is used, it is necessary to add a postprocessing stage. This stage is indicated in the figure 1 as PSSP (Post-Spectral Subtraction Processing), and with it, we are going to apply the following reasoning: if a coefficient has all neighbours coefficients set to zero (in its own scale and in higher and lower scales), this coefficient is an artifact that is the result of the spectral subtraction method and must be cancelled, in the other hand, when a coefficient represent to a defect has neighbours coefficients that are not zero.
(a) 0.03 0.02 0.01 0 0.1
10
15
20
25 µs
5
10 (c)
15
20
25 µs
5
10 (d)
15
20
25 µs
5
10
15
20
25
5
10
15
20
25
(b)
0.06 0.02 0.1
0
0.06 0.02 0 0.08 0.06 0.04 0.02 0
Last step is to recover the non-zero coefficient sign and apply the inverse UWT to obtain the processed signal.
frequency(MHz)
5
(e)
0.06
50 45 40 35 30
0.04 0
Figure 3. Undecimated wavelet analysis of the structural noise. This figure shows two statistics of the noise. The average scalogram E eˆi , k
{ }
(continuous line) and the maxima of the scalograms eˆ i,k
25 20 15 10 5
(dotted line). NL
(a)(b)(c)(d) are the details 1, 2 3 and 4. (e) is the approximation 4.
0 0
5
10 15 time(µs)
20
We can infer from this figure that using the maxima of the scalograms is a very restrictive threshold for the structural noise coefficients, meanwhile flaw coefficients are higher than this threshold. We can also observe from this analysis that lower details are very affected by the stainless steel exponential attenuation law, meanwhile large details not. This is a direct effect of the attenuation due to dispersion of the highly scattering materials.
25
Figure 2. Stainless steel block experimental results. Time-frequency distribution of the structural noise.
Figure 4 shows several results of the Multiresolution Spectral Subtraction Method. The obtained results have been evaluated using the SNR. The SNR is defined as the quotient of the peak value of the trace determined in a time window around the zone of the trace where the flaw signal is located divided by the standard deviation of the whole trace. When the de-noising procedure is very severe, the trace portion outside the flaw region may provide a very small standard deviation and therefore the obtained SNR can be abnormally high. For this reason, the standard deviation of the whole trace is used in this
C Experimental Results A rectangular shaped 80x120x110 mm3 stainless steel block has been employed for the experimentation. It has been inspected with a 20 MHz and 83% bandwidth transducer. Several transversal holes with φ2 mm. and deeps at 30, 40, 50 and 70 mm. have been made. From the top view, holes are located each 2 cm, a distance less than the beam width. Signals have been digitised at 100 MHz and 256 averages have been applied in order have
-3-
Proceedings of the International Congress on Ultrasonics, Vienna, April 9-13, 2007, Paper ID 1290, Session R15: NDT: Industrial doi:10.3728/ICUltrasonics.2007.Vienna.1290_izquierdo applications
work. This definition is useful as for the raw input traces as for the output processed traces: defect_peak_value SNR = trace_standard_deviation
D Conclusions A new method for structural noise reduction has been presented in this work, the Multiresolution Spectral Subtraction Method.
(11)
This method is based on using the undecimated wavelet analysis for exploiting the non-stationary nature of the structural noise. The first stage of this algorithm obtains time- scale statistical information of the structural noise. The second stage is based on this information by applying a non-linear spectral-substraction-like. Next, a post processing for artifact elimination and finally the inverse UWT obtains the processed signal.
Figure 4(a) shows the captured experimental signal AC#1, coming from a defect located at 30mm. deep. SNR=2.05. Figure 4(b) shows the output of the Multiresolution Spectral Subtraction Method. A dramatically visibility enhancement of the defect has been obtained, SNR=13.09. Figure 4(c) shows two defects located at 50 and 70 mm depth, with a SNR =7.03. Fig, 4(d) shows the output with the proposed algorithm with a SNR=18.05. Again a considerable enhancement of the flaw visibility can be observed.
Experimental results have shown that the proposed technique is very effective for enhancing the defect visibility, specially for materials that have a highly scattering nature.
(a) 0.1 0.05 0 -0.05 -0.1
E Acknowledgements The authors would like to thank the financial support of Spanish Ministry of Science and Education with project DHORAVE BIA2006-15188-C03-01
0 x 10
5 -3
10 (b)
15
20
F Literature
25 µs [1]
P.M.Shankar, "Speckle reduction in ultrasound B-scan using weighted averaging in spatial compounding" IEEE UFFC. vol. 33, pp.744-758. 1986. [2] V.L.Newhouse, N.M Bilgutay, "Flaw to grain echo enhancement by split spectrum processing", Ultrasonics,0059-68. 1982. [3] K.D.Donohue, "Maximum likelihood estimation of AScan amplutudes for coherent targets in media of unresolvable scatterers", IEEE UFFC, vol. 39 pp. 422431. 1992. [4] MAG Izquierdo, MG Hernandez, O. Graullera and L.G.Ullate, "Time-frequency Wiener filtering for structural noise reduction," Ultrasonics. vol. 40, pp. 259261, 2002. [5] MAG Izquierdo, M.G.Hernandez, JJ Anaya and O.Martinez, "Speckle reduction by energy time-frequency filtering," Ultrasonics, vol. 42, pp. 843-846, 2004. [6] MAG Izquierdo, M.G.Hernandez, JJ Anaya. "Time.varying prediction filter for structural noise reduction in ultrasonic NDE," Ultrasonics. Vol 44. pp.1001-1005.2006. [7] D.L Donoho. "De-noising by soft thresholding " IEEE trans. On information theory. vol. 41, pp. 613-627, 1995. [8] S.V.Vashegui, "Advanced signal processing and digital noise reduction. Ed. Wiley Teubner 1996. [9] P. Lockwood and J.Boudy , "Experiments with a nonlinear spectral subtractor (NSS), hidden Markov Models and the projection, for robust speech recognition in cars," in Speech Communication. vol. 11, pp. 215-228. 1992
1 0 -1 0
5
10 (c)
15
20
25 µs
0
5
10
15
20
25 µs
15
20
25 µs
0.1 0 -0.1 (d) 0.02 0.01 0 -0.01 -0.02 0
5
10
Figure 4. Experimental signals and processing results. (a) AC#1, echo coming from a defect located at 30 mm deep. SNR=2.05. (b) Processing result with the Multiresolution Spectral Subtraction Method SNR=13.0909 (c) AC#2, echo coming defects located at 50 and 70 mm. deep. SNR=7.03 (d) Processing result with the Multiresolution Spectral substraction Method SNR=18.05.
-4-