May 20, 2009 - the method allows to make comparison with penalized regression such as ridge regression2. ... software (v
Tanagra
1
Introduction
« Support vector machine » for regression. Support Vector Machine (SVM) is a well‐know approach in the machine learning community. It is usually implemented for a classification problem in a supervised learning framework. But SVM can be used also in a regression problem, where we want to predict or explain the values taken by a continuous dependent variable. We say Support Vector Regression in this context 1 (SVR). The method is not widely diffused among statisticians. Yet it combines several desirable properties compared with existing techniques. It has a good behavior even if the ratio between the number of variables and the number of observations becomes very unfavorable, with highly correlated predictors. Another advantage is the principle of kernel (the famous "kernel trick"). It is possible to construct a non‐ linear model without explicitly having to produce new descriptors. A deeply study of the characteristics of the method allows to make comparison with penalized regression such as ridge regression 2. The first subject of this tutorial is to show how to use two new SVR components of the 1.4.31 version of Tanagra. They are based on the famous LIBSVM library (http://www.csie.ntu.edu.tw/~cjlin/libsvm/). We use the same library for the classification (see C‐SVC component, http://data‐mining‐ tutorials.blogspot.com/2008/11/svm‐using‐libsvm‐library.html). We compare our results to those of the R software (version 2.8.0 ‐ http://cran.r‐project.org/). We utilize the e1071 package for R (http://cran.r‐ project.org/web/packages/e1071/index.html). It is also based on the LIBSVM library. The second subject is to propose a new assessment component for the regression. It is usual in the supervised learning framework to split the dataset into two parts, the first for the learning process, the second for its evaluation, in order to obtain an unbiased estimation of the accuracy. We can implement the same approach for the regression. The procedure is even essential when we try to compare models with various complexities (or various degrees of freedom). We will see in this tutorial that the usual indicators computed on the learning data are highly misleading in some situations. We must use an independent test set when we want assess a model (or use a resampling scheme).
2
Dataset
We use the QSAR.XLS 3 data file. We want to predict a biological activity from chemical structure 4. The data file contains 74 examples and 25 variables: the dependent attribute is ACTIVITY; the variables from 1
http://en.wikipedia.org/wiki/Support_vector_machine
;
http://eprints.pascal‐
network.org/archive/00002057/01/SmoSch03b.pdf ; http://users.ecs.soton.ac.uk/srg/publications/pdf/SVM.pdf 2
N. Christianni, J. Shawe‐Taylor, « An introduction to Support Vector Machines and other kernel‐based learning
methods », Cambridge University Press, 2000, section 6.2.2. 3
http://eric.univ‐lyon2.fr/~ricco/tanagra/fichiers/qsar.zip
4
http://en.wikipedia.org/wiki/Quantitative_structure‐activity_relationship
20/05/2009
1/21
Tanagra P1_POLAT to P3_PI_DONER are the independent attributes; SUBSET is used for subdividing the dataset in a train set (30 examples) and test set (44 examples).
3
Multiple linear regression with Tanagra
First we want to study the behavior of the state of the art regression technique i.e. the linear regression 5. Our idea is to compare the behavior of the SVR with this method. Is the SVR is really better for our QSAR problem?
3.1
Data importation
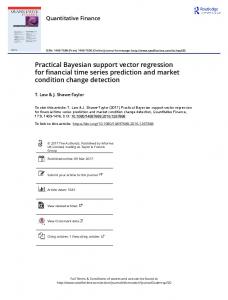
After we launch Tanagra, we click on the FILE / NEW menu. We select the data file QSAR.XLS 6.
The diagram is automatically created. The dataset is loaded. Tanagra displays the number of examples and variables in the current data file.
5
http://en.wikipedia.org/wiki/Linear_Regression
6
Tanagra can handle directly the XLS file format. In this context, the dataset had not in the same time to be loaded
into Excel (http://data‐mining‐tutorials.blogspot.com/2008/10/excel‐file‐format‐direct‐importation.html). We can also use an add‐on to send the dataset from Excel to Tanagra. The process is very simple in this situation (http://data‐ mining‐tutorials.blogspot.com/2008/10/excel‐file‐handling‐using‐add‐in.html)
20/05/2009
2/21
Tanagra
3.2
Subdividing the dataset into train and test sets
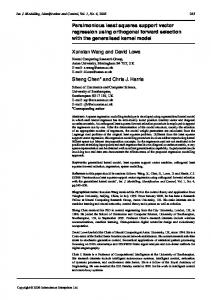
We want to use the SUBSET column for the dataset subdivision. We insert the DISCRETE SELECT EXAMPLES (INSTANCE SELECTION tab) component into the diagram. We set the following parameters by clicking on the PARAMETERS contextual menu.
We validate and we click on the VIEW menu. We see that 30 examples are assigned to the learning phase; the others (44 examples) will be used for the assessment of models. 20/05/2009
3/21
Tanagra
3.3
Dependent variable and independent variables
The DEFINE STATUS component allows to specify the types of variables. We set ACTIVITY as TARGET; the others as INPUT. The SUBSET column is not used here.
3.4
Linear regression
We insert the MULTIPLE LINEAR REGRESSION component (REGRESSION tab) into the diagram. We click on the VIEW menu in order to launch the calculations.
20/05/2009
4/21
Tanagra
The model seems very good, the coefficient of determination is R² = 98.88% i.e. 98.88% of the variability of the dependent variable is explained by the model. But stopping the analysis at this stage would be a mistake. The number of independent variables is high in relation to the number of examples. An overfitting can occur. It would be judicious to assess the quality of the model on a dataset which has not contributed to its construction. It is the purpose of the test sample.
3.5
Evaluation on the test sample
We want to compare the observed values of the dependent attribute (ACTIVITY) with the predicted values of the model on the test sample defined by SUBSET = TEST. We must specify the type of variables with the DEFINE STATUS component: we set ACTIVITY as TARGET; PRED_LMREG_1, automatically added by the regression component, as INPUT.
20/05/2009
5/21
Tanagra We can now insert the REGRESSION ASSESSMENT component. We set the parameters in order to make the comparison on the unselected examples at the beginning of the diagram i.e. the test sample.
We click on the VIEW menu. These results deserve some explanation.
The residual sum of squares of the model is computed as follows
RSS model = ∑ ( y i − yˆ i ,model ) 2 = 0.9722 i
The smaller is the obtained value, the better is the model. But the value in itself is not really informative. We must compare this one to a reference situation. 20/05/2009
6/21
Tanagra We call "default model" the model which does not use the information from the independent variables for the prediction of the dependent variable. According to least square principle, the default model is simply the mean of the dependent variable computed on the training sample i.e. yˆ i ,default = y train . So, the residual sum of squares of the default model is
RSS default = ∑ ( y i − yˆ i ,default ) 2 = 0.5536 i
We can now define the pseudo‐R2 criterion as follows
Pseudo − R 2 = 1 −
RSS model RSS default
When we have a perfect model, Pseudo‐R2 = 1; if our model is not better than the default model, Pseudo‐ R2 = 0; if our model is worse than the default model, Pseudo‐R2