Supporting Information 1: Image processing workflow Steffen Schl¨ uter*1 , Hans-J¨org Vogel1,2 , 1 Dept. Soil Physics, Helmholtz-Centre for Environmental Research - UFZ, Halle, Germany 2 Institut f¨ ur Agrar- und Ern¨ahrungswissenschaften, Martin-Luther-Universit¨ at Halle-Wittenberg, Halle, Germany *
[email protected] All image processing steps are summarized in Fig 1 for a small subset of Fig 1 of the main paper. Noise in the raw images was removed with a non-local means denoising filter (Fig 1b) [1] as implemented in the ImageJ plugin by Thorsten Wagner. The non-local means filter is applied with an estimated noise level of five gray values. Thresholds for three classes are detected automatically according to [2]. That is, thresholds are detected according to five standard, histogram-based threshold detection methods, e.g. maximum variance, minimum error, maximum entropy, etc. The average after outlier removal is used to compute the final set of thresholds. This threshold detection is implemented in the Quantim image processing library [3]. Global thresholding leads to a tentative segmentation into pores (black), aggregates (blue) and garnet (red) (Fig 1c). Partial volume effects due to limited image resolution cause false aggregate voxels around particles (green regions in Fig 1d). These thin films of aggregate voxels around particles are removed by an ImageJ macro [4] that (i) erodes the aggregate class by a spherical structuring element with a diameter dSE of five voxels (=40 µm), (ii) removes of all remaining clusters with a volume smaller than 10000 voxels (corresponds to volume of equivalent sphere with d=0.21 mm) and (iii) dilates of the remaining bigger aggregates by a spherical structuring element with dSE = 5 voxels. Subsequently, all holes in the aggregate class smaller than 100000 voxels (corresponds to volume of equivalent sphere with d=0.46 mm) stemming from occluded pores and particles are closed (purple regions in Fig 1d). The identification of particles is improved with a Laplacian of Gaussian (LoG) filter [5] for blob detection (Fig 1e) as implemented in the FeatureJ plugin for ImageJ by Erik Meijering. That is, spherical objects with a radius of σ, i.e. the standard deviation of the Gaussian kernel, evoke a strong signal in the second derivative of the smoothed image, whereas smaller objects have been removed. A scale-normalized LoG operator is constructed by taking the maximum of the various LoG operators at different spatial scales t each normalized (i.e. multiplied) with t = σ 2 [6]. In this study, σ = {1, 3, 5} voxels was used, which corresponds to an optimally detected diameter of d = {24, 56, 88} µm. Note that this range is slightly smaller than the true particle diameters (45 - 100 µm). The histogram mode (most frequent soil gray value) is subtracted from the image as a preprocessing step in order to remove edges between aggregates and pores from blob detection. Edges of larger grains are still enhanced and need to be masked out subsequently. This grain mask is achieved by applying a similar scheme of erosion, size-based removal and dilation as describe above but this time applied to the tentative garnet class. After these preparation steps the LoG image is segmented into particles and background with hysteresis thresholding [2, 7] (Fig 1f) which is implemented in the 3D Image Suite plugin for ImageJ by Thomas Boudier [8]. An upper threshold x b + a defines seed regions for a region growing process that detects all connected voxels above a lower threshold x b + b,
PLOS
1/3
1 2 3 4 5 6 7 8 9 10 11 12 13 14 15 16 17 18 19 20 21 22 23 24 25 26 27 28 29 30 31 32 33 34 35 36 37 38
where x b is the average gray value and a, b are manually defined parameters tuned for an optimal result (a = 40, b = 10). The combination of blob detection and partial volume voxel treatment leads to an improved segmentation result (Fig 1g). The tentative pore class is labeled differently depending on whether pores are fully enclosed by aggregates (yellow) or connected to the interaggregate pore space (black). All removed aggregate and garnet voxels are gathered in an unassigned class (white). Subsequently, different analysis are performed on different material classes, e.g. the pore size map is shown in (Fig 1h) and the distance map towards the interaggregate pores is shown in (Fig 1i). ImageJ macros, QuantIm code and elastix scripts are available from the authors upon request.
a
e
b
40 41 42 43 44 45 46 47 48
f 5.
4.
1.
39
0.5mm
2.
7.
6.
c
ge
d
1. Noise removal
3.
2. Global thresholding
6.
3. Aggregate extraction 4. Scale normalized LoG 5. Hysteresis thresholding 6. Merging & connectivity 7. Deformation analysis 8. Pore space analysis
9.
8.
h
i
9. Distance analysis
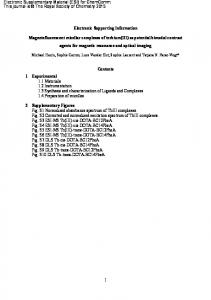
Fig 1. Image processing workflow for this study depicted for a small two-dimensional subset (a). Noise is removed with a non-local means filter (b). Image segmentation is performed in several steps. First, gray values are tentatively segmented into pores (black), aggregates (blue) and garnet (red) via simple thresholding (c). The volume voxel are removed from the aggregate class and holes in the aggregates are closed (d). Particles are detected with a Laplacian of Gaussian Filter (LoG) (e) and subsequent hysteresis thresholding of the LoG Image (f). Note that the edges of large grains are masked out during particle detection. For the final segmentation (g) the aggregate class is combined with the tentative pore class. The tentative garnet class is set to unassigned (white) and overwritten by the thresholded LoG image (red). Pores are further differentiated with respect to whether they are fully enclosed in soil aggregates (yellow) or not (black) (f). These images are subjected to different types of analysis (7.-9.) of which the pore size map is shown in (h) and the distance map towards the interaggregate pores is shown in (i).
References
49
1. Buades A, Coll B, Morel JM. A non-local algorithm for image denoising. In: IEEE Computer Society Conference on Computer Vision and Pattern Recognition, 2005. CVPR 2005. San Diego, CA, 20-25 June 2005. vol. 2; 2005. p. 60–65 vol. 2.
PLOS
2/3
50 51 52
2. Schl¨ uter S, Sheppard A, Brown K, Wildenschild D. Image processing of multiphase images obtained via X-ray microtomography: A review. Water Resources Research. 2014;50(4):3615–3639. doi:10.1002/2014WR015256.
53 54 55
3. Vogel HJ, Weller U, Schl¨ uter S. Quantification of soil structure based on Minkowski functions. Computers & Geosciences. 2010;36(10):1236–1245. doi:10.1016/j.cageo.2010.03.007.
56 57 58
4. Ferreira T, Rasband W. ImageJ User Guide - IJ 1.46r; 2012. Available from: http://imagej.nih.gov/ij/docs/guide/index.html.
59 60
5. Gonzalez RG, Woods RG. Digital Image Processing. Upper Saddle Creek: Prentice Hall; 2002.
61 62
6. Lindeberg T. Detecting salient blob-like image structures and their scales with a scale-space primal sketch: A method for focus-of-attention. International Journal of Computer Vision;11(3):283–318. doi:10.1007/BF01469346. 7. Schl¨ uter S, Weller U, Vogel HJ. Segmentation of X-ray microtomography images of soil using gradient masks. Computers & Geosciences. 2010;36(10):1246–51. doi:10.1016/j.cageo.2010.02.007. 8. Ollion J, Cochennec J, Loll F, Escud´e C, Boudier T. TANGO: a generic tool for high-throughput 3D image analysis for studying nuclear organization. Bioinformatics. 2013;29(14):1840–1841. doi:10.1093/bioinformatics/btt276.
PLOS
3/3
63 64 65
66 67 68
69 70 71