Technology, Pasadena, CA 91 125 USA. which is significantly advanced from the existing modeling tools. Though a switching converter is overall a nonlinear ...
405
IEEE TRANSACTIONS ON POWER ELECTRONICS, VOL. 9, NO. 4, JULY 1994
Switching Flow-Graph Nonlinear Modeling Technique Keyue Smedley, Member, IEEE, and Slobodan Cuk, Member, IEEE
which is significantly advanced from the existing modeling tools. Though a switching converter is overall a nonlinear system, it is equivalent to a linear circuit, the ON-circuit, when the switch is in the ON state, and it is equivalent to another linear circuit, the OFF-circuit, when the switch is in the OFF state. The ON-circuit and the OFF-circuit can be described by their respective flow-graphs. The Switching Flow-Graph is obtained by combining the flow-graphs of the ON-circuit and the OFFcircuit through the use of switching branches. The switching branches are the only nonlinear components in the Switching I. INTRODUCTION Flow-Graph; therefore, the modeling work is reduced to the WITCHING converters are pulsed and nonlinear dynamic switching branches. The Switching Flow-Graph technique is systems. Such a system may be stable in the vicinity of the very easy to use, and it provides a visual understanding operating point; however, if the system is perturbed enough to of switching converter systems. It can predict large-signal, cross a separatrix, it may never return to its operating point. A small-signal, and steady-state behavior of switching converter small-signal model does not predict the stability information systems. The result of the small-signal model is identical when the system is subject to large perturbations. A large- to the state-space averaging method, the result of the largesignal modeling tool is necessary to study the global dynamic signal model has been verified by experiments. This technique behavior of switching converters and to design robust systems. is described in Section 11. In Section 111, a buck converter There have been efforts in the past to model large-signal with input filter was built to verify the Switching Flow-Graph dynamics [2], [3]. [2] provides a large-signal trajectory study technique. Conclusion and discussions are given in Section IV. for sliding mode converter systems only. The model presented in [3] is in two forms, a discrete-time equation for use in 11. SWITCHING FLOW-GRAPH MODEL computer simulations and a continuous-time matrix expression Flow-graph is a symbolic language for the description of for physical understanding. Since the model is in a matrix form, discrete-time or continuous-time, the cause-and-effect linear dynamic systems that provides a graphic representation relationship between the circuit parameters and the circuit of the signal flow within the system. This language is extended dynamics are not very obvious. Those models [2], [3] do not to describe the nonlinear dynamics of switching converters. provide a unified general form for large-signal, small-signal, Flow-Graph Background and steady-state analysis. In this paper a general graphic nonlinear modeling tool, the The signals are represented by nodes, which are schematiSwitching Flow-Graph technique, is developed to reveal the cally represented by small circles in the diagrams. The nodes global and local dynamic properties of switching converters. are connected by branches, line segments with arrows. The This technique utilizes the state space averaging concept [ 11 signals flow only in the direction of the arrow on each branch. and is an extension of linear circuit flow-graph theory. The Each branch has a transmittance or gain indicated next to it proposed modeling tool is a graphic modeling tool, and for and the signals passing along that branch are multiplied by the first time clearly presents the cause and effect of the the branch transmittance. The signal at a node is the sum of large-signal dynamics of the switching converters, which gives all signals entering the node. Input nodes, nodes with output directions for parameter adjustment in the engineering design. branches only, represent independent variables. A normal node The proposed modeling tool provides unified large-signal, has both inputs and outputs, but can be considered as an output steady-state, and small-signal models for switching converters, node. A path is any collection of a continuous succession of
Abstract- A unified graphical modeling technique, “Switching Flow-Graph” is developed to study the nonlinear dynamic behavior of pulse-width-modulated (PWM) switching converters. Switching converters are variable structure systems with linear subsystems. Each subsystem can be represented by a flow-graph. The Switching Flow-Graph is obtained by combining the flowgraphs of the subsystems through the use of switching branches. The Switching Flow-Graph model is easy to derive, and it provides a visual representation of a switching converter system. Experiments demonstrate that the Switching Flow-Graph model has very good accuracy.
S
Manuscript received March 17, 1993; revised April 18, 1994. Keyue Smedley is currently with the Department of Electrical Engineering, University of,California, Irvine, CA 92717 USA Slobodan Cuk is with the Power Electronics Group, California Institute of Technology, Pasadena, CA 91 125 USA. IEEE Log Number 9404417.
branches traversed in the same direction. A forward path is a path that starts at an input node and ends at an output node, along which no node is traversed more than once. A loop is a path that originates and terminates on the same node, and along which no other node is encountered more than once.
0885-8993/94$04,00 0 1994 IEEE
IEEE TRANSACTIONS ON POWER ELECTRONICS, VOL. 9, NO. 4, JULY 1994
Switching Flow-Graph Vg
I
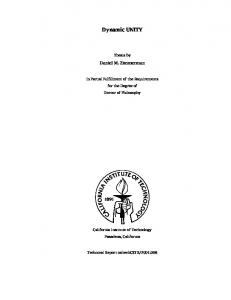
Fig. 1. The RC circuit.
0
0
VS
VC
0 Vx
0
0 VR
0
k
in
\
-
1
Vc
CS
k
1
R
VR
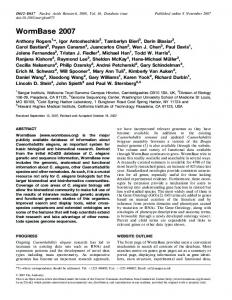
(b) Fig. 2. (a) Five nodes of the RC circuit. (b) The flow-graph of the RC circuit.
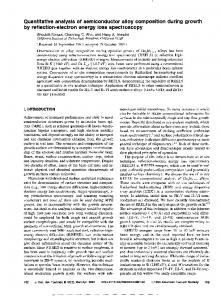
The procedure for constructing the flow-graph of a system is straightforward. First each variable of interest is assigned a node on the flow-graph. Next the nodes are interconnected as required by the specific system configuration. Once all the nodes are properly connected, the flow-graph is complete. Consider a simple RG circuit as an example as shown in Fig. 1, where vg is the input voltage, v c is the voltage across the capacitor, ic is the capacitor current, i~ is the resistor current, and V R is the output voltage. To create the flow-graph for this RC circuit, first assign five nodes from left to right to denote vg, v c , ic,i ~and , V R ,respectively, as shown in Fig. 2 (a). From Kirchhoff's law, it is found that:
where C is the capacitance, R is the resistance, and s is the . relations are used Laplace complex number s = ( ~ + j w These to connect the nodes in Fig. 2 (a), to produce the flow-graph shown in Fig. 2 (b). The node that represents the input voltage vg is an input node, while the other nodes are normal nodes. V R is also considered as an output node. The path from vg to V R is a forward path. The path originating from node vc, traversing i,, ZR. VR, and ending at node vc forms a loop. From the flowgraph, the input to output transfer function can be obtained for the circuit:
ForwardGain 1 - LoopGain - RCs 1 + RCs
VR -
vg
To derive transfer functions for more complicated circuits, Flow-graph algebraic rules or Mason's formula [4] are recommended.
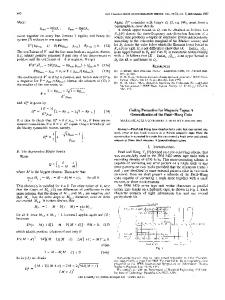
Switching converters are nonlinear dynamic systems; however, deeper insight reveals that switching converters are systems with variable structure. A switching converter, in continuous mode, contains two linear subcircuits. The subcircuits share common elements, such as inductors, capacitors, and resistors, connected in different topologies. The switch of the converter operates at a frequency, either constant or variable, and alters the system between the two linear subcircuits. This conceptual view provoked the motivation to model these two linear subcircuits using flow-graphs, then to relate the flowgraphs to each other using switching branches. Suppose a switching converter operates at a frequency f s ( t ) = &. When 0 < t < TON,switch S is ON, and when TON< t < T,, switch S is OFF. For the two positions of the switch S in the switching converter, the two switched subcircuits are obtained. Clearly a change in the topologicAI structure occurs within each period as the circuit configuration is periodically changed from the ON-circuit to the OFF-circuit. Both switched subcircuits are linear by themselves, while the converter is a nonlinear circuit due to the periodic structure change. During the time when the switch S is in the ON position, 0 < t < TON,the converter is switched to the ON-circuit. Nodes are assigned to each variable and are connected to form a flow-graph GON according to the ON-circuit configuration. During the time when the switch S is in the OFF position, TON< t < T,, the converter is switched to the OFF-circuit. The OFF-circuit contains the same circuit elements as those in the ON-circuit; therefore, it preserves the same variables. The same nodes, which were used for the ON-circuit, are used to represent the OFF-circuit variables. However, the nodes are connected according to the OFF-circuit configuration to form a flow-graph 6 0 ~ ~ . The two flow-graphs, DON and GOFF, have exactly the same nodes. However, some branches that exist in GON may not exist in GOFF, and some branches that exist in GOFF may not exist in GON. The two flow-graphs GON and GOFF can be topologically merged by the following equation:
where k and
are two complementary switching functions.
1 O 0.24. The measured transfer function and the predicted transfer function are plotted in Fig. 22. The predicted and the measured response match closely. Both the prediction and the measurement show that the phase shifts 540” at 2.4kHz. The measurement proved the prediction. The experiments proved that the large-signal Switching Flow-Graph model and the small-signal Switching FlowGraph model are very accurate.
%.
2.
IV. CONCLUSION The Switching Flow-Graph technique provides a unified graphical representation of the large-signal model, the smallsignal model, and the steady-state model for any given PWM switching converter. The graphic models are very easy to obtain and they yield a visual representation of switching converter systems. The large-signal model and the small-signal model are verified by experiments. The measurements and the theoretical predictions agree very well. This technique can be used to model very complicated switching converters, such as the coupled inductor converter, linear feedback systems, and nonlinear feedback systems, etc.
9
The modeling procedure is as follows: First, find the two subcircuits, the ON-circuit, when the switch is ON, and the OFF-circuit, when the switch is OFF, for the given switching converter. Second, draw the flow-graphs for the two subcircuits and combine them using the switching branches. Then, replace the switching branches with their large-signal switch models to obtain the large-signal Switching FlowGraph, replace the switching branches with their small-signal switch models to obtain the small-signal Switching FlowGraph, or replace the switching branches with their steadystate switch models to obtain the steady-state Switching FlowGraph . Finally, the algebraic rules of the flow-graph can be used to simplify the small-signal model or the steady-state model. The large-signal model is compatible with the TUTSIM simulation program. By simply entering flow-graph branches, the interconnections, the step size for the simulation, and the initial conditions, the program automatically generates the large-signal dynamic response. The large-signal model gives a global view of the system dynamics, which enables the designer to understand the limits of the system, and helps the designer to achieve robust control. The small-signal model provides analytic and graphic frequency response relations between each variable. This enables the designer to do smallsignal performance adjustments. These procedures may need to be repeated before a satisfactory closed-loop switching converter design is obtained. However, the approach using Switching Flow-Graph technique is faster, easier, and more robust than other modeling tools.
REFERENCES [I] S. Cuk and R. D. Middlebrook, “A general unified approach to modelling switching-converter power stages,” IEEE Power Electronics Specialists Conference, 1976. [2] R. Venkataramanan, A. Sabanovic, and S. Cuk, “Sliding mode control of dc-to-dc converter,” Intemational Conference on Industrial Electronics, Control and Instrumentations, 1985. [3] R. W. Erickson, “Large signals modeling and analysis of switching regulators,” IEEE Power Electronics Specialists Conference, 1982. [4] B. C. Kuo, Automatic ControlSysrems. Englewood Cliffs, NJ: Prentice Hall, 1991. IS] W. E. Reynolds and J. Wolf, TUTSIM User’s Manual, 1987.
SMEDLEY AND CUK: SWITCHING FLOW-GRAPH NONLINEAR MODELING TECHNIQUE
Keyue Smedley (S’87-M’90) received the B.S. and M.S. degrees in electrical engineering from Zhejiang University, China, in 1982 and 1985, respectively, and a Ph.D. degree in electrical engineering from the Califomia Institute of Technology, in 1991. Dr. Smedley was employed as an engineer at the Superconducting Super Collider from 1990 to 1992. She was responsible for determining the electrical characteristics of the superconducting magnet strings and designing the power conversion system for the collider. She has been a faculty member at the University of Califomia, Irvine, since 1992. Her areas of interest include modeling and control of switching converters, digital-PWM of switching power amplifications, power factor corrections, and electrical characteristics of superconducting magnets. She currently holds one US. patent for onecycle control. Dr. Smedley is a faculty member of Eta Kappa Nu.
413
Slobodan Cuk (M’74) received a B.S. degree from Belgrade University, Yugoslavia, in 1970, a M.S. degree from Santa Clara University, CA, in 1973, and a Ph.D. degree from the Califomia Institute of Technology in 1976. Dr. Cuk is on full-time appointment as an Associate Professor of Electrical Engineering in the Division of Engineering and Applied Science at the Califomia Institute of Technology. He is well known in the field of power conversion science for his contributions to modeling and analysis of dc-to-dc converts as well as for development of new magnetic structures for switching converts. For the invention of a new switching converter topology, now known as the CUkonverterTM,and several of its extensions, he won a coveted IRlOO Award for 1980 from Industrial Research Magazine. For the invention of integrated magnetics and for expediting the development of switched-mode power converters, he obtained the 1991 Edward Longstreth Medal from the Franklin Institute. His publications include numerous papers in the power electronics field and three books on switched-mode power conversion. He holds four patents related to the new switching power conversion concept. Several patents are also pending.