bad bank account event to the consortium, and the consor- ... ios are very similar with each other, representing a variant of ..... entire process by the developer.
Synthesizing statecharts from multiple interrelated scenarios Simona Vasilache and Jiro Tanaka Institute of Information Sciences and Electronics University of Tsukuba, Tennodai 1-1-1 Tsukuba, JAPAN {simona,jiro}@iplab.is.tsukuba.ac.jp
ABSTRACT In de£ning the behaviour of a system, requirement speci£cations make use of a number of scenarios that are interrelated in many ways. Current approaches, even though giving directions on how to translate them into statecharts, treat each scenario separately. In this paper we propose a method of synthesizing statecharts from multiple scenarios, with respect to the relationships among them. We describe a set of rules for the synthesis of statecharts from multiple scenarios, as a means to properly describe the requirements speci£cations of a system.
User
ATM
Consortium
Bank
Display main screen Insert card Request password Enter password Verify account Verify card with bank Bad account message
Bad account
Bad bank account
Print receipt Eject card Request take card Take card
Keywords scenarios, statecharts, OMT, event trace diagrams, multiple scenarios
Display main screen
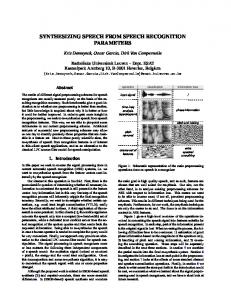
Figure 1: Scenario for an ATM OMT NOTATION AND AN EXAMPLE
INTRODUCTION Many popular object-oriented methodologies (OMT [13], UML [12]) make use of scenarios as a means of capturing requirements speci£cations, as well as a means of communication between users and software developers. Together with use cases, scenarios have gained considerable popularity during the recent years. A scenario is a sequence of events that occurs during one particular execution of a system [13]. Scenarios may represent a concrete sequence of interactions steps (instance scenario) or a set of possible interactions steps (type scenario) [14]. Jacobson introduced the term use case for type scenarios [8] and later introduced it into UML. In our paper we will refer only to instance scenarios. When it comes to the dynamic aspects of a system, state machines (particularly statecharts, originally introduced by D. Harel [5]) represent a compact way of describing these aspects. Statecharts are £nite state machines extended with hierarchy and orthogonality (parallelism), allowing the representation of a system in a compact and elegant manner. It is because of this feature that they have been preferred for representing scenarios. While scenarios represent a single trace of behaviour of a complete set of objects, state machines (which we are going to refer to as statecharts from now on) represent the complete behaviour of a single object. The two concepts together provide an orthogonal view of a system.
Scenarios are represented as sequence diagrams in UML [12] and as event trace diagrams in OMT [13]. Throughout our paper (and in the coming example) we are going to focus on the OMT notation. To illustrate our ideas, let us consider the example of an ATM (Automated Teller Machine). The ATMs are shared by a consortium of banks. Each ATM accepts a cash card, interacts with the user, communicates with the central system to carry out the transaction, dispenses cash and prints receipts. We describe typical scenarios for user interaction with an ATM machine, like inserting or removing a card, entering a password, deciding upon a certain type of transaction (withdrawal, deposit) and so on. Let us consider one possible scenario, described in the event trace diagram in Fig.1. The event trace diagram shows each object as a vertical line, and each event as a horizontal arrow from the sending to the receiving object. Four objects are involved in our scenario: user, ATM, consortium and bank. The events in our example are: displaying the main screen (from the ATM to the user), inserting a card (from the user to the ATM), requesting password (from the ATM to the user), entering password (from the user to the ATM), and so on. A state corresponds to the interval between two events received by an object. It re¤ects the response of an object to input events. This response may include an action or a change of state by the object. While events represent certain
points in time, states represent intervals of time. In this scenario, after the user enters the card and then the password, the ATM veri£es the card with the consortium, which, in turn, veri£es it with the bank. The bank sends a bad bank account event to the consortium, and the consortium sends a bad account event to the ATM. The ATM, in turn, sends a bad account message event to the user. In the end, a receipt is issued, the card is ejected and the user is requested to take the card back.
Display main screen Insert card Request password
Take card Request take card
Enter password Verify account
Eject card
Bad account Bad account msg.
Print receipt
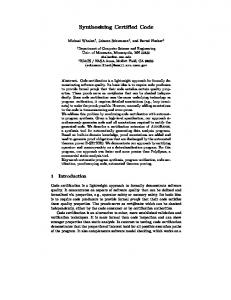
SYNTHESIZING STATECHARTS FROM SINGLE SCENARIOS Synthesizing statecharts from single scenarios represents the basis for the synthesis from multiple scenarios. In the following, we are going to describe concisely how to obtain statecharts from single scenarios. Statecharts are the ones that connect events and states. When an event is received, the next state depends on the current state as well as the event. A change of state caused by an event is called a transition. When a transition is triggered, the system leaves its current state, initiates the actions speci£ed for the transition and enters a new state. A statechart is a graph whose nodes are states and whose directed arcs are transitions (labeled by event names). One statechart describes the behaviour of a single class of objects. The sequence of events in an event trace diagram corresponds to paths through the statecharts of the corresponding objects [1]. In order to construct a statechart for a class of objects, we have to consider the vertical line that corresponds to the objects of that class. Based on [1], we can de£ne the basic rule for generating statecharts from single scenarios: Rule 1 For an object in an event trace diagram, incoming arrows represent events received by the object and they become transitions. Outgoing arrows are actions and they become actions of the transitions leading to the states. The intervals between events become states. Before receiving any event, the object is in the default state. Fig.2 illustrates the statechart corresponding to the ATM object in the scenario given as example in Fig.1. (Display main screen is considered to be the default state.) Insert card, Enter password, Bad account, Take card have become transitions, while Display main screen, Request password, Verify account, Bad account message, Print receipt, Eject card and Request take card are the actions that led to states with the same names respectively. SYNTHESIZING STATECHARTS FROM MULTIPLE SCENARIOS Step 1 The £rst step in synthesizing statecharts from multiple scenarios is creating a statechart from each single scenario. This is done according to Rule 1, presented in the previous section.
Figure 2: Statechart for the ATM class Multiple scenarios According to their de£nition, scenarios represent partial descriptions of system behaviour [13]. In order to describe a system, a number of scenarios is needed. Sometimes, one scenario follows other scenario, or is conditioned by another one. Many times the order and the timing of their execution are not arbitrary [14]. For example, if we consider the scenario depicting the action of withdrawing cash, this can be executed only in the situation of the user possessing a valid card and inputting the correct password. The scenario of the user applying for a card with a bank must precede the scenarios involving transactions with the bank in the user’s name. Therefore, we consider that in order to be able to understand and describe the whole system, we need to take into account not only the scenarios themselves, but also the interrelations between them. Two or more scenarios can be related in many ways: the execution of a scenario can depend on the execution time of another one (e.g. it can only be executed after/before another scenario), the necessary conditions for a scenario to be executed are described (and have to be ful£lled) in a different one, one scenario represents a part of another, a set of scenarios are very similar with each other, representing a variant of a basic scenario and so on. The relationships/dependencies between scenarios can be classi£ed as follows: • time dependencies; • cause-effect dependencies; • generalization dependencies. A time dependency signi£es the fact that one scenario has to be executed at an earlier/later moment in time than another scenario. Only after the scenario that has to be executed £rst has £nished its transitions, the second one can start its execution. It can also mean that two (or more) scenarios must be executed at the same time. For instance, as described above, a user must £rst prepare a card and only then (s)he can perform transactions through the ATM. Therefore, the scenario of creating a card precedes the scenario of withdrawing cash and the two scenarios are in a time dependency.
A cause-effect dependency re¤ects the fact that the execution of a scenario can take place only the moment certain conditions (established in another scenario) become valid. For example, an ATM can satisfy the user’s request for withdrawing cash only if it has been previously provided with a number of bills/coins. The scenario of withdrawing cash depends on the scenario of the ATM machine being ”loaded” with a suf£cient amount of cash (considered to cover the maximum amount that could be withdrawn during a whole day). The condition of ”being able to provide enough cash” is established in a different scenario from the one where the transaction itself takes place. A generalization dependency (or abstraction, as it is described in [6]) emerges when one scenario is a constituent part of another one or a variant of it. As a rough example, we can consider that the scenario of withdrawing cash is very similar to the scenario of depositing money. They can be generalized under one scenario, ”cash operations”, for example, where we have 2 variants with slight differences between them (in the case of deposit: the user selects ”deposit” and inserts the money in the special slot in the ATM; in the case of withdrawal: the user selects ”withdrawal” and the money is ejected through the same slot). We have seen in the previous section the basic rules for obtaining a statechart from a single event trace diagram. When dealing with multiple scenarios (thus with multiple event trace diagrams), a single statechart is obtained by combining all the statecharts created from different scenarios (event trace diagrams). In the following, we will de£ne the necessary steps and the rules for merging statecharts generated from scenarios related to each other.
User
ATM
Consortium
Bank
Display main screen Insert card Request password Enter password Verify account Verify card with bank Display options menu
OK account
OK bank account
Request withdraw Request amount Enter amount Display balance Eject cash Eject card Request take cash/card Take cash/card Display main screen
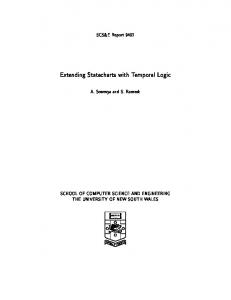
Figure 3: Scenario for withdrawing cash the 2 basic corresponding statecharts. The one corresponding to the scenario that has to be executed £rst will precede the one corresponding to the succeeding scenario. If the succeeding scenarios have common transitions to common states, they should not appear twice; this allows us to de£ne the next rule for merging scenarios:
Rule 2 If a transition is common to the 2 statecharts, it will be taken only once in the £nal statechart. If we consider two simple scenarios, one for changing the user password and one for withdrawing cash afterwards, they share the following states Time dependency between scenarios and events: requesting password, inserting password, con£rWhen we deal with time (as well as cause-effect) inter-dependent mation, as well as ejecting the card and requesting the user scenarios, the execution order of the scenarios de£nes, in to take the card. Therefore, they are going to be considered most cases, these dependencies. The execution order of a only once in the £nal statechart. number of scenarios falls into one of the following categories: Step 3 • succession; The next step in the synthesis of statecharts is the represen• disjunction; tation of the disjunction relationship between two scenarios. • conjunction; This can be achieved using OR type substates. • recurrence. Succession refers to the fact that one scenario follows another one. Disjunction indicates that at a certain moment in time either one or another scenario is executed. Conjunction shows that two (or more) scenarios are executed at the same time, while recurrence denotes that a scenario is executed iteratively a certain number of times. (J. Ryser and M. Glinz use in [14] the terms ”sequence”, ”alternative”, ”concurrency” and ”iteration”.) All these considered, we can advance to the next step in creating a statechart from multiple scenarios. Step 2 In a succession of 2 scenarios, the resulting statechart merges
Rule 3 Two scenarios related with a disjunction relationship should be combined with OR. For example, after the user introduces the card, then the password, and the account and password are con£rmed, several scenarios are possible (from the user’s point of view): withdrawing cash, depositing cash, transferring money into a different account etc. Let us consider the scenario of withdrawing cash, represented in Fig.3. The scenarios of depositing cash and transferring money into a different account are very similar to the sce-
Display main screen
Display main screen
Insert card [card properly inserted]
Insert card Take card Request take card
Request password
TRANSACTION Enter password
Request password Verify account
Eject card
OK account Display options menu
RECORDING Video camera ON
TRANSACTION Req. withdraw Req. amount Insert amount Display balance
Req. deposit Req. amount Insert amount/cash Display balance
Req. transfer Req. acc/amount Insert acc.no/amount Display balance
Eject cash Take cash
Figure 4: Statechart with OR type substates nario above. For space reason, we will not represent them here. The event ok account takes the system into the Display options menu state. According to the user’s choice, one of the states withdraw cash, deposit cash, transfer money will be reached next. The concept of cluster is involved [5]; we represent a single superstate as a rectangle, and inside it we £gure the corresponding states of the subscenarios. This way we obtain multilevel statecharts. We can cluster, therefore, the 3 states into a new superstate, named TRANSACTION. The semantics of the state TRANSACTION is the OR (actually, it is exclusive OR, that is XOR) of the 3 states mentioned above. The result is illustrated in Fig.4. The rectangle (which we purposely £gured with thick black lines) is the one that clusters the OR type substates. The 3 possible actions that lead to a transition are Request withdraw, Request deposit and Request transfer. The user can decide upon only one of them when the options menu is displayed; according to the user’s decision (the action), the corresponding transition takes place (Request withdraw, Request deposit or Request transfer). Step 4 Advancing to the next step, we will merge scenarios connected with a conjunction type dependency. The following rule applies in this situation: Rule 4 If two scenarios are executed at the same time, they must be
Figure 5: Statechart with AND type substates combined with AND type substates. This type of combining the states captures the property that, being in a state, the system must be in all of its substates. Concurrent states become active at the same time whenever the state they transited from (which is called superstate [1]) becomes active. The notation used in statecharts is the actual splitting of the rectangle representing the superstate into components using dashed lines. The two (or more, if that is the case) components represent the two concurrent scenarios. As an example, let us consider 2 scenarios: one of them depicts the user requesting a transaction and the other one, simultaneous to this one, shows the video camera (that is part of the ATM) recording the user’s actions. Previous to the execution of these scenarios, the card has been inserted by the user. The video camera starts recording as soon as the user inserts the card into the ATM machine. The superstate will be named ATM active. The 2 subscenarios are named TRANSACTION and RECORDING (but we will not detail them here.) Fig.5 illustrates the statechart including the two concurrent scenarios. When we deal with recurrence, that is with the repeating of a scenario a certain number of times, an arc pointing from the corresponding scenario’s terminal state to the initial state is used. The iteration is performed either an established number of times, or until a certain condition is ful£lled. This can be represented by specifying the condition on a label situated on top of the arrow depicting the transition. For example, if we consider the scenario describing the repetitive entering of an incorrect password by the user, we can either allow the user to try as many times as (s)he desires, or we can consider that the ATM will eject the card after 3 consecutive mistakes. In both cases, we represent the iteration by adding a transition from the Request password state to itself, like in Fig.6.
User
ATM
Display main screen
Request password
Insert card Request password Cancel
Figure 6: Representation of iteration
Eject card Request take card Take card Display main screen
Display main screen
Insert card User
Card properly inserted
ATM
Consortium
Display main screen Insert card Request password
Request password
Enter password Verify account Cancel
Verify account
Eject card Request take card Take card Display main screen
Figure 7: Statechart with direct representation of a condition Cause-effect dependencies between scenarios Sometimes, several scenarios can only be executed when certain conditions (established in other scenarios) are true. The conditions can be written as labels on top of the arrows showing the corresponding transition between the involved states, like in Fig.4. According to [6], the general syntax of an expression labeling a transition in a statechart can be de£ned as e[c]/a, where e is the event that triggers the transition, c is the condition that guards the transition from being taken unless it is true when e occurs, and a is an action that is carried out if and when the transition is taken. The condition that has to be true in our case: the user has inserted the card properly into the ATM machine. (This condition is tested in another scenario, not presented here, where the user, for instance, could insert the card upside-down.) We can also represent directly a condition, by showing the states corresponding to the conditioned scenario as being preceded by the states that correspond to the scenario that holds the condition. An example is given in Fig.7, which illustrates the fact that it is impossible to enter the Request password state unless Card properly inserted state has been already reached. Introducing hierarchy. Generalization dependencies between scenarios Step 5 The next step in the synthesis of the statechart is the re£nement. The concept of state hierarchy can be used to decrease the number of transitions in a statechart. In the case of 2 scenarios, where one is a variant of the other, or it represents
Figure 8: Scenarios for ATM a subscenario of another scenario, the dependency between them can be represented by generalization. When we want to synthesize subscenarios that are part of a certain scenario in statecharts, we use, as previously described, the concept of clustering. Since scenarios represent instances of a more general behaviour, it becomes useful to introduce generalizations into the generated statechart [16]. As an example, let us consider the two scenarios in Fig.8. We can see that the event Cancel can occur in one of 2 states: Request password and Verify account. It can be generalized, such that it can occur in any state in which the card is inserted. Cancel cannot occur in the situation of the card already ejected by the ATM. The corresponding statechart is shown in Fig.9. Hierarchy was, therefore, introduced, by partitioning the statechart over the 2 possible states in which the card can be: either inserted, or already ejected by the ATM. Other considerations The steps presented so far do not represent the strict order in which the synthesis of the statechart has to be performed. A strict order cannot be imposed, since the synthesis is different case by case. Sometimes, it is more convenient to consider £rst the conjunction dependency between statecharts and only afterwards the succession, for instance. The only exception is the £rst step, where statecharts for single scenarios are created. Also, it comes natural that the re£nement step is the last one that has to occur, after all the other aspects are covered. The steps (and rules) described here do not offer, unfortunately, a means of checking whether all the scenarios have been integrated and whether all the dependencies have been
2. Ali, J. and Tanaka, J. An object-oriented approach to generate executable code from the OMT-based dynamic model. Journal of Integrated Design and Process Science 2, 4 (1998), 65-77.
Display main screen Insert card Cancel
Request password
Eject card
Enter pass. Verify account
Request take card
Take card
3. Ali, J. and Tanaka, J. Implementing the dynamic behaviour represented as multiple state diagrams and activity diagrams. Journal of Computer Science and Information Management (JCSIM) 2, 1 (2001), 22-34. 4. Buhr, R. and Casselman, R. Use case maps for objectoriented systems. Prentice Hall (1996). 5. Harel, D. Statecharts: A visual formalism for complex systems. Science of Computer Programming 8, 3 (1987), 231-274.
Figure 9: Statechart with generalization
6. Harel, D. and Naamad, A. The STATEMATE semantics of statecharts. ACM Transactions on Software Engineering methods, 5:4 (1996), 293-333.
preserved in the process. A a manual veri£cation is almost always necessary in the £nal stage of the statecharts synthesis, but it can become time consuming if performed over the entire process by the developer. As part of our current work, a system that integrates all the rules and steps is in the early phases of development. In the future, the system could offer an automatic veri£cation of the preservation of all the states, transitions and dependencies inside and among different scenarios.
7. Harel, D. and Gery, E. Executable object modeling with statecharts. Computer 30, 7 (1997), 31-42.
RELATED WORK Ryser and Glinz introduced in [14] a new kind of chart (dependency chart) and a new notation to model the dependencies between scenarios. However, the charts only show the dependencies between various scenarios, without giving directions about the way they are translated into statecharts. SCED [9] is a tool for automatic generation of statecharts from single scenarios. In [16], an algorithm for generating UML statecharts from sequence diagrams is given, but the relationships between the sequence diagrams (as representations of scenarios) are limited to the introduction of hierarchy. CONCLUSIONS AND FUTURE WORK We have taken into consideration the synthesis of statecharts from multiple scenarios, connected with each other and depending on each other in different ways. We have de£ned a set of rules for synthesizing statecharts from all the existing scenarios in the requirements de£nition of a system. In the future, we intend to continue our work of implementing a system that integrates all these rules, allowing for the automatic generation of statecharts from multiple interrelated scenarios, as well as the automatic testing of the consistency between the scenarios and the statecharts. REFERENCES 1. Ali, J. and Tanaka, J. Constructing statecharts from event trace diagrams. Technical report of IEICE, KBSE98-33 (1998), 41-47.
8. Jacobson, I. Object-oriented software engineering: A use case driven approach. Addison Wesley, Reading, Massachusetts (1992). 9. Koskimies, K., Mannisto, T., Systa, T., Tuomi, J. Automatic support for dynamic modeling of object-oriented software. IEEE Software 15, 1 (1998), 87-94. 10. Makinen, E. and Systa, T. An interactive approach for synthesizing UML statechart diagrams from sequence diagrams. ACM Conference on Object-Oriented Programming Systems, Languages and Applications (OOPSLA2000), Minneapolis, USA (2000). 11. Noguchi, T. and Tanaka, J. Interactive layout method for object diagrams of OMT. In Proceedings of AsiaPaci£c Software Engineering Conference (APSEC’99), Takamatsu, Japan (1999), 110-117. 12. Rational Software Corporation. Uni£ed Modeling language (UML), http://www.rational.com. 13. Rumbaugh, J., Blaha, M., Premerlani, W., Eddy, F., Lorensen W. Object-oriented modeling and design. Prentice Hall (1991). 14. Ryser, J. and Glinz, M. Using dependency charts to improve scenario-based testing. 17th International Conference on Testing Computer Software (2000). 15. Vasilache, S. and Tanaka, J. Translating OMT state diagrams with concurrency into SDL diagrams. In Proceedings of the International Symposium for Future Software Technology (ISFST2000), Guiyang, China (2000), 2126. 16. Whittle, J. and Schumann, J. Generating statechart designs from scenarios. In Proceedings of International Conference on Software Engineering (ICSE2000), Limerick, Ireland (2000), 314-323.