SysML Parametric Diagrams in Business Applications Stanislaw Wrycza, Bartosz Marcinkowski Department of Business Informatics, University of Gdansk Piaskowa 9, Sopot, Poland
[email protected],
[email protected]
Abstract The Unified Modeling Language (UML) has been extensively used in the systems engineering domain. It has become a commonly accepted standard. However, not all expectations of system engineers have been met by UML. Therefore, a new language, based on UML but strongly supplemented by notions specific for the systems engineering field, has been proposed by the International Council on System Engineering (INCOSE) and Object Management Group (OMG). New types of diagrams specific for the technical spheres of systems engineering have been proposed and included in a standard set of 9 types of SysML diagrams. While they are successfully used in systems engineering, systems analysts have gone the opposite way – they have experimented with the appropriateness of SysML diagrams for applications in business and administration organizations. In this article, a case study of inventory control systems in industrial and commercial organizations, originating from business principles, theory of prognosis and operations research, is used to verify the usefulness of one of the leading and most characteristic SysML diagrams, i.e. the Parametric Diagram. Following the Introduction, the role of SysML in the development of inventory control systems is outlined. In Section 3, a Block Definition Diagram as a basis for parametric analysis is specified. Section 4 provides selected case study results. The paper is finalized with Conclusions.
1. Introduction The popularity of the Unified Modeling Language (Booch, Rumbaugh and Jacobson, 2004), (Dennis, Wixom and Tegarden, 2005), (Eriksson et al, 2004), (Wrycza, Marcinkowski and Wyrzykowski, 2005), which has become a kind of a standard in Object-Oriented Information Systems Modeling as well as Software Engineering (OMG UML, 2009), has inspired system engineers to elaborate and
2
implement a non-software-centric, domain language – i.e. the Systems Modeling Language (OMG SysML, 2008). SysML has become the subject of several publications, such as (Weilkiens, 2007), (Friedenthal, Moore and Steiner, 2008) or (Holt and Perry, 2008). SysML was designed to satisfy and support specific requirements of systems engineering. It was an adaptation and extensive modification (comp. Bock, 2006) of the official version of UML (2.x) into the semantics of a new, graphical, diagrammatic language having rich possibilities of expressing systems engineering requirements, which was the natural way of conduct (more INCOSE, 2007). Such profiling mechanism is one of the fundamental features of Unified Modeling Language, resulting in development of numerous domainspecific extensions (eg. Przybyłek, 2008), profiles or complete languages. SysML may be used to support problem solving for industries like space industry, automation, military, telecommunication, biotechnology, nanotechnology, power industry, chemistry, other technical industries, healthcare or business. Incorporating SysML into planned projects allows system engineers to create a natural link, combining different (often distant) disciplines into a holistic entity, regardless of hardware, personnel and other determinants. Language development has been coordinated by three well-known organizations: OMG (Object Management Group), INCOSE (International Council on System Engineering), ISO (International Organization for Standardization). As a result of the workgroups’ efforts, the Systems Modeling Language was developed and established. Formally, its specification was released in 2006 and then upgraded to version 1.1 in 2008. Although SysML concentrates on technical applications, it also attracts IT professionals involved in business applications and information systems modeling (Hause, 2009), (Wrycza and Marcinkowski, 2009). This research track is further continued in this paper. Following the Introduction, the role of SysML in the development of inventory control systems is outlined. In Section 3, a Block Definition Diagram as a basis for parametric analysis is specified. Section 4 provides selected case study results, being the application of Parametric Diagrams in regard of inventory control. The paper is finalized with conclusions.
2. SysML in the development of inventory control systems Inventory control systems have always been in the centre of Management Information Systems exploited in business and administration organizations. They are one of the most crucial modules of ERP (Enterprise Resource Planning) systems. Such systems require continuous improvement in respect of progress in management (JIT, Just in Time), forecasting and operations research upon which every inventory system is based. SysML provides conditions and opportunities for de-
3
velopment and strict formal specification of requirements, structure and dynamics of inventory control systems. The mathematical formulas composed may be expressed explicitly in accordance with SysML constraints. SysML supports information systems modeling by using the following nine diagrams:
Requirement Diagram; Use Case Diagram; Activity Diagram; Sequence Diagram; State Machine Diagram; Block Definition Diagram; Internal Block Diagram; Parametric Diagram; Package Diagram.
Most of the above listed diagrams are adequate for modeling inventory control systems. However, specific formal mathematical equations and formulas may be verbalized in accordance with the constructs and principles of Parametric Diagrams. SysML Parametric Diagrams enable clear and precise expression of mathematical formulas, used in forecasting and ordering in inventory control systems. Basic modeling categories used in modeling system parameters include: constraint blocks, constraint properties, constraint parameters, binding connectors as well as measures of effectiveness. Parametric Diagrams are often used to perform a tradeoff analysis, which enables a system modeler to specify and compare various variants of a target software or hardware solution.
3. Block Definition Diagrams as a basis for parametric analysis An inventory control system comprises the following main modules and procedures:
Materials/commodities evidence; Material sales forecasting/prognoses; Materials/commodities ordering; Accountancy.
The second and third of the above listed modules are of special research interest in this paper. Therefore, the following methods are included in the considerations: Exponential smoothing for forecasting; Optimal purchase order calculations for ordering module.
4
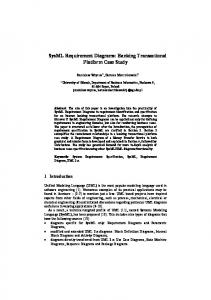
The results of sales forecasting for each material/commodity item are the input for the calculation of optimal purchase orders for those items. A Parametric Diagram does not initiate analysis and design discipline (IBM, 2009), instead it acts as one of the diagrams that finalize it, bridging specification and software implementation. The diagrams can be applied to specific software after creating at least Block Definition Diagrams. With respect to inventory control systems, a Block Definition Diagram, presenting the interrelationships and dependencies between respective components of inventory control systems, is shown in Fig. 1. «constraintBlock» Optimal Purchase Order constraints sp : Sale prognosis srp : Square root principle parameters Sº(t) : double S(t) : long : real Sº(t-1) : double Q : long A : Currency R : Currency J : Currency U : real
sp
srp
«constraintBlock» Sale prognosis
«constraintBlock» Square root principle
constraints
constraints
Sº(t) = S(t) + (1-)Sº(t-1) parameters Sº(t) : double S(t) : long : real Sº(t-1) : double
Q = sqrt((2 * A * Sº(t)) / (R + (J*U)) Sale progn. value
parameters Sº(t) : long Q : long A : Currency R : Currency J : Currency
Sale progn. value Optimal order quantity
U : real Unit cost of placing a purchase order
Actual sale
Exponential smoothing factor
Risk factor of stock running short
Unit cost of stock running short
Sale prognosis value in preceding period
Fig. 1. Specification of a constraint block with a Block Definition Diagram
Unit cost of maintaining stock
5
As a result of inventory control procedures, optimal order quantity should be calculated and an order placed by the system. The Optimal Purchase Order constraint block is composed of two subsequent constraint blocks: Sale prognosis and Square root principle. The latter two constraint blocks have mathematical constraints assigned as well as all the necessary parameters for calculating the formulas corresponding to the constraints enumerated in the parameters section. Mathematical constraints of the respective constraint blocks were defined as follows: Sale prognosis – Sº(t) = S(t) + (1-)Sº(t-1); Square root principle – Q = sqrt((2 * A * Sº(t)) / (R + (J*U)). Naturally, this type of calculations are accomplished first of all in respect of products of substantial significance to a company, taking into account revenue and profit. Therefore, it is a common practice to provide segmentation for such calculations. Only the products at the top of such segmentation are the subject of advanced forecasting and interconnected ordering formulas.
4. Parametric Diagrams – optimal purchase order case study On the basis of a Block Definition Diagram, Parametric Diagram(s) may be elaborated. Fig. 2 presents a Parametric Diagram based on the Block Definition Diagram illustrated in Fig. 1. The diagram shows the components of the Optimal Purchase Order constraint block, i.e.: sp (constraint property being an application of the Sale prognosis constraint block in the specific context); srp (application of the Square root principle constraint block). The result of sale prognosis calculation (Sº(t)) acts as one of the inputs of the square root principle. In order to calculate the sale prognosis value, the following constraint parameters are used: S(t) – actual sale; – exponential smoothing factor; Sº(t-1) – sale prognosis value in preceding period. Apart from sale prognosis calculation, the calculation of the optimal order quantity (Q) is feasible by using other input data:
U – risk factor of stock running short; J – unit cost of stock running short; R – unit cost of maintaining stock; A – unit cost of placing purchase order.
6
par [constraintBlock] Optimal Purchase Order
S(t) : long
S(t) : long
sp : Sale prognosis
: real
: real
Sº(t-1) : double
Sº(t-1) : double
Sº(t) : double
Sº(t) : double
A : Currency
A : Currency
S*(t) : double
srp : Square root principle R : Currency
R : Currency
J : Currency
J : Currency
U : real
Q : long
Q : long
{Q = sqrt((2 * A * Sº(t)) / (R + (J*U))}
U : real
Fig. 2. Parametric Diagram for optimal purchase order
In this way, specification of optimal order quantity is possible. The values discussed above may have its source in the current subsystem/module, other subsystems or other constraint properties (see Fig. 3). Therefore, the variables required for the calculation of optimal order quantity originate from: Sales subsystem: actual sale and unit cost of stock running short; Storage subsystem: unit cost of maintaining stock; Procurement subsystem: unit cost of placing a purchase order. The remaining variables are provided by other constraint properties, as shown in Fig. 3. Such developed diagram enables specifying a prepared set of input values and verifying the results achieved, thus comparing various variants of a target software or hardware solution. Such trade-off analysis enables system modeler to pick an optimal solution.
7
par [block] Procurement calculator [Optimal Purchase Order]
: Storage subsystem
: Sales subsystem
: Procurement subsystem
ucms : Currency
ucsrs : Currency
ucppo : Currency
sale : long rfsrs : Risk factor of stock running short
U
J
R
A
U
S(t) efc : Exponential flattening constant
smoothened prognosis : Optimal Purchase Order
S 0 (t-1)
sp(t-1) : Sale prognosis
Q
S 0 (t)
Fig. 3. Binding values for individual parameters
5. Conclusions SysML Parametric Diagrams have been applied in such industries as space industry, automation, military, telecommunication, biotechnology, nanotechnology, power industry, chemistry, other technical industries, healthcare or business. Their practical value in the above mentioned sectors is stimulated by the need to introduce advanced formulas, adequate for industry processes formalization. There is quite a number of cases in business and management, where advanced formulas are necessary. They are provided by experts from such domains as statistics, econometrics, operations research, theory of prognosis or financial analysis. The need for quantitative analysis creates great application fields for Parametric Diagrams. The adequacy for business systems development in respect of inventory control systems has been exemplified and confirmed in this paper. Acknowledgments Supporting agency: Polish Ministry of Science and Higher Education.
8 References Bock C. (2006) SysML and UML 2 Support for Activity Modeling; "Systems Engineering", vol. 9 Booch G., Rumbaugh J. and Jacobson I. (2004) The UML Reference Manual. 2nd Edition, Boston: Addison-Wesley Dennis A, Wixom B. H. and Tegarden D. (2005) Systems Analysis and Design with UML Version 2.0 – An Object Oriented Approach. 2nd Edition, New York: Wiley Eriksson H., Penker M., Lyons B. and Fado D. (2004) UML 2 Toolkit, New York: OMG Press Friedenthal S., Moore A. and Steiner R. (2008) A Practical Guide to SysML, Indianapolis: OMG Press Hause M. (2009) SysML hits the home straight, http://www.esemagazine.com/index.php?option=com_content&task=view&id=140&Itemid= 2, downloaded 05.08.2009 Holt J., Perry S., SysML for Systems Engineering, London: The Institution of Engineering and Technology International Business Machines Corporation (2009) IBM Rational Unified Process – hypertext knowledge base, downloaded 13.10.2009 Object Management Group (2008) OMG Systems Modeling Language (OMG SysML). Version 1.1. http://www.sysmlforum.com/docs/specs/OMGSysML-v1.1-08-11-01.pdf, downloaded 05.08.2009 Object Management Group (2009) OMG Unified Modeling Language (OMG UML), Superstructure. Version 2.2, http://www.omg.org/spec/UML/2.2/Superstructure/PDF/, downloaded 13.10.2009 Przybyłek A. (2008) “Separation of Crosscutting Concerns at the Design Level: an Extension to the UML Metamodel” in Proceedings of International Multiconference on Computer Science and Information Technology, Mrągowo: Polish Information Processing Society Press Technical Board International Council on Systems Engineering (2007) Systems Engineering Handbook. Version 3.1, http://www.incose.org/ProductsPubs/products/sehandbook.aspx, downloaded 05.08.2009 Weilkiens T. (2007) Systems Engineering with SysML/UML. Modeling, Analysis, Design, Indianapolis: OMG Press Wrycza S., Marcinkowski B. (2007) “A Light Version of UML 2: Survey and Outcomes Redistribution Permission” in Proceedings of the 2007 Computer Science and IT Education Conference, Mauritius: University of Technology Wrycza S., Marcinkowski B. (2009) “Systems requirement specifications with SysML” in Proceedings of BIR 2009. the Eight International Conference on Perspectives in Business Informatics Research; Kristianstad: Academic Press Wrycza S., Marcinkowski B. (2009) The Language of Systems Engineering – SysML. Architecture and Applications (in Polish), Gliwice: Helion Wrycza S., Marcinkowski B., Wyrzykowski K. (2005) UML 2.0 in information systems modeling (in Polish), Gliwice: Helion