T-61.5130 Machine Learning and Neural Networks : Implementation and Analyzation of Self Organising Maps on Food Data Set 245577 - Santosh Tirunagari /
[email protected] 31 January 2011
Abstract This project report gives the implementation and analysis of SOM over generated toy data and real world Food data. It also deals with the experiments conducted to cluster and visualize the Food data. SOM groped 9 nutrients of Food data into 5 food types and also made it visualize. This report also covers the sammon mapping and SOM projections over the Food data.
Contents 0.1 0.2 0.3 0.4 0.5 0.6 0.7 0.8
Introduction . . . . . . . . . . . . . Introduction to the SOM algorithm SOM algorithm on Generated Data SOM algorithm on Food Data . . . 0.4.1 U Matrix and Food types . Sammon mapping . . . . . . . . . conclusion . . . . . . . . . . . . . . References . . . . . . . . . . . . . . Appendix . . . . . . . . . . . . . . 0.8.1 food.m . . . . . . . . . . . . 0.8.2 basescript.m . . . . . . . .
1
. . . . . . . . . . .
. . . . . . . . . . .
. . . . . . . . . . .
. . . . . . . . . . .
. . . . . . . . . . .
. . . . . . . . . . .
. . . . . . . . . . .
. . . . . . . . . . .
. . . . . . . . . . .
. . . . . . . . . . .
. . . . . . . . . . .
. . . . . . . . . . .
. . . . . . . . . . .
. . . . . . . . . . .
. . . . . . . . . . .
. . . . . . . . . . .
. . . . . . . . . . .
4 4 5 7 7 8 9 10 10 10 11
List of Figures 1 2 3 4 5 6 7 8
Topological neighborhood examples, showing a monotonic decrease in the neighborhood. . . . . . . . . . . . . . . . . . . . . . 5 SOM after rough training phase . . . . . . . . . . . . . . . . . . . 6 SOM after fine training phase . . . . . . . . . . . . . . . . . . . . 6 SOM in grid view . . . . . . . . . . . . . . . . . . . . . . . . . . . 7 U-matrix and Component planes with both Variables of Toy data 7 Visualization of U matrix as divided in to 5 regions . . . . . . . . 8 Sammon Projection on the Data SOM . . . . . . . . . . . . . . . 9 SOM and data projection . . . . . . . . . . . . . . . . . . . . . . 10
2
List of Tables 1 2
Effects of errors on changing the parameters . . . . . . . . . . . . U Matrix and component planes Analyzation for the Food Data .
3
6 8
0.1
Introduction
The main motivation of the term project is to analyze the implementation of the self organising (SOM) algorithm over the real world dataset, here i have given with the Food dataset 1 . The pre requisites for doing this project require a basic knowledge of SOM algorithm , neural networks, basic mathematics and hands on matlab tool. This report discusses the introduction to SOM algorithm and its implementations on generated toy data as well as the real world Food data. The rest part of the report consists of the Introduction to the SOM algorithm in section 1, SOM algorithm on Generated Data in section 2, SOM algorithm on Food Data in section 3, U Matrix and Food types in section 4 and section 5 has conclusions.
0.2
Introduction to the SOM algorithm
SOM was invented by Prof.Teuvo Kohonen in ICS laboratory in early 1980’s, hence SOM is also known to be Kohonen maps, SOM provides a way of representing multidimensional data in much lower dimensional spaces usually in one or two dimensions. This process, of reducing the dimensionality of vectors, is essentially a data compression technique known as vector quantisation. SOM creates a network that stores information in such a way that any topological relationships within the training set are maintained. The input vectors are mapped nonlinearly onto the output layer, the absence of hidden layers, the input vectors are nonlinearly and directly mapped to the output layers. SOM is unsupervised, competative learning approach in which only one neuron wins each training phase. There are no connections between the neurons in output layer. However, they communicate with eachother via a neighbourhood function. If a neuron wins in training phase, it will also impact its neighbours. Let us consider the input vector x = [x1 , x2 , ..., xn ]T
(1)
The synaptic weight vector of the neuron i in the output layer of 2-dimensional neuron is wi = [wi 1, wi 2, ..., wi n]T , i = 1, 2..........m; (2) m is the number of output neurons. Although the output neurons are arranged in 2-dimension array, their weight vectors are n-dimensional i.e. same dimension as the input vector x. Now the Euclidean distances ||x − wi||2
(3)
of the current input vector x to all the weight vector i = 1, 2...m is computed. Now the winning neuron is one whose weight vector wq has the minimum Euclidean distance to x i.e. q(x) = argmini ||x − wi||2 1 http://www.nal.usda.gov/fnic/foodcomp/Data/
4
(4)
Now the weight vectors of the winning neurons and the neurons in its predefined neighbourhood Nq are updated using the rule wi (k + 1) = wi (k) + ηqi (k)[x(k) − wi (k)]
(5)
Neurons outside the neighbourhood are not updated i.e Nq(k)=0. Neighbourhood neurons Nq of winning neuron q is updated using the formule ηqi (k) = µ(k)
(6)
The learning parameter µ(k), where 0 < µ(k) < 1 decreases with increasing iteration . The training learning process has two phases ordering phase(rough training phase) and convergence phase(fine training phase). In ordering phase, the topological ordering of the weight vectors is carried out. The learning parameter µ(k)should be set close to unity. In convergence phase, the self-organizing map is fine tuned. The learning parameter is fine tuned using the learning parameters,µ(k), value in the order of 0.01.
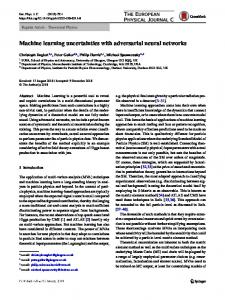
Figure 1: Topological neighborhood examples, showing a monotonic decrease in the neighborhood. The stoping criterion for the SOM algorithm is the number of specified iterations or the smallest degree of change in the weight vectors. The training can be carrid out for different values for size of the map, the radius of neigbourhood etc.
0.3
SOM algorithm on Generated Data
The toy data given in the basescrit.m file is modified with the parameters and different quantisation errors of rough and fine trainng phase have been analyzed in the Table 1. The radius of the neighbourhood parameter(FinetuneFin and RoughFin) defines how the radius of the neighbourhood will be effected in each iteration. As seen from the algorithm initially there is a big radius kstep and radius 5
Som Width 20 20 25 25 25
Rough Fin 10 5 3 2 1.5
FineTune Fin 2 1 0.5 0.1 0.07
Q-E-R 0.4 0.25 0.1 0.1 0.1
Q-E-F 0.1 0.05 0.02 0.02 0.015
Table 1: Effects of errors on changing the parameters decreases with each iteration (k + 1, k + 2................k + n) steps. Changing the radius of the neighbourhood impacts on the speed of convergence of the algorithm. If very small values are given for these radius, overlearning becomes a problem. So, there is always a tradeoff to consider. In Figure 2 and 3 shows after rough training phase, fine training phase.
Figure 2: SOM after rough training phase
Figure 3: SOM after fine training phase In Figure 2,3 ’+’ represents data and ‘o’ represents the SOM. It is analysed that the rough training would give the basic structure to SOM and the fine training phase refines the structure of the SOM. Figure 4,5 visualizes the SOM U-Matrix with the components and SOM in grid when SOM width = 25, RoughFin = 2 and FinetuneFin = 0.1. 6
Figure 4: SOM in grid view
Figure 5: U-matrix and Component planes with both Variables of Toy data In the later section SOM is applied and analysed the working on the real world Food data set.
0.4
SOM algorithm on Food Data
The real world data is food data which consists of the values for food items, which are described in terms of household measures for the food and are provided for the weight of the household measure. There are 961 instances of 9 attributes (nutritive values). The objective is to find the dependencies among the data, cluster the data and analyze the result using SOM. SOM is used to cluster the data as well as to visualize the data. Here SOM is applied on Food data and clustered, the clustering gives us the information that there are five varieties of food from nine nutrion items of the data set.
0.4.1
U Matrix and Food types
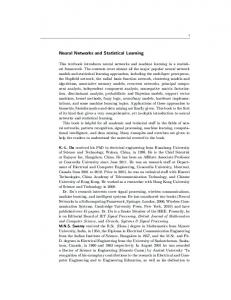
From the Figure 6, we can analyse the U matrix as divided in to 5 regions which gives 5 varieties of food from 9 nutrion attributes of the Food dataset. Final quantization error is 0.601 and Final topographic error is 0.049.
7
Figure 6: Visualization of U matrix as divided in to 5 regions Region Matrix Region Region Region
in U
Location
Primary Ingrediants
1 2 3
Top-Left Top-Middle Top-Right
Water, Ascorbic Acid Water, Protein Water
Region 4
Bottom-Left
Protein, Fat
Region 5
BottomRight
Energy, Vitamins A(iu,re), Carbohydrate, Cholesterol, Protein
Subsidary Ingrediants Others Others Ascorbic acid, Water Carbohydrate, Energy Ascorbic acid
Table 2: U Matrix and component planes Analyzation for the Food Data
0.5
Sammon mapping
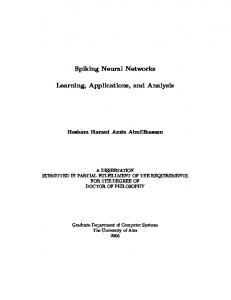
Sammon’s projection or mapping method was proposed by John W. Sammon in 1969. It is a visualization algorithm that maps the high dimensional data to a lower dimension. The mapping is carried out in such a way that the distance between the object distances from the original space are preserved in the projected space. The reduction in dimensionality by sammon mapping enables us to view the data in 3-dimesions or even in two dimensions. In Figure 6 it is visualized that the neurons are concerntrated at the palce where the data is concentrated. The colours in the Figure 7 are of 5 types and this would be analyzed as the 5 regions of the U matrix implemented by SOM. The 5 colours in the sammon mapping gives the visualization of 5 types of food, in the dataset. But when we apply SOM. The Figure 8 shows that SOM is sensitive to outliers. There are many outliers which SOM not considered. If SOM considers outliers then overfitting may be occured. Those data points can be intrepreted as outliers and are thus neglected.
8
Figure 7: Sammon Projection on the Data SOM
0.6
conclusion
Implementation of SOM is easy and simple when one understands the theory behind SOM. SOM clusters the data and also makes visualization of the high diensional data in 2 or 3 dimensions. It also reveals how good is the map and how strong are the similarities between the attributes. It is a very good tool for the data analysis for instance the U matrix of the Food data set gave us result visualizing 5 types of food with 9 nutrients. The high dimensions of the data with the SOM can be visualized in 2 or 3 dimensions using sammon mapping. But one has to consider that when the dimensions of the data are reduced the information will be lost, and also it is very difficult to visulaize a high dimension data. There are many other dimensionality reduction methods like Principal Component Analysis, Independent Component Analysis, Linear Discriminant Analysis and Singular value decomposition. Even these methods cam be applied and visualize. The merit of SOM is that it preserves the topological information. ICS lab at our school recently introduced NeRV which is a power tool for dimensioanlity reduction and visulaization. It is said to be Neighbourhood Retreival and Visulaization. It maintains the neighbourhood, Hence it is good for 2D and 3D visualization. As iam interested in cross language information retrieval, I started to read articles about the websom. I would use SOM for data analysis and compare it with other methods. 9
Figure 8: SOM and data projection
0.7
References
1. Lecture Slides: https://noppa.tkk.fi/noppa/kurssi/t-61.5130/luennot 2. SOM toolbox: http://www.cis.hut.fi/projects/somtoolbox/download 3. Sammon mapping: http://www.cis.hut.fi/ jhollmen/dippa/node25.html 4. Sammon mapping : http://en.wikipedia.org/wiki/Sammonprojection 5. SOM : http://en.wikipedia.org/wiki/Self-organizingmap 6. Fredric M. Ham and Ivica Kostanic, Principles of Neurocomputing for Science and Engineering. 7. Matlab: http://www.mathworks.com/products/matlab/
0.8 0.8.1
Appendix food.m
load food.mat %Normalize data and train the SOM sDataN = som normalize(sD,’var’); sMapN= som make(sDataN); figure(1) %visulize the results som show(sMapN, ’norm’, ’d’); figure(2) %SOM as a grid to visualize map S=som grid(sMapN, ’Coord’, sMapN.codebook(:,[1 2])); samidta = sammon(sDataN,3); %sammon’s projection samimp = sammon(sMapN.codebook,3); figure(3) plot3(samidta(:,1),samidta(:,2),samidta(:,3),’k.’); hold on; colors = (0:1/(size(samimp,1)-1):1)’; som grid(sMapN.topol, ’Coord’, samimp, ’surf’, colors) % projection figure(4) som show(sMapN, ’umat’,’all’) %show the UMatrix figure(5)%visualize the all nine components som show(sMapN,’comp’,[1:9])
10
0.8.2
basescript.m
SOMwidth = 25; % init = 12...width of SOM RoughFin = 2; % init = 2...rough phase neighbourhood radius FinetuneFin = 0.1; % init = 1..fine phase neighbour radius %% Create a batch of test data data = [randn(300,1)+0,randn(300,1)+0;... randn(300,1)+10,randn(300,1)+0;... randn(300,1)+0,randn(300,1)+10;]; % scale the data sData = som data struct(data); sDataN = som normalize(sData, ’var’); %% train the SOM sMapN = som map struct(size(data,2), ’msize’, [SOMwidth, SOMwidth]); sMapN = som randinit(sDataN, sMapN); % run the rough training phase figure(1) sTrainN = som train struct(sMapN,’phase’,’rough’); sMapN = som batchtrain(sMapN,sDataN,sTrainN,’radius fin’, RoughFin, ...’tracking’,3); % run the fine tuning phase figure(2) sTrainN = som train struct(sMapN,’phase’,’finetune’); sMapN = som batchtrain(sMapN,sDataN,sTrainN,’radius fin’, FinetuneFin, ...’tracking’,3); % The training could be done in one step using som make. % The som make determines the training parameters automatically % from data. % sMapN = som make(sDataN); %% Visualization figure(3) som show(sMapN, ’norm’, ’d’); figure(4) S=som grid(sMapN, ’coord’, sMapN.codebook(:,:)); %show the SOM grid only figure(5) som show(sMapN,’umat’,’all’) %visuaalize U matrix only
11