A Neural Network learning Relative Distances Alfred Ultsch, Dept. of Computer Science, University of Marburg, Germany.
[email protected] Data Mining and Knowledge Discovery aim at the detection of new knowledge in data sets produced by some data generating process. There are (at least) two important problems associated with such data sets: missing values and unknown distributions. This is in particular a problem for clustering algorithms, be it statistical or neuronal. For such purposes a distance metric comparing high dimensional vectors is necessary for all data points. Much handwork is necessary in today’s Data Mining systems to find an appropriate metric. In this work a novel neural network, called ud-net is defined. Ud-nets are able to adapt to unknown distributions of data. The output of the networks may be interpreted as a distance metric. This metric is also defined for data with missing values in some components and the resulting value is comparable to complete data sets. Experiments with known distributions that were distorted by nonlinear transformations show that ud-net produce values on the transformed data that are very comparable to distance measures on the untransformed distributions. Ud-nets are also tested with a data set from an stock picking application. For this example the results of the networks are very similar to results obtained by the application of hand tuned nonlinear transformations to the data set.
1 Introduction In many applications, in particular in data mining, we are confronted with high dimensional data sets of unknown distributions in their variables[Fayyad et al 94]. The distributions of the variables are often highly non-normal, i. e., for example, skewed due to an exponential growth in the measured variable. For many applications distances of the multidimensional data vectors need to be compared. In particular this needs to be solved in the context of Knowledge Discovery in Databases (KDD) [Fayyad et al 94]. Euclidean Distances are not suitable in this case since the non-linear nature of the distributions distorts heavily the distance metrics. I. e. too large or too small distances are measured. If a variable stems from a process which involves exponential growth there will be many small values. Conversely there will be few very big values. If differences between values are calculated and summed over all components the few large values will dominate all other differences. The application of non-linear transformations to a data component is one standard method in order to transform the problematic variables to a feasible distribution. The selection of a suitable transformation is an expert task [Hartung/ Elpelt 95]. This task consumes typically most of the time necessary to process the data set. It is estimated that 80 to 90 % of the whole time of a Data Mining task with respect to working-time is spent in this so called pre-processing of the data [Mannila 97]. If a distance metric could be found, that takes the non-normal distributions of the variables into account, much of the work, that needs to be done in Data Mining by experts, can be left to a computer. Due to the very different shapes of observed distributions it is, however, very hard to define such a metric a priori for all practical situations. In this paper we follow the approach to define an artificial neural network, called uniform distance net (ud-net), that adapts itself to the distributions of the variables. The network learns a distance measurement we call Relative Distance. This Relative Distance seems to be reasonably robust against „distortions“ in the data like the application of functions such as x^2, ln, sqrt, exp, etc. This paper gives the definition of this network and shows the results of the application of ud-nets to an artificially constructed example and a real world data set. The rest of the paper is organized as follows: in chapter two ud-nets are defined, starting from simple ud-neurons that can be used to compare two real numbers up to ud-networks for the learning of Relative Distances in high dimensional vector spaces. Chapter three presents an application of ud-nets to a data set with known properties. It sets Relative Distances measured by ud-nets in relation to Euclidean Distances. Chapter 4 presents the application of a ud-net to data set from an application. For this data set, stemming form the domain of stock picking, non-linear transformations are absolutely necessary. The Relative Distances calculated by a ud-net are compared to Euclidean Distances on the transformed data set. In chapter 5 the results of the two previous chapters are discussed and chapter 6 gives the conclusions.
2 Uniform Distance Networks In this section an artificial neural network called ud-net is defined. We will first define a ud-neuron for the calculation of a measurement of relative nearness of two numbers. A ud-neuron takes two real numbers x and w as
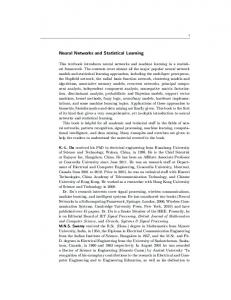
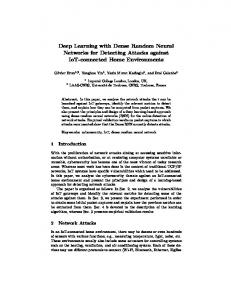
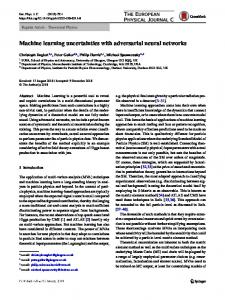
input and calculates from these a number in the unit interval ([0,1]). The output of the neuron is interpretable as follows: an output value close to 0 means x is far away from w; an output value close to 1 means x is relatively close to w. Figure 1 shows the construction of an ud-neuron. Input to the Neuron is x and w ∈ R and a system clock pulse with values q ∈ {0,1}. A transition of q from 0 to 1 indicates the advent of a new and valid input in w and x. While q =1 the relative nearness is calculated. The main functionality of the neuron is given by the difference function d and the sigmoid function th. These functions are defined as follows: • Difference function d : d = d(x,w) =(x-w)^2. The output may be any positive number in R. • Sigmoid function th: rn = th(d,m,s) = exp(-(d/(m+s))^2). The values of m and s are adjusted during the learning of the neuron (see below). The purpose of the sigmoid function is to map all outputs onto the unit interval. The function t counts the changes of q from zero to one and may be interpreted as a time index. The value dm is the difference between the current and the last value of m: dm = m - ml.
For ud-neurons the learning rules update in particular the values of m and s. For m learning is as follows: m0 = w(1); m = ml + dm with dm = 1/t (x-ml), where ml is the last m value. For s the learning rule is as follows s0 = 0; s = sqrt( sl2+1/t dm2 - 1/(t-1) sl2), where sl is the last value of s. For the usage in more complicated networks, the diagram of Figure 1may be simplified to Figure 2 may be further reduced, see Figure 3 Figure 1: Circuit diagram of a ud-neuron
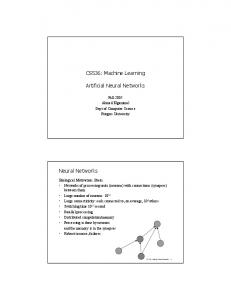
Fig. 2: Block diagrams of a ud-neuron
Fig 3: Simplified block diagram
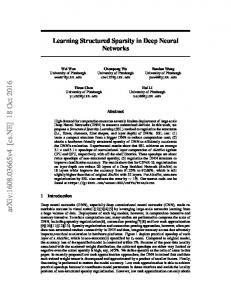
Figure 4 ud- neuron for Relative Distances
Fig 5: Summing Relative Distances.
.
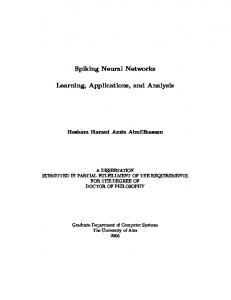
For the calculation of a relative distance between x and w, the output value of a ud-neuron may be "inverted". In this case after the sigmoid function an inverter I is build into the ud-neuron. I, has the function rd = 1- rn. See Figure 4. Simplified circuit diagrams for Relative Distances are in analogy to relative nearness. In many applications not only scalar values x and w need to be compared but also vectors X and W of dimension n. Since the relative distances measured in each component of the vectors are all in the same unit interval, the sum of
all rd of all components (srd) is a possible measure of relative distance in higher dimensions. The function Σ also applies a sqrt operation to the sum of all rd valuesIn the above definition the maximum of relative distances in one component is at most 1.0. A value of d as relative distance between X and W means, roughly spoken, that X and W are different in about d aspects (dimensions). If the sum of all rd of all components (srd) is divided by the dimensionality of each vector pair x, w the resulting value may be compared to srd of other vector pairs with different dimensions. This allows, for example, to measure valid and comparable distances even in the case that some of the components of a vector are missing.
3 Ud-nets measuring Distances in Data with different Distributions The design of ud-networks is aiming at neural networks for the comparison of high dimensional vectors that are able to compensate different distributions in the components.To analyze ud-nets in the case of skewed distributions, a data set E, consisting of 300 three-dimensional data vectors, was generated. In each variable the values were generated by a random generator producing numbers with an equal distribution. Euclidean Distances between all pairs of vectors in E are normally distributed and so are all Relative Distances. As a first experiment a logarithmic function was applied to the variable y (lny = ln(y)) and an exponential transformation to z (expz = exp(z)). This transformed data set is called T1 The distribution of Euclidean Distances is shifted from normal in the untransformed E to a skewed distribution. Comparing the Euclidean Distances measured after transformation T1 to the original distances gives the following picture.
Figure 6: Euclidean Distances measured after transformation T1 vs the original Euclidean Distances
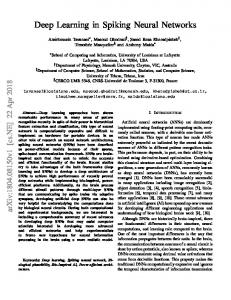
Pearson’s correlation coefficient for the correlation between Euclidean Distances in E and in T1 gives 0.66. The detailed relationship between Euclidean Distances in the original set E and Relative Distances in the transformed set T1 shows picture 7.
Figure 7: Euclidean Distances on T1 vs. Relative Distances on the untransformed set
Pearson’s correlation coefficient for the correlation between Euclidean Distances in E and Relative Distances in T1 is in this case 0.81.If the data set T is transformed as follows T2 = (x, ln(y), ln(z) ). The same phenomena can be observed: the correlation between Euclidean Distances in E and Euclidean Distances in T2 is relatively small (0.59), while the correlation between Euclidean Distances in E and Relative Distances in T2 remains high (0.71). In this case the "gain" in correlation percentages is 22 %. Similar results could be obtained by other combinations of ln, sqrt, squaring and exponentiation as transformations.
4 Ud-nets in a Practical Example In this section we describe experiments done with a data set stemming from a financial problem domain: stock market analysis [Deboeck/Ultsch 99]. The data set used consists of 331 real valued vectors describing values of stocks traded at US-American electronic stock exchanges. The data for each stock consists of 19 values. Quantile/quantile (Q/Q) plots of the variables exhibited that except for the first variable (Held) all distributions are rather skewed. With the help of quantile/quantile plots reasonable assumptions for the non-linear transformation necessary in order to compare the data could be made.
Figure 9: Q/Q plots of the transformed variable Figure 8: Q/Q plots of the untransformed distributions Transformations like square root and logarithmic transformations were hand selected and applied to the data.The effect of the transformations can also be seen in the distributions of the distance values. While Euclidean Distance in the original data set is non uniformly distributed the distribution of Relative Distances is close to normal. [Ultsch99b].Euclidean Distance is sensitive to the non-linear transformations applied. This can be estimated by the Pearson’s correlation factor of 0.67 between the Euclidean Distances in original vs. transformed data.
Figure 10: Euclidean Distance of transformed data vs. Euclidean Distance of untransformed data
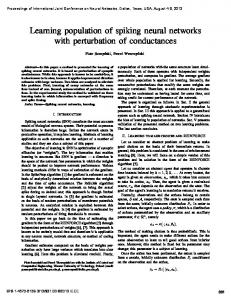
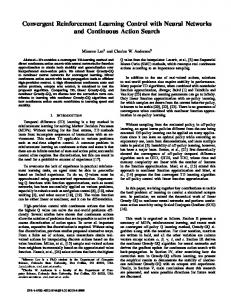
Figure 10 gives the relation of Euclidean Distance of the transformed data vs. Euclidean Distance of untransformed data. It can be seen that the correlation is very weak for larger distances. The most important observation is how udnet distances of untransformed data sets correlate to Euclidean Distances of the transformed data. Figure 11 plots these distances against each other. It can be seen that there is a rather strong correlation which is also visible in a Pearson correlation factor of 0.79. Note also that the "smoke stack cloud" of figure 11 gets smaller near the origin. This indicates that for small distances correlation is even more directly.
Figure 11: Euclidean Distance of transformed data vs. Relative Distance of untransformed data
5 Discussion As test bed for the claimed robustness of the distances measured by ud-nets first an artificially generated example of 300 points equally distributed in the three dimensional unit cube we used. If non-linear transformations like ln, exp, etc. are applied to the data set, Euclidean Distances between any number of points are heavily affected. A Pearson correlation between the original distances and the Euclidean Distances in the transformed data is in the range of 0.6. If distances are learned by a ud-net the correlation between the Euclidean Distances in the untransformed set and Relative Distances in the transformed data remains relatively high, i. e. in the 0.8 range. Comparing the plots of the original distances vs. Relative Distances it can be seen that for small distances the correlation remains even higher. Ud-nets have been applied to a dataset from an application in the domain of stock marketing. The data set consisted of high dimensional real vectors. Except one, all of the variables showed non-normal distributions. For each of these variables non-linear transformations like sqrt and ln had been hand selected, such that the transformed variables were sufficiently close to a normal distribution. It can be safely assumed that these transformations need to be applied before any further processing can be done, that needs any kind of distance measure between the data points. In this case using Euclidean Distances as distance metric in the untransformed data set is very problematical. The Euclidean Distances of transformed vs. untransformed data points decorrelate more and more as the distances increase. Relative Distances on the untransformed data set measured with ud-nets show a high correlation to the Euclidean Distances measured in the transformed data set (consider also Figure 11). This is a strong indication that trained ud-nets are able to measure distances in a high dimensional vector space that are close to the "real" distances of the vectors, even if the distribution in the are rather skewed. This property allows to use ud-nets on original, untransformed data sets. The time consuming hand adaptation of a transformation to each component in order to make the distributions comparable may be substituted by the mechanical training process of a ud-net. Furthermore, ud-nets have the property that vector pairs of different dimensionality may be used to calculate comparable distance values. This allows that data points with missing values may be compared to others that are more or totally complete.
6 Conclusion In particular in the context of Knowledge Discovery in Databases (KDD) a problem arises when it’s necessary to compare high dimensional data points of unknown distributions in their variables[Fayyad et al 94]. Euclidean
Distances are misleading if these distributions are highly non-normal. This problem is typically overcome by a statistical expert who hand-selects and adapts a non-linear transformation like ln, exp, etc. to each of the variables[Hartung/Elpelt 95]. Due to the very different distributions observed in practice an analytical definition of a distance-metric that is suitable for all situations seems to be impractical. In this work an adaptive neural network, called ud-net, is proposed that adapts itself to the distribution of each variable. After its learning phase a ud-network produces an output that can be interpreted as a special distance metric called Relative Distance. Using an artificially generated example with known properties we could demonstrate that this learned distance is reasonably robust against standard types of non-linear transformations. These transformations are mostly applied in the practice of Data Mining[Mannila 97]. As practice shows, missing values are present in almost all data sets from real applications[Little / Rubin 87]. Clustering algorithms, be it statistical, like k-means [Hartung/Elpelt 95], or neuronal, like U-Matrix methods [Ultsch 99], rely on a valid and comparable distance metric for all data including those with missing values. Ud-nets may be used in these algorithms to produce valid results for such incomplete data sets. Ud-nets can be integrated in classification processes, like clustering algorithms (k-means, single-linkage, WARD, etc.) [Hartung/Elpelt 95], and neural network clustering, like Emergent Neural Networks [Ultsch 99]. Feature experiments with these classifications will show whether the Relative Distance, defined by ud-nets, are a good alternative to spending a lot of men-hours in hand-selecting appropriate transformations.
Acknowledgment The author whishes to thank Guido Deboeck, author of "Visual Explorations in Finance using self-organizing maps" [Deboeck 98] and "Trading on the Edge" [Deboeck 94] for the provision of the financial data set.
7 References [Deboeck 94]
Deboeck G., Trading on the Edge: Neural, Genetic and Fuzzy Systems for Chaotic Financial Markets, John Wiley and Sons, New York, April 1994,377 pp.
[Deboeck 98]
Deboeck G., Kohonen T., Visual Explorations in Finance with self-organizing maps, Springer-Verlag, 1998, 250 pp.
[Deboeck 99]
Deboeck G. Value Maps: Finding Value in Markets that are expensive, Kohonen Maps, E. Oja, S. Kaski (editors), Elsevier Amsterdam, 1999, pp 15-31.
[Deboeck/Ultsch 00]
Deboeck G., Ultsch, A.: Picking Stocks with Emergent Self-organizing Value Maps, to appear.in Proceedings of IFCS, Namur, Belgium Juli 2000
[Fayyad et al 94]
Fayyad, U. S., & Uthurusamy, R. (Eds.). Knowledge Discovery in Databases; Papers from the 1994 AAAI Workshop. Menlo Park, CA: AAAI Press. (1994)
[Hartung/Elpelt 95]
Hartung, J., Elpelt, B.: Multivariate Statistik, Oldenbourg Wien, 1995
[Kohonen 97]
Kohonen T., Self-Organizing Map, SpringerVerlag. 2nd edition, 1997
[Little / Rubin 87]
Little, R.J.A., Rubin, D.B. (1987): Statistical Analysis with Missing Data, Wiley, New York, 1987.
[Mannila 97]
Mannila, H.: Methods and Problems in Data Mining, In: Afrati, F., Kolatis, P. (Eds), Proc. ICDT, Delphi, Greece,Springer,1997
[StatSoft 99]
StatSoft, Inc.:Electronic Statistics Textbook. Tulsa, WEB:http://www.statsoft.com/textbook/stathome.html.
[Ultsch 98]
Ultsch, A. The Integration of Connectionist Models with Knowledge-based Systems: Hybrid Systems in Proceedings of the IEEE SMC 98 International Conference 11 - 14 Oktober 1998 Sant Diego pp 1530 -1535
[Ultsch 99a]
Ultsch A. Data Mining and Knowledge Discovery with Emergent Self-Organzing Feature Maps for Multivariate Time Series , in Kohonen Maps, E Oja & S. Kaski (editors) Elsevier. Amsterdam, 1999, pp 33-45.
[Ultsch 99b]
Ultsch A.: Neural Networks for Skewed Distributions, Technical Report 12/99, Department of Mathematics and Computer Science, University of Marburg
OK,
USA:
1999,