TCAD development for lithography resolution enhancement
by L. W. Liebmann S. M. Mansfield A. K. Wong M. A. Lavin W. C. Leipold T. G. Dunham
Advances in lithography have contributed significantly to the advancement of the integrated circuit technology. While nonoptical next-generation lithography (NGL) solutions are being developed, optical lithography continues to be the workhorse for high-throughput very-large-scale integrated (VLSI) lithography. Extending optical lithography to the resolution levels necessary to support today’s aggressive product road maps increasingly requires the use of resolution-enhancement techniques. This paper presents an overview of several resolution-enhancement techniques being developed and implemented in IBM for its leading-edge CMOS logic and memory products.
Such resolution-enhancement techniques (RETs) have become increasingly important as resolution has increased beyond the quarter-micron level. Combined with the use of off-axis illumination and advanced resist processing, they promise to advance optical lithography ever closer to the elusive Rayleigh resolution limit of k 1 ⫽ 0.25. Improving lithography resolution by using RETs to approach the ultimate physical resolving power of a given lithography toolset is often cheaper and timelier than installing a higher-resolution toolset, but it still is costly. In addition to increased reticle cost and rising process complexity, significant resources must be dedicated to the development and implementation of technology-computeraided design (TCAD) solutions to manage the escalating complexity of RET-related chip layout modifications. After a brief discourse on lithography resolution and resolution enhancement, intended for the benefit of the nonlithographer, this paper discusses the theory pertaining to the use of OPC, SRAF, and PSM, and the TCAD challenges they present as they are being deployed in the IBM Microelectronics Division for 180-nm to 100-nm technology design rules.
Introduction The use of optical proximity correction (OPC), subresolution-assist-feature-enhanced lithography (hereafter referred to simply as SRAF), and phase-shiftedmask-enhanced lithography (hereafter referred to simply as PSM), have recently made the transition from exploratory possibilities to viable lithography options.
Resolution enhancement In the simplified approximation of coherent illumination, the resolution R of a lithography system is conventionally
娀Copyright 2001 by International Business Machines Corporation. Copying in printed form for private use is permitted without payment of royalty provided that (1) each reproduction is done without alteration and (2) the Journal reference and IBM copyright notice are included on the first page. The title and abstract, but no other portions, of this paper may be copied or distributed royalty free without further permission by computer-based and other information-service systems. Permission to republish any other portion of this paper must be obtained from the Editor. 0018-8646/01/$5.00 © 2001 IBM
IBM J. RES. & DEV.
VOL. 45 NO. 5 SEPTEMBER 2001
L. W. LIEBMANN ET AL.
651
1 0.9
Conventional lithography
k1
0.8 0.7 0.6
Mild RET
0.5 Strong RET
0.4 0.3 1980
1985
1990
1995
2000 Year
2005
2010
2015
2020
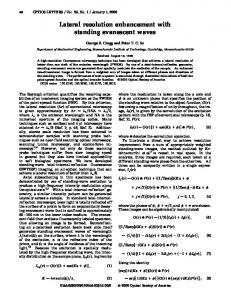
Figure 1 Trend of k1 values in IBM semiconductor manufacturing lithography for several generations of exposure wavelength and numerical aperture. Values of k1 larger than 0.65 are typically regarded as conventional lithography; values between 0.65 and 0.5 require more lithography effort and mild resolution-enhancement techniques; values from 0.5 approaching 0.25 present formidable lithography challenges and will require the use of elaborate resolutionenhancement techniques. The ultimate resolution limit for singleexposure optical lithography occurs at k1 5 0.25.
quoted in terms of the smallest half-pitch of a grating that is resolvable as a function of wavelength and numerical aperture NA, as expressed by Rayleigh’s equation, R ⫽ k1
652
NA
,
where k 1 is the Rayleigh constant. For conventional optical lithography, the ultimate resolution limit is reached at k 1 ⫽ 0.5, the state at which only one set of diffracted orders can pass through the imaging optical system. Even as exposure wavelengths decrease from 248 nm to 193 nm and 157 nm, and numerical apertures increase from 0.5 to 0.6, 0.68, and 0.75, the resolution limit of k 1 ⫽ 0.5 stands firm with conventional optical lithography. Approaching k 1 ⫽ 0.5 imposes formidable problems due to image quality degradation associated with the loss of increasing numbers of diffracted orders. Off-axis illumination (OAI) and alternating PSM (hereafter referred to simply as “altPSM”) are techniques that can be used to overcome this fundamental resolution limit, essentially by eliminating the zeroth diffracted order and thereby imaging with properties similar to a two-beam interference system. These frequency-doubling techniques can be used to extend the ultimate resolution limit to the k1 ⫽ 0.25 level. In integrated-circuitry (IC) manufacturing, the k 1 factor is not used so much as a measure of the ultimate resolving power of any given lithography system, but more as a gauge of the difficulty of achieving a particular resolution with given values of and NA. As pattern dimensions and pitches decrease, fewer diffracted orders are captured by
L. W. LIEBMANN ET AL.
the imaging optical system, causing the wafer image to be reconstructed with less high-frequency detail, thus leading to image quality degradation. Quantified in terms of the lithographic process window (i.e., the range of exposure dose and defocus over which acceptable image size tolerances can be maintained), the ease with which a certain resolution can be achieved is directly related to lithography yield at a fixed linewidth tolerance. As indicated by the steady decrease of k 1 in Figure 1, lithography has become more demanding over time, even though exposure tools have steadily gained resolution by decreasing and increasing NA. The data are projected toward the hard stop of k 1 ⫽ 0.25. Additionally, it is not only the process window for any one feature dimension and pitch that matters in IC lithography. Successful feature definition depends on the collective or common process window of all feature types, sizes, and pitches found on any given mask level in the IC process. While some mask layouts contain features that simply cannot be resolved by a particular lithography process, in many cases it is not the size of the process window of any one feature type that limits the common process window, but the lack of overlap of the various process windows in the dose-focus space. Simply put, each individual feature may print well, but problems may arise if the various feature types do not print well at the same dose and focus. The use of OPC and SRAF, in contrast to altPSM and OAI, does not improve the fundamental resolution limit of an optical lithography system as defined by Rayleigh’s equation, but it does improve the common process window of an IC mask level by optimizing the overlap of individual process windows. Also of increasing concern is the linewidth variation that individual features experience across the imaged field from exposure tool imperfections such as lens aberrations, focus plane tilt, and variations in illumination intensity. The use of SRAF in particular reduces sensitivity to these across-field effects. As summarized in Table 1, the various RETs each play a unique role in advancing practical lithography resolution to ever smaller dimensions and facilitating high-yield lithography processes at decreasing values of k 1 . Though the strong interaction among the various RETs is apparent in Table 1, this paper focuses on the use of OPC, SRAF, and altPSM—the TCAD-intensive RETs that are implemented in the mask plane of the exposure system.
OPC Optical proximity correction, in essence, is the deliberate and proactive distortion of photomask shapes to compensate for systematic and stable patterning inaccuracies. The term OPC was derived in large part from the early origins of this RET. Today, many inaccuracies in addition to purely optical diffraction
IBM J. RES. & DEV.
VOL. 45 NO. 5 SEPTEMBER 2001
effects are taken into account in the quantification of process errors, and many layout characteristics in addition to simple shape proximity are used to classify the mask shapes which are undergoing correction. However, attempts to update the well-established term OPC to better reflect its current function have not been well received throughout the industry. Corrections in the form of mask-shape manipulations were introduced with CMOS technologies using 0.5-m minimum feature sizes and have remained commonplace ever since. These corrections were applied iteratively and manually to the layout on the basis of chip characterization feedback. Such labor-intensive manual corrections could be applied only to small numbers of highly arrayed layouts such as memory cells. The first application of “modern” OPC at IBM came in 1993 in the form of an application denoted as “shrinkLonelyGates,” coded on IBM’s hierarchical shape-manipulation engine, Niagara [1]. As the name implies, the routine identified optically isolated gates (i.e., polysilicon conductor shapes intersecting diffusion shapes that had no opposing neighbors within a distance of 1.5 m) and applied a width reduction to compensate for a nested-to-isolatedlinewidth offset in this patterning process. This very early implementation of OPC was demonstrated to yield a 6% performance improvement on integrated 0.5-m DRAM chips. A slightly more sophisticated OPC routine was shown to yield 20% improvement in access time on integrated 0.25-m DRAM chips in 1994 [2]. From there, selective line biasing (SLB) evolved into a manufacturable application that tightly integrates process characterization and layout manipulation with existing mask data preparation requirements [3], as illustrated in Figure 2. Special test chips are exposed to characterize the behavior of linewidth as a function of feature size, spacing,
Test chip contains structures to investigate linewidth variation as a function of layout parameters such as nominal linewidth, pitch, pattern density, orientation, and field position
Process/tool errors
Improvement of process/tools
Errors that can be corrected by OPC
Correction table
Data preparation
Optimized chip
Layout designs Product chip Process monitors
OPC tool
Tooling marks
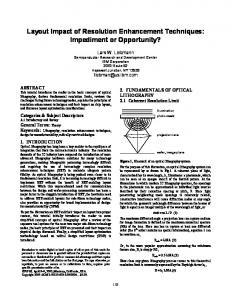
Figure 2 Schematic diagram of the integration of selective line-biasing OPC into the wafer and mask process flow.
orientation, local pattern density, position in the exposure field, and other systematic layout parameters. Software tools sort linewidth errors into process or tool effects that cannot be addressed by mask compensations and those that are suitable for OPC. Error functions are inverted to correction functions which, in consideration of correction constraints, yield the OPC rules tables. The layout manipulation for OPC is integrated with other datapreparation operations such as fill pattern generation and device scaling. The data-preparation effort also involves the merging of various layout components contained on the lithography mask such as the product chip and process monitors and tooling marks contained in the sacrificial dicing corridor between chips (commonly referred to in IBM as the kerf ).
Summary of resolution-enhancement techniques.
Table 1
Technique
Point of use
OPC
Mask
Resolution (k 1 ) 0.5
Improves common process window, needed for all other RET
OAI
Illuminator
Attenuated PSM
Mask
0.5 conventional; 0.25 with OAI
Uses intrafeature phase interference to improve image fidelity; improves exposure latitude for OAI
SRAF
Mask
0.5 conventional; 0.25 with OAI
Broadens the pitch range for which OAI is effective; reduces sensitivity to lens aberrations
Alternating PSM
Mask
0.25
Top-surface imaging
Wafer
0.25 with other RET
IBM J. RES. & DEV.
VOL. 45 NO. 5 SEPTEMBER 2001
0.25
Benefit
Optimizes illumination angle for one pitch
Uses interfeature phase interference to double the resolution Reduces necessary depth of focus by providing planar substrate
L. W. LIEBMANN ET AL.
653
Layout
Image
Correction
(a)
(b)
(c)
Figure 3 Illustration of various two-dimensional-rules-based OPCs. Area- or minimum-dimension-dependent feature biasing, illustrated in part (a), is aimed at boosting the process window of “minority” features. The line-end anchors and corner serifs in parts (b) and (c) illustrate applicability to specific feature elements in order to improve the electrical performance of the patterned devices. Polysilicon and diffusion regimes are respectively depicted in blue and orange.
Figure 4 Example of OPC applied to inside corners of a diffusion region. Corner rounding on inside corners in the diffusion region, close to a polysilicon conductor intersection, causes poor control over gate width as a function of polysilicon-to-diffusion overlay. Corner serifs selectively applied to the diffusion shapes do not necessarily improve the accuracy of the rendered shape, but the displacement of rounded corners yields better device performance.
654
L. W. LIEBMANN ET AL.
The major drawback of the success of SLB is that this form of OPC is now so commonplace on all critical levels that no data exists for comparison to exposures that have not been subjected to OPC, preventing further quantification of the enhancement provided. Dedicated linewidth characterization test chips, usually based on resistive linewidth measurements, are generated on the basis of the dimensions and relevant pitches of every new CMOS technology generation. These test chips are processed through the critical processing steps, most often the polysilicon conductor or gate level, to yield extensive data on the behavior of linewidth as a function of various layout parameters. Software applications have been implemented to sort wafer data by origin of the variation, whether due to wafer-to-wafer, across-wafer, across-field, pitch-dependent, orientation-dependent, density-dependent, or linewidth-dependent effects. From these data, a layout correction recipe is formulated that dictates the amount of edge movement to apply to each shape segment on the basis of its local environment. In addition to linewidth corrections, OPC is also applied to two-dimensional patterning errors in the form of feature biasing, line-end extensions, line-end anchors, and corner serifs. Figure 3 illustrates various two-dimensional, rules-based OPCs. In the strictest definition, the term OPC refers only to mask-shape manipulations that aid in the accurate reproduction of the layout design. However, some corrections applied as part of OPC target an improvement in the robustness of the patterning process while maintaining acceptable tolerances relative to the original design. If a lithography process is highly optimized to improve the available process window on regular array structures, the process window for isolated features, or features at abrupt proximity transitions, is insufficient to print these structures reliably. The corrections applied to these layouts sacrifice a tolerable amount of image size and placement accuracy to improve overall process robustness. Many corner serifs do not improve the fundamental squareness of the printed corner, which is dictated by the point-spread function of the lithography tool, but they manipulate the placement of the rounded corner to improve chip functionality. Figure 4 illustrates the use of corner serifs to improve the overlay insensitivity of the polysilicon conductor (vertical lines) to diffusion (U shape) by increasing the “flat” portion of the diffusion region while increasing the corner undercut. As a matter of data-handling efficiency, these manufacturability enhancements are carried out in conjunction with OPC and are usually applied under the same designation. The success of OPC in providing a relatively low-cost improvement in patterning quality at high resolutions has produced a significant increase in the quantity and complexity of OPC, as shown in Figure 5.
IBM J. RES. & DEV.
VOL. 45 NO. 5 SEPTEMBER 2001
No. of mask levels for which OPC is used
IBM’s current 130-nm technology generation for logic chips may employ some form of OPC on all critical levels, as shown in Table 2. While proven as an effective RET, this extensive deployment of OPC and the rapid growth in quantity and complexity of OPC is placing significant resource pressure on mask data preparation. The increasing demands placed on OPC at higher resolutions drive more complicated corrections. Line-end anchors that used to be “one size fits all” are now being pushed to the limit of providing maximum line-end shortening compensation for any local layout configuration without causing yield failures due to pattern shorts to neighboring structures. These very aggressive and detailed OPC instructions must be generated on the basis of increasing amounts of wafer data. Experimental verifications of the corrections are becoming increasingly difficult. The risk of introducing erroneous layout modifications due to unexpected local shape configurations that were not adequately addressed in the OPC instructions is increasing. Also, the computing resources necessary to implement these corrections are approaching prohibitive levels. A possible solution to these OPC concerns lies in model-based OPC. Illustrated conceptually in Figure 6, model-based OPC, much like rules-based OPC, begins by collecting information on the patterning process, usually through specialized test patterns. These data are then turned into a mathematical model of the patterning behavior. While several different modeling approaches exist [5, 6], they are all essentially based on a first-principle calculation of the aerial image rendered by the exposure tool, with some additional empirical functions to improve the model predictions relative to the actual process data. With this model in hand, no attempt
7 No. of No. of No. of No. of No. of
6 5 4
selected components anchors SLBs serifs assists
3 2 1 0 500 nm 350 nm 250 nm 180 nm 130 nm 100 nm SIA ITRS equivalent technology design rule levels
Figure 5 Use of OPC in the IBM Microelectronics Division as a function of Semiconductor Industry Association (SIA) International Technology Roadmap for Semiconductors (ITRS) equivalent technology nodes [4]. The appreciable increase in use that has recently occurred is clearly evident.
is made to calculate the appropriate corrections directly, as in rules-based OPC. Instead, the features undergoing correction are iteratively manipulated until the modeled pattern prediction matches the target layout. In most cases, the target layout is represented by the original layout, and iterations continue until the modeled pattern predictions match the input layout. But some patterning inaccuracies that are being addressed by modelbased OPC, such as line-end shortening, are already included in the design-rule process assumptions. Using
Table 2 OPC options for the IBM Microelectronics Division’s SIA Roadmap 180-nm and 130-nm equivalent CMOS-logic technologies. Level
OPC for 180-nm SIA Roadmap design rules
Potential OPC for 130-nm SIA Roadmap design rules
Diffusion
Fill patterns Binary-area-based complexity
Fill patterns Area-based shape bias Selective line bias Polysilicon-aware inside serifs Metal-aware outside serifs
Polysilicon
Fill patterns Generic line-end anchors
Fill patterns Proximity-based line-end anchors Selective line bias SRAF
Metal
Fill patterns Binary line-end extension Generic landing pads
Fill patterns Proximity-based anchors Proximity-based landing pads Selective line biasing
Contacts
IBM J. RES. & DEV.
Selective edge biasing
VOL. 45 NO. 5 SEPTEMBER 2001
L. W. LIEBMANN ET AL.
655
Test chip
Wafer data
Process model
Original input Simulate Product chip
Manipulate
Evaluate
Optimized chip
Target pattern
Figure 6 Model-based OPC concept illustrating the forward iterative nature of the correction. The simulated image of the manipulated layout is compared to the target pattern to determine the need for further layout manipulation. Iterations continue until the optimum match between simulated image and target pattern is found within the constraints of mask manufacturability.
(a)
(b)
(c)
(d)
the initial layout as the correction target leads to an overcorrection because the OPC tool is not provided with an accurate rendering of the desired wafer image. Besides the often long run times involved in iteratively optimizing full-chip layouts (model-based OPC is still approximately two to three times slower than complex rules-based OPC) and the need to exactly define an accurate target layer (which amounts to the use of a rules-based uncorrection prior to the model-based correction), great care must be taken in the calibration and verification of the OPC models. One promise of model-based OPC is that models, unlike rules, can be interpolated to cover layout situations not directly included in calibration test structures. More work is needed to fully understand the practical limitations of this theoretical benefit for various model forms. A common shortcoming of all currently implemented OPC approaches is the fact that they address process window improvements only indirectly. In manufacturing, wafer patterns must be produced that fall within given size tolerances at a given nominal size. For many chips, producing patterns with narrower tolerances than are assumed in the design optimization phase has little impact on chip performance. However, increasing the range of dose and focus over which targeted tolerances can be maintained has significant impact on lithographic yield. This effective blurriness of the target layout and imaging process cannot be taken into account using current OPC techniques. A more sophisticated, process-window-based technique (Figure 7) is under development [7] to address these shortcomings. Starting with the original layout, this technique generates an upper and lower bound for all edges in the design on the basis of electrical performance considerations. The model in this process-window-based OPC technique returns not individual contours that predict how a layout would image under any one exposure condition, but rather a range within which each edge would fall for a given process. The layout optimization then simply focuses on containing the predicted image range within the allowable target bounds for all feature edges over the largest range of dose and focus.
SRAF
Figure 7 Illustration of process-window-based OPC. On the basis of the layout (a) and design rules as well as circuit performance characteristics, an acceptable tolerance band (b) over which the circuit should perform to specification is derived. The simulation engine, rather than calculating the exact image rendered at any one exposure dose and defocus, returns the bounds over which the image should vary through a given range of exposure dose and focus (c). Any regions of the simulated image bounds that fall outside the acceptable tolerance band lead to performance degradation (d) and must be minimized by manipulating the mask shapes.
656
L. W. LIEBMANN ET AL.
Off-axis illumination (OAI) provides significant processwindow enhancement by optimizing the angle of oblique illumination for a certain pitch [angle ⫽ /(2 ⫻ pitch ⫻ NA)]. The obvious drawback to this approach is that pitches other than the primary pitch print with degraded process windows. The use of subresolution-assist features provides a means of recovering the process window for pitches that are not enhanced by the OAI. By creating nonprinting supplementary patterns next to the primary patterns in such a way that the combined layout approximately reproduces the primary pitch, the overall
IBM J. RES. & DEV.
VOL. 45 NO. 5 SEPTEMBER 2001
1. Generation of SRAF rules that govern the number, size, and placement of the assist features. 2. Optimization of SRAF “style options” that specify the behavior of the assist features in two-dimensional environments. 3. Implementation of SRAF design engines that efficiently and accurately generate assist features for full-chip layouts. Some of the key challenges in these areas are addressed next. Simplistically, the size of the assist features must be chosen so that they are large enough to have the desired optical enhancement effect but small enough not to resolve as actual patterns on an exposed wafer. Details of main-feature biasing, number of assist features to be added, and their size and placement, must be optimized as a function of feature spacing to yield the best throughpitch linewidth control or overall process window [8]. These SRAF design rules are communicated to an SRAF design tool via extensive tables such as Table 3. In the layout generation of assist features, many of the challenges arise from the fact that, unlike the onedimensional test structures used to optimize the SRAF rules, actual chip layouts are two-dimensional; see for example Figure 9. In addition to the assist feature size and placement rules, style options must be defined to govern the behavior of assist features in two-dimensional layout configurations such as line ends, corners, proximity discontinuities formed by nonprojecting edges, nonorthogonal segments, and other allowed designs that
IBM J. RES. & DEV.
VOL. 45 NO. 5 SEPTEMBER 2001
Assisted Process window
process window can be improved. As illustrated in Figure 8, because of the finite design grid of the CAD tools and because of mask manufacturability constraints, subresolution-assist features can only be drawn in discrete steps in size and spacing. This leads to a discontinuous process window curve as a function of pitch. While the process window for unassisted layouts decreases monotonically as the pitch increases away from the primary pitch for which the OAI was optimized (typically the tightest pitch), the assisted process window decreases until the spacing between the primary features is large enough to insert an assist feature. As the spacing continues to grow, the optimum size of the assist feature continues to change (as the process window benefit of the single assist feature gradually erodes) until there is enough space for two assist features, restoring the optimum process window. This rise and fall of the process window continues until, in the current implementation, every edge is given up to two assist features or every space is filled with up to four assist features. The challenges associated with the implementation of SRAF fall into three general categories:
Unassisted
Pitch
Figure 8 Illustrative use of SRAF. Discontinuous process-window enhancement occurs because of the discrete nature of assist feature optimization. Typical process windows (in color) for assisted and unassisted layout shapes are shown as a function of main feature (in black) spacing (pitch). The number, size, and placement of the assist features (in corresponding colors) vary as a function of feature spacing to optimize lithographic performance within the confines of mask manufacturability.
are not directly covered by the pitch-dependent onedimensional SRAF rules. Early iterations of the IBM Microelectronics Division product integration exercise [9] showed that even small discontinuities in the assist features led to patterning problems such as the notching shown in Figure 10. To optimize the SRAF style options, the correct balance between the maximum SRAF effect through complete assist-feature coverage and yield failures due to unwanted assist-feature images, as illustrated in Figure 11, must be established experimentally. Since this optimization depends not only on chip layout but also on details of the lithography and etch process, significant lead time must be anticipated in SRAF implementation [10]. Even with optimized style options, the extrapolation of onedimensional SRAF rules to two-dimensional circuit layouts presents a problem for which no exact solution exists within the bounds of manufacturability. As in rules-based OPC, assist-feature design must address the problem that manipulation of the layout on the basis of proximity changes the proximity environment in ways that are sometimes unpredictable. In other situations, specifically when a proximity environment is described by nonparallel projecting edges, accurate corrections cannot be applied within the constraints of mask manufacturability. The only accurate solution would require the use of assist features designed at angles not supported by current mask processes. Unlike rules-based OPC, layout manipulations to add assist features occur over much larger length
L. W. LIEBMANN ET AL.
657
Figure 9 Illustrative chip layout (solid) with assist features (shaded), illustrating their two-dimensional nature.
scales; whereas OPC moves feature edges a few nm, assistfeature design results in the creation of new structures several hundred nm away from the original feature edge. While SRAF and rules-based OPC suffer from the same shortcomings, the inaccuracies are much more noticeable in SRAF, and iterative solutions such as model-based OPC are not currently available for assist-feature designs. To manage the necessary tradeoffs between lithographic enhancement and manufacturability constraints, the
various assist features designed in a chip layout can be prioritized according to their importance to overall chip performance. To optimize the tradeoff between manufacturability and performance enhancement, a computer-aided design (CAD) approach has been developed that ensures the hierarchical survival of assist features in proportion to their established priority [11]. Generating assist features in integrated chip layouts, along with selective line biasing and other OPC techniques such as the addition of line-end anchors, requires sophisticated TCAD routines written on powerful shapemanipulation software and running on fast computers. The current IBM electronic design automation (EDA) tool running on the Niagara platform consists of three major subroutines— one to apply selective line biasing and lineend anchors, the next to generate the assist features, and finally one to ensure compliance with design ground rules, or “legalize” the output. With approximately 500 lines of code including several sequential calls to specialized tabledriven OPC functions, SRAF defines a new level of data preparation complexity that far exceeds previous efforts. Integrating SRAF and OPC into a robust process that includes all of the conventional data-preparation functions is also very challenging. A current priority in the introduction of SRAF into manufacturing is to close the gap between the current run times of several days for complex chip layouts and the much shorter data preparation run times experienced with previous CMOS generations (four hours of data preparation time per mask level). Current efforts are focused on reducing SRAF rules complexity, streamlining the application code, and
Table 3 Partial SRAF rules table that defines the critical parameters in assist-feature generation as a function of feature pitch. SRAF tables used in practice contain many more lines of rules.
658
Linewidth (nm)
Spacing (nm)
Edge bias (nm)
175 ⬃ 175 175 ⬃ 175 175 ⬃ 175 175 ⬃ 175 175 ⬃ 175
245 ⬃ 437.5 455 ⬃ 577.5 595 ⬃ 822.5 840 ⬃ 1032.5 1050 ⬃ 1225
26.25 ⬃ 43.75 17.5 ⬃ 26.25 8.75 ⬃ 8.75 8.75 ⬃ 8.75 0 ⬃ 8.75
L. W. LIEBMANN ET AL.
No. of assist features
Assist feature width (nm)
⬃
⬃
1 ⬃ 1 2 ⬃ 2 3 ⬃ 3 4 ⬃ 4
78.75 ⬃ 87.5 65.625 ⬃ 70 65.625 ⬃ 74.375 65.625 ⬃ 74.375
Inner assist feature location (nm) ⬃ 315 ⬃ 376.25 277.8125 ⬃ 293.125 273.4375 ⬃ 286.5825 260.3125 ⬃ 277.8125
IBM J. RES. & DEV.
Outer assist feature location (nm) ⬃
⬃ 507.5 ⬃ 603.75 461.5625 ⬃ 492.1875
VOL. 45 NO. 5 SEPTEMBER 2001
improving the use of parallel processing to facilitate volume use of SRAF. To manage the complexity of the SRAF rules and manufacturability constraints and permit accurate and fast verification of the SRAF design code, the system outlined in Figure 12 has been implemented. Using empirical or simulation input on process behavior as a function of dose
(a)
(a)
(b) (b)
Figure 11 Residual images resulting from the use of overly aggressive SRAF style options.
(c)
Figure 10 Examples of different SRAF style options and their effects on patterning. An SRAF design used in an attempt to enhance line ends as well as straight-line segments (a) leads to image degradation at the nested-to-isolated feature transition (b). This can be avoided by using an SRAF style that focuses on improving continuity through proximity transitions (c).
IBM J. RES. & DEV.
VOL. 45 NO. 5 SEPTEMBER 2001
and focus, as well as constraints imposed by the CAD tool layout grid and mask manufacturability, the tool produces rules tables as well as a variables file in a format that can be directly interpreted by the SRAF generator. To verify the correct design of the assist features, a comprehensive test structure with the correct line biasing and assist features for all table entries is generated directly from the rules tables via the IBM CAD script language. After assist features have been generated for this test structure, the output can be compared, and discrepancies in the rules, constraint files, or generation code can be pinpointed.
L. W. LIEBMANN ET AL.
659
Mask constraints (a) Test mask
Expose Etch Implant
FEM wafers
Probe Analyze
PW data
Weighted curve fits
Rules table
(b) Niagara routine Rules table
Convert
dffl files
Debug
Test generator
Test structures
Feature bias SRAF size/spacing Constraint parameters
Kerf macro
Rules verification
Figure 14 Figure 12 SRAF system flow. Spacing and size rules are generated to optimize the process window (PW) based on empirical or simulated focus exposure matrix (FEM) wafers. These rules are used to generate subroutines that link directly to the SRAF design program (in dffl, the Niagara programming language) and are also used to directly generate test structures spanning the feature size and pitch environment of interest and containing appropriate assist features. These test structures are used to debug and verify the SRAF generation code and can be used in chip support structures and process monitors to experimentally verify the SRAF rules.
Mask cross section
Amplitude in mask plane Amplitude in wafer plane
Intensity in wafer plane
Figure 13 Schematic diagram comparing conventional binary mask lithography (left) and phase-shifted-mask lithography (right). The path-length difference in alternate patterns in the phase-shifted mask causes light with amplitudes of equal magnitude but opposite sign to be transmitted through neighboring mask openings.
660
L. W. LIEBMANN ET AL.
Example of a phase-shifted CAD layout of a mask feature (a) and schematic diagram of the resulting alternating phase-shifted mask (b). The layout shapes defining the polysilicon layer (blue) define opaque regions (green) on the photomask. The layout shapes defining the phase regions (purple) define the topology step in the mask substrate.
Alternating PSM The use of alternating PSM (altPSM) improves lithographic resolution by introducing a 180⬚ phase shift between adjacent features on the photomask. As illustrated in Figure 13, this phase shifting is accomplished by creating a path-length difference for the exposing light between adjacent features in the high-index-of-refraction mask material. Recessing the transparent mask material appropriately [depth ⫽ 0.5/(n ⫺ 1)] causes destructive interference in the light diffracted into nominally dark spaces from adjoining clear openings, thus improving feature resolution. In essence, the spatial frequency with which patterns on the photomask (as described by transmission and phase) repeat is doubled with respect to a conventional binary (i.e., non-phase-shifted) mask, and resolution is improved by a factor of 2 (minimum k 1 for altPSM is 0.25 vs. 0.5 for a binary mask). For both sets of illustrations in Figure 13, diffraction effects cause the light to blur at the wafer end of the exposure system. In conventional binary-mask lithography, the constructive interference of light from adjacent patterns causes the loss of contrast for small, tightly spaced features. In altPSM, the destructive interference between the out-of-phase light from adjacent patterns minimizes the light intensity (square of the amplitude) in nominally dark regions between tightly nested patterns, thereby increasing the process window over which patterns can be resolved.
IBM J. RES. & DEV.
VOL. 45 NO. 5 SEPTEMBER 2001
(a)
(d)
(b)
(e)
(c)
(f )
(g)
Figure 15 Various altPSM design approaches for the polysilicon conductor levels, as discussed in the text.
While altPSM was initially introduced for alternating apertures in a dark background [12], the same principle can be applied to imaging dark lines in a clear background [13], as is needed in the lithography of the very important polysilicon conductor or gate levels of IC processes. To utilize the destructive interference of phase-shifted light to enhance the resolution of isolated lines, a topography step must be introduced into the photomask, as shown in part (a) of Figure 14. This topography step is accomplished by etching specified 180⬚ phase regions, which are defined in a secondary mask-patterning operation, into the substrate of the mask. That operation, which enables the etching of the phase regions, requires a CAD data level to define the location of a desired phase region, as shown in part (b). While there are many challenges associated with the fabrication and exposure of masks used in altPSM, the EDA effort can be reduced to the simple task of drawing the desired phase region adjacent to every shape requiring the lithographic enhancement afforded by altPSM. Some amount of difficulty is added to the altPSM design process by the fact that the same destructive interference that improves resolution on critical layout patterns also leads to the imaging of unwanted features. Since the recessed-phase region on the photomask must
IBM J. RES. & DEV.
VOL. 45 NO. 5 SEPTEMBER 2001
be defined as a complete polygon (as opposed to a single edge), phase edges always form a closed-loop topology. Every edge of the phase region, whether or not it resides on a layout feature, leads to a dark shadow in the printed image. For some layouts, such as looped gates, this is not a problem, but for the vast majority of IC layouts, measures must be taken to eliminate the unwanted images from such residual phase patterns. To address this and other issues associated with the implementation of altPSM, many unique embodiments of the relatively simple altPSM design concept have evolved, driving the need for very adaptable automated design solutions. Figure 15 illustrates various altPSM design approaches that can be employed to print dark line patterns, such as the polysilicon conductor (in blue) and diffusion (in orange) layout shown in part (a). Initial success was achieved in using altPSM to support lithography for exploratory device fabrication at sub-100-nm dimensions with 250-nm technology exposure tools [14]; use was made of a double-exposure technique using a bright-field altPSM in combination with a dark-field trim mask to erase residual phase-edge images, as illustrated in part (b), with opaque regions in blue and phase-shifted regions in purple. More recently, because of its ease of mask
L. W. LIEBMANN ET AL.
661
(a)
(b)
(c)
Figure 16 Illustrative altPSM design conflicts (shown crosshatched) that must be avoided by design rules: (a) Topologies that cannot be assigned a set of 08 and 1808 phase regions without conflict; (b) increased spacing requirements (as indicated by arrows) to fit phase regions and manufacturable chrome regions between phases on the mask; (c) odd–even conflicts in which linked phase “runs” undergo different numbers of phase alterations.
Table 4
altPSM challenges and solutions.
Technology
662
inspection, use has been made of a dark-field altPSM with a bright-field block-mask approach [15], as illustrated in part (c), with two phase regions differing by 180⬚, shown in green and purple. Avoiding the need for double exposures to eliminate residual phase-edge images led to the development of a conjugate twin-shifter altPSM approach [16], illustrated in part (d), with phase regions at 90⬚ and 270⬚, and an altPSM approach involving the use of intermediate phase steps along residual edges [17], illustrated in part (e), with partial phase steps along residual edges (in red and yellow). Attempts to avoid complicated design rules associated with the use of altPSM (discussed in the following section) have popularized partial altPSM design approaches such as the “gate-only” approach illustrated in part (f). Reducing across-field linewidth sensitivity to lens aberrations is the goal of an enhanced altPSM design approach [18], as illustrated in part (g). In addition to supporting these variations in the altPSM design approaches, a robust altPSM design system also must be extendible to layout levels other than polysilicon conductor levels, adding significant complexity to altPSM design tool development. Shortly after its conception, altPSM was used at IBM to print functional isolated device structures at extremely small dimensions (200 nm, using a low-NA, 365-nm I-line exposure tool) [19], demonstrating its potential for practical resolution enhancement. The development of automated design systems that could convert entire logic chip polysilicon conductor levels to altPSM layouts allowed full-chip demonstrations of this powerful lithography technique [20]. However, a number of technical and logistical stumbling blocks have forced altPSM to remain the backup manufacturing lithography solution for several technology generations at IBM and throughout the industry. Table 4 contains a list of altPSM challenges and solutions at technology levels from 250 to 100 nm. Following the development of automated design systems and reliable mask-manufacturing processes, the major difficulty in the broad-scale implementation of altPSM
Challenge
Solution
250 nm
Manual designs are too time-consuming. Double exposure has an impact on lithography throughput.
Developed internal design tool. Converted to conjugate twin shifter.
180 nm
Chip designs cannot simply be converted to altPSM layouts after the chip design is complete.
Developed integrated and distributed altPSM design infrastructure.
130 nm
Inspection of mask defects may be insufficient. Increased design effort is required.
Converted to dark-field altPSM. Continuing requirement.
100 nm
Aberrations induce linewidth variation.
Converted to enhanced altPSM.
L. W. LIEBMANN ET AL.
IBM J. RES. & DEV.
VOL. 45 NO. 5 SEPTEMBER 2001
involves altPSM-specific design rules. Even the most sophisticated altPSM design tool fails to convert any arbitrary layout to an altPSM design. Certain configurations, such as a three-way intersection of critical dimension lines, cannot be converted to an altPSM design in which all three critical lines receive the required phase transition. This is illustrated in Figure 16(a). The finite width of the phase regions and the spacing between them, both driven by exposure parameters and mask manufacturability, require restrictions on the placement of critical layout structures relative to one another to ensure allowed phase topologies, as illustrated in Figure 16(b). The most difficult design rule to check and enforce relates to the binary nature of the phase assignment. Any node in the phase run (i.e., any phase transition in a sequence of phase-related structures) can assume only one value, but there are instances in which multiple phase runs join at a single node, leading to the potential for long-range phase conflicts. This is illustrated in Figure 16(c). Because of specific design constraints, unlike OPC and SRAF, altPSM cannot be applied as part of mask data preparation without careful integration of altPSM into the entire chip layout design process. Initially, altPSM design tools focused on processing entire chip layouts accurately and efficiently [20]. The implementation of altPSM as the manufacturing lithography choice for a logic technology generation has forced a restructuring of the altPSM design process and associated design tool needs. Design rules had to be generated to 1) cover the dimensional requirements of the phase shapes; 2) detail explicitly what part of the layout would be phase-shifted and therefore checked as a critical shape; and 3) ensure that the resulting altPSM layout could be verified accurately with conventional design-rule checking tools. The basic altPSM design system had to be diversified into altPSM-capable layout synthesis, altPSM-compliant layout migration, interactive altPSM design tools for custom layouts, and tools and methodologies to handle cell placement and chip assembly. The system yielded a variety of altPSM layouts, comprising completed altPSM macro or chip layouts, phase-compliant (verified) but not phase-shifted macro or chip layouts, and waivered macro or chip layouts requiring specialized altPSM treatment [21]. While the polysilicon mask level has required the highest-resolution lithography of any CMOS logic technology generation, other mask levels in the manufacturing sequence are approaching the limits of conventional lithography. This has forced lithographers to consider altPSM for additional mask levels, requiring a more complicated design infrastructure. Applying altPSM to metal or wiring levels, for example, will require placeand-route tools that are compatible with altPSM design
IBM J. RES. & DEV.
VOL. 45 NO. 5 SEPTEMBER 2001
requirements or are capable of completing altPSM designs along with chip assembly tasks. While volume manufacturing use of altPSM remains elusive, its contributions to high-resolution lithography in process and device development have been significant; increased development efforts will be necessary to retain it as a viable lithography alternative.
Concluding remarks Resolution-enhancement techniques have been demonstrated to provide a cost-effective means of maintaining the aggressive evolution to ever-smaller dimensions in integrated circuit manufacturing. Not just temporary patches to bridge to shorter wavelengths, RETs are becoming integral components of manufacturing lithography solutions, their importance increasing steadily for all remaining optical lithography generations. Compared to the lithography tooling and photoresist requirements of high-resolution lithography, resource requirements for RETs remain modest but are rapidly increasing to the point at which strategic investments must be made in order to maintain the explosive growth of RET applications. The application of RETs to advanced chip layouts, such as embedded DRAM logic designs, presents formidable logistical challenges, requiring ongoing application development in addition to aggressive manufacturing implementation. Even the eventual advancement to non-optical next-generation lithography techniques will not end the need for TCAD development for lithography resolution enhancement.
References 1. P. Russell and G. Weinert, “System and Method for Verifying a Hierarchical Circuit Design,” U.S. Patent 5,528,508, June 1996. 2. L. Liebmann, B. Grenon, M. Lavin, S. Schomody, and T. Zell, “Optical Proximity Correction, a First Look at Manufacturability,” 14th Annual BACUS Symposium on Photomask Technology, Proc. SPIE 2322, 229 –238 (1994). 3. M. Lavin and W. Leipold, “VLSI Manufacturing Shape Data Preparation,” MicroNews, p. 14, 3Q99, published by IBM Microelectronics Division. 4. Semiconductor Industry Association, International Technology Roadmap for Semiconductors: 2000, SEMATECH, Austin, TX, 2000. 5. J. Stirniman and M. Rieger, “Fast Proximity Correlation with Zone Sampling,” Optical/Laser Microlithography VII, Proc. SPIE 2197, 294 –301 (1994). 6. N. Cobb, A. Zakhor, M. Reihani, F. Jahansooz, and V. Raghavan, “Experimental Results on Optical Proximity Correction with Variable Threshold Resist Model,” Proc. SPIE 3051, 458 – 468 (1997). 7. L. Liebmann, A. Wong, R. Ferguson, and M. Lavin, “Process Window Based Optical Proximity Correction,” IBM patent application, November 2000. 8. S. Mansfield, L. Liebmann, A. Molless, and A. Wong, “Lithographic Comparison of Assist Feature Design Strategies,” Proc. SPIE 4000, 63–76 (2000). 9. J. Bruce, M. Cross, L. Liebmann, S. Mansfield, and A. McGuire, “Assist Features—Challenges and Opportunities,” Proceedings of the ARCH Microlithography
L. W. LIEBMANN ET AL.
663
Symposium, San Diego, November 5–7, 2000, pp. 103–119. 10. L. Liebmann, S. Mansfield, J. Bruce, M. Cross, I. Graur, A. McGuire, J. Krueger, and D. Sunderling, “Optimizing Style Options for Sub-Resolution Assist Features,” Proc. SPIE 4346, in press (2001). 11. L. Liebmann and S. Mansfield, “Method for Incorporating Sub Resolution Assist Features in a Photomask Layout,” IBM patent application FIS920000080US1, June 2000. 12. M. Levinson, N. Viswanathan, and R. Simpson, “Improving Resolution in Photolithography with a PhaseShifting Mask,” IEEE Trans. Electron Devices 29, 1812–1846 (1982). 13. M. Levinson, “Phase-Shifting Mask Strategies: Isolated Dark Lines,” Microlithography World, March/April 1992, pp. 6 –12. 14. P. Agnello, T. Newman, E. Crabbe, S. Subbanna, E. Ganin, L. Liebmann, J. Comfort, and D. Sunderland, “Phase Edge Lithography for Sub-0.1-m Electrical Channel Length in a 200mm Full CMOS Process,” Proceedings of the VLSI Symposium, IEEE Cat. No. 95CH35781, 1995, p. 79. 15. L. Liebmann, S. Mansfield, A. Wong, J. Smolinski, S. Peng, K. Kimmel, M. Rudzinski, J. Wiley, and L. Zurbrick, “High-Resolution Ultraviolet Defect Inspection of DAP (Darkfield Alternate Phase) Reticles,” 19th Annual BACUS Symposium on Photomask Technology, Proc. SPIE 3873, 148 –161 (1999). 16. H. Ohtsuka, K. Abe, T. Onodera, K. Kuwahara, and T. Taguchi, “Conjugate Twin-Shifter for New Phase-Shift Method to High-Resolution Lithography,” Proc. SPIE 1463, 112–123 (1991). 17. S. Kim, S. Woo, W. Han, Y. Koh, and M. Lee, “Application of Alternating Phase Shift Mask to Device Fabrication,” Proc. SPIE 2440, 515–523 (1995). 18. L. Liebmann and A. Wong, “Optimized Alternating Phase Shift Mask Design,” patent filed as Docket FIS 920000006US1 in U.S., May 8, 2000. 19. T. Brunner, P. Sanda, M. Wordeman, and T. Lii, “170-nm Gates Fabricated by Phase-Shift Mask and Top Antireflector Process,” Proc. SPIE 1927, 182–189 (1993). 20. L. Liebmann, I. Graur, W. Leipold, J. Oberschmidt, D. O’Grady, and D. Rigaill, “Alternating Phase Shifted Mask for Logic Gate Levels, Design and Mask Manufacturing,” Proc. SPIE 3679, 27–37 (1999). 21. L. Liebmann and F. Heng, “Optimized Phase Shift Migration,” U.S. Patent 6,083,275, July 4, 2000.
Received October 2, 2000; accepted for publication March 12, 2001
Lars W. Liebmann IBM Microelectronics Division, East Fishkill facility, Route 52, Hopewell Junction, New York 12533 (
[email protected]). Dr. Liebmann joined IBM in 1991 after receiving B.S. and M.S. degrees in nuclear engineering and a Ph.D. degree in engineering physics from Rensselaer Polytechnic Institute. He began work on resolutionenhancement techniques (RETs) at the IBM Advanced Technology Laboratory in Burlington, Vermont, as a means of supporting early device and process learning for nextgeneration products with previous-generation lithography tools. Dr. Liebmann is now applying his interest in optical proximity correction, phase-shifted masks, and subresolution assist features at the Semiconductor Research and Development Center of the IBM Microelectronics Division facility in Hopewell Junction, in support of IBM’s leadingedge logic and memory products. Focusing predominantly on CAD issues associated with the implementation of RETs in advanced optical lithography, he holds numerous patents in that field.
Scott M. Mansfield Hopewell Consultants, Hopewell Junction, New York 12533 (
[email protected]). Dr. Mansfield received a B.S. degree in engineering physics from Cornell University in 1987 and a Ph.D. degree in applied physics from Stanford University in 1992. While at Stanford, he specialized in near-field optical microscopy. He then joined IBM, where he spent nine years working in lithography development at the Semiconductor Research and Development Center of the IBM Microelectronics Division facility in Hopewell Junction. At IBM, his research interests included the development and implementation of advanced OPC and resolution-enhancement techniques. In 2001, Dr. Mansfield founded Hopewell Consultants, with the mission of developing advanced server-side applications. His current interests lie in extending the use of application server technology into manufacturing and development environments.
Alfred K. Wong Department of Electrical & Electronic Engineering, University of Hong Kong, Pokfulam Road, Hong Kong (
[email protected]). Dr. Wong received B.S. (1990), M.S. (1992), and Ph.D. (1994) degrees in electrical engineering from the University of California, Berkeley, where he focused on electromagnetic simulation on massively parallel computers using the time-domain finite-difference (TDFD) method. Prior to joining the University of Hong Kong and during the development of this paper, he was at the Semiconductor Research and Development Center of the IBM Microelectronics Division facility in Hopewell Junction. Dr. Wong’s research interests include photolithography, metrology, ACLV characterization, simulation of optical imaging and electromagnetic propagation, and implementation of resolution-enhancement techniques in advanced lithography.
Mark A. Lavin IBM Research Division, Thomas J. Watson Research Center, P.O. Box 218, Yorktown Heights, New York 10598 (
[email protected]). Dr. Lavin received B.S., M.S., and Ph.D. degrees in electrical engineering from the Massachusetts Institute of Technology. He joined the IBM Research Division in 1979, initially to work on industrial machine vision and robotics. He received several IBM Outstanding Technical Achievement Awards for the development of AML (A Manufacturing Language). Since 1990, Dr. Lavin has worked on applications of VLSI CAD
664
L. W. LIEBMANN ET AL.
IBM J. RES. & DEV.
VOL. 45 NO. 5 SEPTEMBER 2001
tools for enhancing semiconductor manufacturing; he has received an IBM Outstanding Innovation Award and seven patent awards for his work on the Niagara extensible shapes processor.
William C. Leipold IBM Microelectronics Division,
Burlington facility, 1000 River Street, Essex Junction, Vermont 05452 (
[email protected]). Dr. Leipold received B.S. and Ph.D. degrees in physics from Pennsylvania State University in 1969 and 1975, respectively. He joined IBM in 1978 and initially worked on FET reliability. Dr. Leipold is currently a Senior Engineer at the Essex Junction facility of the IBM Microelectronics Division, working on shapes manipulation applications for mask data preparation. He holds three patents with several more pending, and is a member of the International Society for Optical Engineering.
Timothy G. Dunham IBM Microelectronics Division,
Burlington facility, 1000 River Street, Essex Junction, Vermont 05452 (
[email protected]). After receiving an A.A.S. degree in electrical engineering technology in 1983 from Alfred State College of the State University of New York, Mr. Dunham completed the New Programmer training course in IBM in 1988; he received a B.S. degree in computer science from St. Michael’s College in 1999. He joined IBM in 1983, initially to work on chip layout in the Engineering Design Automation group. For the past seven years, Mr. Dunham has worked on data preparation and design services application programs in support of technology development.
665
IBM J. RES. & DEV.
VOL. 45 NO. 5 SEPTEMBER 2001
L. W. LIEBMANN ET AL.