We present a graph theoretic technique for automatic text summarization aimed ... comprehensive survey of the field can be found in [Mani and Maybury, 1999].
IADIS International Conference Applied Computing 2007
TEXT SUMMARIZATION: USING CENTRALITY IN THE PATHFINDER NETWORK Kaustubh Patil LIACC University of Porto, R. Ceuta, 118-6o, Porto, 4050-190, Portugal
Pavel Brazdil LIACC/FEP University of Porto, R. Ceuta, 118-6o, Porto, 4050-190, Portugal
ABSTRACT We present a graph theoretic technique for automatic text summarization aimed at producing extractive summaries of a single document. In our system, called as SumGraph, text is represented as a graph with sentences as nodes while weights on the links represent intra-sentence dissimilarity. Novelty of our approach lies in the use of Pathfinder Network Scaling (PFnet) technique representing conceptual organization of the text which in turn is used to compute importance of a sentence in the text. Importance of a sentence is defined using its centrality in the PFnet. Use of Latent Semantic Analysis (LSA) is also investigated. PFnet and LSA have been shown to model human aspects of semantic memory and linguistic acquisition respectively. We show that SumGraph performs better than other systems on DUC2001 and DUC2002 datasets for generating 100 word summaries, when compared using ROUGE-1 scores. We also show that SumGraph is different than other methods using a non-parametric statistical test. KEYWORDS Text summarization, graph theory, pathfinder networks, node centrality
1. INTRODUCTION Text summarization (TS) is a well studied area. Recently TS has gained widespread interest due to overwhelming amount of textual information available in electronic format. TS is the problem of condensing the source text into a shorter version while preserving the information content. TS can be applied to a single document or a cluster of related documents (multi-document). Furthermore, TS can be broadly grouped into abstractive summarization and extractive summarization. Abstractive summarization relies on Natural Language Processing (NLP) techniques to parse, interpret and generate text. NLP machinery is computationally expensive and far from perfect at the moment. On the other hand, extractive summarization is the process of verbatim extraction of textual units (sentences, paragraphs etc.) from the source text. Extractive summarization is easier and faster than abstractive summarization. If the textual unit to be extracted is a sentence (as in this work) then summarization can be viewed as a problem of selection of a subset of sentences from the source text. Along another dimension TS methods can be categorized into unsupervised techniques and supervised techniques [Chuang and Yang, 2000; Kupiec et al, 1995]. A drawback of supervised techniques is that they need annotated corpus, which is expensive. Also supervised techniques are not portable; as a summarizer trained for a particular purpose (e.g. language, technical documents) can not be used for other purpose. While unsupervised techniques do not rely on annotated corpus and roughly include the following approaches, surface level indicators and corpus statistics [Luhn, 1958; Edmundson, 1969], graph theory based techniques
3
ISBN: 978-972-8924-30-0 © 2007 IADIS
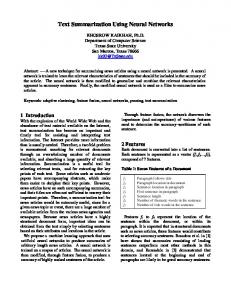
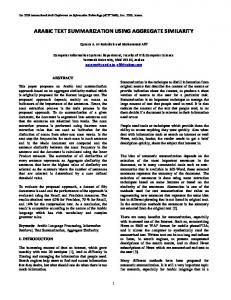
[Salton et al., 1997; Mihalcea, 2004; Erkan and Radev, 2004] and approaches employing natural language processing [Aone et al., 1997]. In general an extractive summarization system follows the framework in Figure 1. Most of the systems vary in step 2. Some systems use different sentence selection methods in step 3 to improve information coverage, particularly in the multi-document summarization due to potential information redundancy. A comprehensive survey of the field can be found in [Mani and Maybury, 1999]. 1. Sentence boundary discrimination 2. Calculation of sentence importance (ranking) 3. Selection of ranked sentences Figure 1. General framework for extractive summarization
We present a graph theoretic technique to produce summary of a single document, simply called as SumGraph. Use of graphs in summarization task is not a new idea. In the current work the proposed method is similar to LexRank [Erkan and Radev, 2004]. A novelty of our work is that we use a conceptually sound link reduction technique called as Pathfinder Network Scaling (PFnet) [Schvaneveldt, 1990; Schvaneveldt et al, 1988] and results indicate that our system performs better. The idea is to find salient sentences in the text using a centrality measure. In other words, the central nodes in a PFnet identify the important sentences in the corresponding text. We also investigate use of Latent Semantic Analysis (LSA) [Deerwester et al., 1990] a technique known to capture aspect of human linguistic acquisition [Landauer and Dumais, 1997]. This paper is organized as follows. In subsection 1.1 we shortly discuss evaluation methods. In section 2 we present our approach SumGraph, followed by a brief description of PFnet. Section 3 discusses datasets used and parameter settings. In section 4 we present results and conclude the work in section 5.
1.1 Summary Evaluation Assessing usefulness of a summary is a hard task and unfortunately there is no gold-standard method available. Summary evaluation measures are often grouped along two axes: extrinsic measures and intrinsic measures [Spark-Jones and Galliers, 1995]. Extrinsic evaluation often involves use of summaries for a specific task, e.g. information retrieval or question answering [Mani, 2001]. While intrinsic evaluation can involve human accessors who grade summaries and/or comparison between automatic summaries and model summaries. Model summaries are often human-written abstracts. Recently Lin and Hovy [Lin and Hovy, 2003] proposed an intrinsic summary evaluation method called, Recall-Oriented Understudy for Gisting Evaluation (ROUGE). ROUGE uses n-gram statistics to compute usefulness of a automatically generated summary of fixed length by comparing it with gold-standard summaries. In this study we use ROUGE-1 score, i.e. 1-gram matching between automatic summary and model summaries, which is shown to correlate with human judgment [Lin and Hovy, 2003]. High ROUGE score indicates higher relevance of the automatically generated summary and is upper bounded by 1. ROUGE has been used for official evaluation in DUC 2003, DUC 2004 and DUC 2005.
2. PROPOSED METHOD In this section we present our method (codenamed SumGraph). We discuss in detail how the sentence salience scores are calculated and combined. We follow the general framework in Figure 1. In order to get salience of a sentence (step 2 in the framework) we use linear combination of two features extracted from text. The first one is the physical position of a sentence in the text. A sentence at position i gets a score equal to Pi = 1 / i . This score is scaled between 0 and 1. The second feature is the centrality of a sentence in the PFnet. We compare four different centrality scores explained below; • Degree centrality identifies the nodes that reach most of the nodes directly. This measure captures local importance of a node.
4
IADIS International Conference Applied Computing 2007
•
Closeness centrality of a node identifies how easily other nodes can be reached from it. High degree centrality nodes are positioned in the network to quickly diffuse information. This is a global measure. • PageRank [Page et al, 1998] is used by Google for ranking web pages. It uses voting to decide importance of a node in the network while importance of the voters is also considered. It's an iterative algorithm. • Eigenvector centrality takes into account the importance of neighbors of a node in order to compute its importance. Thus a node which is connected many other important nodes gets high importance. This is also a global measure. Centrality score of a sentence at position i is denoted as Ci . This score is also scaled between 0-1. Then this measure is linearly combined with the measure capturing position importance discussed earlier to get the final score Ri of a sentence as follows;
Ri = Wc × Ci + W p × Pi
(1)
where Wc and W p are the weights for centrality score and position score respectively. The sentences are then ranked according to the final scores. Finally, the sentences are successively added to the summary till required size of the summary is met. In the final summary sentences are ordered as they appear in the original text. In the next section we explain in detail the procedure to obtain centrality score using PFnet, followed by short description of PFnet.
2.1 Computation of Sentence Centrality We use the vector space model [Salton et al., 1975] representation of the sentences in a text. Each sentence is converted into a vector of dimensionality equal to the number of distinct words in the text. Porter stemming [Porter, 1980] is used to stem the words reducing dimensionality of the vector space. Each cell in the resulting vector space model contains frequency of occurrence of the particular term in the sentence. We use the well known tf × idf global weighting method, which decreases importance of the terms present in many sentences. Once the vector space model has been constructed cosine similarity is used to compute pairwise similarities between sentences. Those similarity values are then converted into dissimilarities by subtracting them from 1. Resulting dissimilarity matrix can be viewed as a fully connected network with sentences as nodes and dissimilarities as link costs. This network is then scaled using PFnet to obtain conceptual organization of the sentences. If two sentences are connected in a PFnet then they are lexically similar to each other. Thus, the central nodes in the PFnet represent important sentences in the text. This centrality can be measured using several centrality measures (see section 2). As mentioned before we compare three measures and results show that closeness centrality is better than others.
2.2 Pathfinder Networks PFnet were originally developed to model human semantic memory and scaling psychological proximity data [Schvaneveldt, 1990]. PFnet possesses various advantages over other scaling techniques [Chen and Morris, 2003]. Links in a PFnet can be directed (asymmetrical data) or undirected (symmetrical data). Here we consider only undirected links. The process of scaling a network starts with fully connected network and proceeds by removing spurious links. To identify these links, the direct cost between a pair of nodes is compared with alternate paths1 and the direct link is removed from the network if there exists an alternate low cost path. This is known as the triangular inequality criterion in the graph theory literature. The complexity of a PFnet is controlled with two parameters r and q and a particular PFnet is denoted as PFnet(r,q). The r and q metrics are defined below;
1 A path is defined as a sequence of nodes assuming the existence of appropriate links between the nodes
5
ISBN: 978-972-8924-30-0 © 2007 IADIS
•
r-metric is the Minskowski distance measure and increasing it amplifies relative contribution of the larger weights to the path. Parameter r can assume any value from 1 to ∞. • q-metric is the upper limit on the number of links to be considered to calculate alternate paths between a pair of nodes. Parameter q can take values from 2 to n-1, where n is the number of nodes in the network Complexity of a PFnet decreases as either r or q increases. The maximally reduced network is obtained for r=∞ and q=n-1, and is denoted as PFnet(r=∞, q=n-1). PFnet(r=∞, q=n-1) is minimally connected network revealing most salient links, has all minimum cost paths and no triangular inequality violations. In essence the procedure scales a fully connected network using the notion of triangle inequality to uncover the conceptual organization of the data. For details reader is referred to [Schvaneveldt et al., 1988].
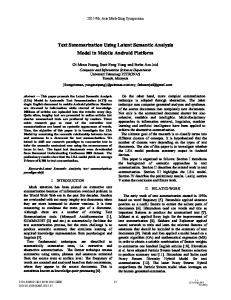
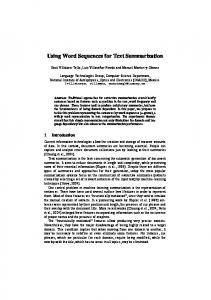
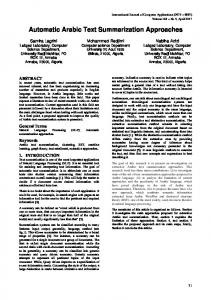
2.3 An Example We take a document, ap880217-0175, from DUC2001 dataset. This document contains 8 sentences; Figure 2 shows the corresponding PFnet and sentence scores. To give an example of link reduction, let’s consider direct link between nodes 5 and 8 which is greater than the cost of the links from node 5 to node 4 and from node 4 to node 8. Thus the direct link between node 5 and node 8 violates the triangular inequality criterion and can be removed from the network. As it can be clearly seen, nodes 4 and 6 are highly connected in the network and thus achieve high closeness centrality scores. The 100 word summary for this document includes sentences 1,2, 4 and 6. ROUGE-1 score for this summary is 0.52389.
a) PFnet(r=∞, q=2)
Sentence Closeness centrality Position score Total score Rank
1 0.4667 1.0000 1.1111 2
2 0.4667 0.7071 0.6580 4
3 0.5000 0.5774 0.5843 5
4 0.7000 0.5000 1.2265 1
5 0.5000 0.4472 0.3830 7
6 0.6364 0.4082 0.8422 3
7 0.5385 0.3780 0.4224 6
8 0.4375 0.3536 0.0000 8
b) Sentence salience scores (closeness and position scores are not normalized), top three are shown in italics Figure 2. a) PFnet(r=∞, q=2) and b) corresponding sentence salience scores for document ap880217-0175 from DUC2001 dataset
6
IADIS International Conference Applied Computing 2007
3. SETTINGS AND EXPERIMENTAL EVALUATION 3.1 Datasets and Evaluation We use newswire data from first two Document Understanding Conference (DUC), DUC2001 and DUC2002. DUC2001 contains 284 documents from test and training sets and DUC2002 contains 516 documents. The task is to produce 100 word summaries. Each document is accompanied by 3 human-written summaries DUC2001 and 2 human-written summaries in DUC20022, which are used as model summaries. We use the ROUGE-1 as the measure of goodness of a automatically generated summary.
3.2 Other Summarization Methods We compare SumGraph with two baselines LEAD and RANDOM, a state-of-art summarizer MEAD [Radev et al., 2001] and a graph based system LexRank [Erkan and Radev, 2004]. The first baseline LEAD takes first n sentences of the source text till required summary size is met. It is well known that LEAD performs quite good on news articles [Brandow et al., 1995]. RANDOM system selects n random sentences from the text to fill the required summary size. MEAD system works in three stages, first stage the feature extractor, extracts features from a document. The second stage combiner combines the extracted features into a single scalar value. The last stage, reranker is designed to obtain better information coverage. MEAD is a well known open source summarizer and more explanation can be found in [Radev et al., 2001]. LexRank [Erkan and Radev, 2004] is a graph-based algorithm that uses thresholded link reduction and random-walks on graphs to compute salience. LexRank placed first in more than one tasks in DUC 2004 evaluation. We use MEAD and LexRank in three different settings; MEAD – uses centroid feature, MEAD+LexRank - uses LexRank feature in conjunction with centroid and LexRank – uses LexRank feature. All of those three settings use position feature.
3.3 Parameters and Settings Sentence length cut-off of 10 is used for all systems, meaning the sentences that contain less than 10 words are discarded. This value was decided empirically on a subset of DUC2001 dataset. For LexRank link reduction threshold of 0.15 is used. We use identity reranker for MEAD and LexRank based systems. A major drawback of PFnet is its polynomial computational complexity. Construction of a PFnet is an iterative process which starts at q=2 and ends at q=n-1, for maximally reduced PFnet (for details see [Schvaneveldt, 1990]). . We define a heuristic as, if there is no reduction in the number of links for 5 consecutive iterations then the iterations are stopped and the resulting network is considered as the maximally reduced network. Moreover, we compared maximally reduced networks for DUC2001 data (defined with the heuristic) with PFnet(r=∞, q=2) networks and observed that almost all of them are identical. So we use q=2 and r=∞ for all experiments. We tried optimizing the weights in Equation 1 (for SumGraph) using a real coded genetic algorithm (GA) [Goldberg, 1989] with elitism. We performed experiments on DUC2001 dataset with the weights constrained between 0 and 1 within two decimal places. Although GA gave a better combination of weights, the improvement was not considerable and we decided to use same weight, equal to 1, for both features.
2 We discard documents in clusters D076 & D098 in DUC2002 as they contain single human-written summary each
7
ISBN: 978-972-8924-30-0 © 2007 IADIS
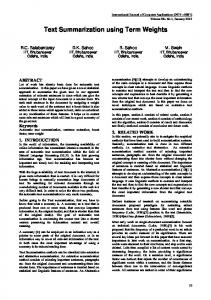
4. RESULTS AND DISCUSSIONS We observed that for SumGraph closeness centrality performs better than other centrality measures mentioned in section 2. Table 1 shows the comparison of the centrality measures on DUC2001 dataset. Closeness centrality is the inverse of the mean geodesic distance between a node and all other nodes reachable from it. Thus a node with high closeness centrality is positioned in the network to quickly diffuse information. Although [Erkan and Radev, 2004] point out that eigenvector centrality is a good measure, we note that the technique used to obtain the reduced graph is different. The following subsection we compare the systems using ROUGE-1 (ROUGE version 1.1.5) score. In the subsequent subsection the systems are compared using win-tie-loss tables and a non-parametric statistical test. Table 1. Comparison of centrality measures on DUC2001 dataset
Centrality measure Closeness Eigenvector Degree PageRank
ROUGE-1 score 0.4544 0.4539 0.4526 0.4506
4.1 System Performance ROUGE-1 score was computed by comparing automatically generated summaries against the model summaries. For RANDOM system we conducted five independent experiments and the mean value is mentioned. As can be seen from Table 2 SumGraph consistently performs better than the other methods. Besides, for DUC2001 dataset LexRank performs better than MEAD and MEAD+LexRank. For DUC2002 data surprisingly LexRank does not perform better. RANDOM is the worst system, as expected. Table 2. Comparison of ROUGE-1 scores, we do not show confidence level for the RANDOM system a) DUC2001 dataset
Method
ROUGE1
SumGraph LexRank MEAD MEAD+LexRank LEAD RANDOM
0.45435 0.45064 0.44773 0.44677 0.44391 0.39016
b) DUC2002 dataset
95% confidence interval 0.44403-0.46388 0.44012-0.46076 0.43685-0.45858 0.43640-0.45693 0.43348-0.45436 --
Method
ROUGE1
SumGraph MEAD MEAD+LexRank LEAD LexRank RANDOM
0.48415 0.47293 0.47166 0.47133 0.46988 0.41865
95% confidence interval 0.47682-0.49201 0.46534-0.48011 0.46407-0.47932 0.46351-0.47928 0.46266-0.47713 --
4.2 Detailed Comparison To get better understanding of the systems (excluding RANDOM) we compare them using win-tie-loss tables. In a win-tie-loss table two systems A and B are compared along three dimensions, 1. win, which indicates how many times the system A beats the system B, 2. tie, indicating how many times both systems perform equally and 3. loss, shows how many times system A looses to system B. Table 3. Win-tie-loss table and p-values of Wilcoxon test with LEAD as the reference system a) DUC2002 dataset
a) DUC2001 dataset
System SumGraph LexRank MEAD+LexRank MEAD
8
Win 158 150 147 124
Tie 27 13 14 27
Loss p-value 99 0.000 121 0.075 123 0.248 133 0.508
System Win SumGraph 284 MEAD+LexRank 264 MEAD 260 LexRank 244
Tie 48 13 42 24
Loss p-value 184 0.000 239 0.433 214 0.220 248 0.987
IADIS International Conference Applied Computing 2007
We compare the systems with LEAD, i.e. we keep LEAD as system B and as system A we use one of the rest systems, results are shown in Table 3. Table 3 shows win-tie-loss table with LEAD as the reference system. From Table 2, it is very clear that SumGraph performs better that all others along all the three dimensions. Neither MEAD not LexRank show consistent performance. Similar results were obtained when compared with other systems indicating SumGraph is the best system in the current context. To access the similarity (or difference) between the methods we used Wilcoxon signed rank test, which is a non-parametric test for related samples. The null hypothesis is that the two systems compared are the same. According to the statistics at 95% confidence level, SumGraph is statistically different (rejecting the null hypothesis with p-value less than 0.05) than all other systems except for DUC2001 dataset it is similar to LexRank (which is second best) with p-value 0.237. MEAD, LexRank and MEAD+LexRank systems are not statistically different than LEAD summarizer on both datasets. They are also similar to each other.
4.3 Use of Latent Semantic Analysis LSA [Deerwester et al., 1990] is a corpus based statistical technique to uncover the semantic relationships between words. LSA handles synonymy and polysemy by considering word co-occurrence (word context) statistics. LSA places the words and documents that are closely related semantically near each other, i.e. the documents are placed closer even though they don’t implicitly contain the same words. LSA takes termdocument (here term-sentence) matrix as input and a information-spreading technique known as Singular Value Decomposition (SVD) is applied to the matrix. SVD finds the dimensions which close to each other based on co-occurrence and then compresses them onto one composite dimension. We investigated the question, whether using LSA can improve performance of our system? It should be noted that we do not use LSA for indexing but rather embed LSA into our existing method SumGraph as an intermediate stage, before calculating sentence similarity. One very important question associated with LSA is what should be the reduced dimension? We performed experiments on DUC2001 dataset by varying percentage of variance retained. Results show that system performance improves with increasing variance retained. Retaining 95% variance was the best option attaining ROUGE-1 score of 0.453 with 95% confidence interval [0.4437 – 0.4627]. Results show that LSA gives no added advantage, at least in terms of ROUGE-1 score, however it performs better than other systems. We did not perform experiments on DUC2002 dataset using LSA. The inability of LSA to improve performance can be attributed to the lack of data due to small document sizes.
5. CONCLUSIONS AND FUTURE WORK In this work we presented a graph-theory based extractive text summarization algorithm for a single document, called SumGraph. SumGraph is based on conceptually sound systematic link reduction algorithm called Pathfinder Network Scaling (PFnet). PFnet reveals conceptual organization of the sentences which is then used to assess salience of sentences using a centrality measure. Amongst the four compared centrality measures; closeness, degree, pagerank and eigenvector, closeness centrality performed better than the others. Nodes with high closeness centrality score are positioned in the network to quickly diffuse information. SumGraph consistently outperforms the other systems when compared using ROUGE-1 score. Performance of either MEAD or LexRank was not consistent. Statistical analysis shows that SumGraph is different than the baseline system LEAD, while the other systems are similar to LEAD. Moreover, we investigated the issue of using LSA and LSA did not show any improvement. As future research in this area we intend to evaluate our system for longer summaries. Extension to multidocument summarization is another potential direction. There are some unexplored areas like how the use of co-reference resolution affects the resulting summary. Currently we are working on producing cohesive summaries. It will be interesting to study if LSA plays any role in obtaining such summaries.
9
ISBN: 978-972-8924-30-0 © 2007 IADIS
ACKNOWLEDGEMENT The Portuguese Pluri-annual support provided by FCT and funding under the FCT project SUMO is gratefully acknowledged. Authors are thankful to Dragomir Radev (Uni. of Michigan, USA) for MEAD toolkit. KP would like to thank Kiran Patil (DTU, Denmark) and Pedro Campos (LIACC/FEP, Uni. of Porto, Portugal) for various fruitful discussions.
REFERENCES Aone, C., Okurowski, M.E., Gorlinsky, J., and Larsen, B., 1997. A Scalable Summarization System Using Robust NLP, Proceeding of the ACL'97/EACL'97 Workshop on Intelligent Scalable Text Summarization, pp. 66-73. Brandow, R., Mitze, K., and Rau, L.F., 1995. Automatic condensation of electronic publications by sentence selection. Information Processing and Management, 31(5), pp. 675-685. Chen, C. and Morris, S., 2003. Visualizing Evolving Networks: Minimum Spanning Trees versus Pathfinder Networks. INFOVIS. Chuang, W. T., and Yang, J., 2000. Extracting sentence segments for text summarization: A machine learning approach. In Proceedings of the 23rd ACM SIGIR, pp. 152-159. Deerwester, S., Dumais, S.T., Furna, G.W., et al., 1990. Indexing by Latent Semantic Analysis. Journal of the American Society for Information Science. Edmundson, H. P., 1969. New methods in automatic abstracting, Journal of Association for Computing Machinery, 16(2), pp. 264-285. Erkan G., and Radev, D. R., 2004. LexRank: Graph-based Lexical Centrality as Salience in Text Summarization. J. Artif. Intell. Res. (JAIR), 22, pp. 457-479. Goldberg, David E., 1989. Genetic Algorithms in Search, Optimization and Machine Learning. Addison-Wesley Pub. Co. Kupiec, J., Pedersen, J. O., and Chen, F., 1995. A trainable document summarizer. In Research and Development in Information Retrieval, pp. 68–73. Landauer, T.K., and Dumais, S.T., 1997. A solution to Plato's problem: The latent semantic analysis theory of the acquisition, induction, and representation of knowledge. Psychological Review, 104, pp. 211-240. Lin., C.Y., and Hovy, E., 2003. Automatic evaluation of summaries using n-gram co-ocuurrence. In Proceedings of 2003 Language Technology Conference (HLT-NAACL 2003), Edmonton, Canada, May 27 – June 1. Luhn, H.P., 1958. Automatic creation of literature abstracts. IBM Journal of Research and Development, 2(2), pp. 159165. Mani, I., 2001. Summarization evaluation: An overview. In proceedings of the NAACL 2001 workshop on Automatic Summarization,. Mani, I., and Maybury, M.T., 1999. Advances in automatic text summarization. MIT Press. Mihalcea, R., 2004. Graph-based Ranking Algorithms for Sentence Extraction, Applied to Text Summarization. In Proceedings of the 42nd Annual Meeting of the ACL, companion volume (ACL 2004), Barcelona, Spain. Porter , M., 1980. An algorithm for suffix stripping. Program, 14(3), pp. 130-137. Page, L., Brin, S., Motwani, R., and Winograd, T., The pagerank citation ranking: Bringing order into web, Technical report, Stanford University, Stanford, CA, 1998. Radev, D., Blair-Goldstein, S., and Zang, Z., 2001. Experiments in single and multi-document summarization using MEAD. In first Document Understanding Conference, New Orleans, LA. Salton, G., Wong, A., and Yang, C., 1975. A vector space model for automatic indexing. Communications of the ACM, 18, pp. 613-620. Salton, G., Singhal, A., Mitra, M., and Buckley, C., 1997. Automatic text structuring and summarization. Information processing & management, 33(2), pp. 193-207. Schvaneveldt, R. (Ed.), 1990. Pathfinder Associative Networks: Studies in Knowledge Organization. Norwood, NJ, Ablex. Schvaneveldt, R. W., Dearholt, D. W., & Durso, F. T., 1988. Graph theoretic foundations of Pathfinder networks. Computers and Mathematics with Applications, 15, pp. 337-345. Spark-Jones, K. and J. R. Galliers. 1995. Evaluating Natural Language Processing Systems: An Analysis and Review. In Lecture Notes in Artificial Intelligence, Springer.
10