shows the effect of noise and signal distortions, especially with applications of ... transform and Sinusoidal Histogram in testing AC and DC performance [5-9].
International Journal of Computer Science & Information Technology (IJCSIT) Vol 5, No 5, October 2013
THE APPLICATION WAVELET TRANSFORM ALGORITHM IN TESTING ADC EFFECTIVE NUMBER OF BITS Emad A. Awada Department of Electrical and Computer Engineering, Applied Science University, Amman, Jordan
ABSTRACT In evaluating Analog to Digital Convertors, many parameters are checked for performance and error rate. One of these parameters is the device Effective Number of Bits. In classical testing of Effective Number of Bits, testing is based on signal to noise components ratio (SNR), whose coefficients are driven via frequency domain (Fourier Transform) of ADC’s output signal. Such a technique is extremely sensitive to noise and require large number of data samples. That is, longer and more complex testing process as the device under test increases in resolutions. Meanwhile, a new time – frequency domain approach (known as Wavelet transform) is proposed to measure and analyze Analog-to-Digital Converters parameter of Effective Number of Bits with less complexity and fewer data samples. In this work, the algorithm of Wavelet transform was used to estimate worst case Effective Number of Bits and compare the new testing results with classical testing methods. Such an algorithm, Wavelet transform, have shown DSP testing process improvement in terms of time and computations complexity based on its special properties of multi-resolutions.
KEYWORDS Discrete Wavelet Transforms (DWT), Analog-to-Digital Converters (ADCs), Effective Number of Bits (ENOB).
INTRODUCTION The ability of transferring data information from analog into digital domain and vise versa is highly desired [1] and needed. Therefore, in choosing the right data acquisition board, conversion accuracy can be one of the most important factors. For proper system performance and digitizing accuracy, output digitized data need to be as close to the analog input signal. At most basic level, digitizer testing would seem simple matter; however, testing is extremely expensive, and time consuming as in [2-5] for both static and dynamic parameter characterizations. Dynamic parameters, based on Fast Fourier Transform (FFT), provide specific information that shows the effect of noise and signal distortions, especially with applications of high-frequency signals. Therefore, depending on the quality of digitizer and the continuous switching of signals between multiple channels, dynamic parameters such as Effective Number of Bits (ENOB) can drop noticeably. For example, a 16-bit ADC’s can drop to 12-bit or even more, which drop the accuracy of system performance as a result. Therefore, ENOB measurements can be one of the major dynamic error characteristics of any digitizer board, but this measurement can be lengthy DOI : 10.5121/ijcsit.2013.5512
161
International Journal of Computer Science & Information Technology (IJCSIT) Vol 5, No 5, October 2013
and complicated due to the large number of data samples acquired and the fact that it is heavily based on errors caused by noise (SNR). Significant research has been done to improve testing techniques of Analog to Digital Convertors (ADC’s) parameters. For instance, some focused on improving classical methods such as Fourier transform and Sinusoidal Histogram in testing AC and DC performance [5-9]. While Fourier Transform is based on additive noise model and requires a large number of data samples [2], histogram testing has most samples occur near the ends of histogram (large number of samples must be collected to increase the height of bins around the center) [1,4]. In this paper, Wavelet based testing algorithms is proposed for evaluating an ADC’s performance in term of instantaneous ENOB. With the focus on shortening testing process, reducing sample size, simplifying testing complexity and improving ENOB estimation for higher ADCs resolutions, Wavelet computation efficient was very suitable for this application in contrast to the mean value measured by the conventional methods [2,4,10].
EFFECTIVE NUMBER OF BITS (ENOB) The conventional method of testing ADC’s effective bits is based on the ratio of the fundamental signal to the sum of all distortion and noise products in the output signal, after the DC term is removed. Therefore, in testing for ENOB, clean analog sine-wave was used as stimulus input, since perhaps it is the most popular method of evaluating ADC [11]. For an ideal ADC’s output, signal (data) transformed into frequency domain will result in one spectral component. In real ADC’s operation, quantization errors which cause nonlinearity effect on ADC’s transfer function results into spectral frequencies other than the input frequency being tested. Quantization errors caused by IC internal or external noise [1,4] appear as random noise spread across the frequency spectrum of FFT, distort the conversion process, and result in harmonic distortions [10] and higher noise floor. The relation between nonlinearity, harmonics, and noise floor are used to address ADC’s ENOB and SNR. Effective resolution of ADC’s is one part in 2n (n is the ADC number of bits). For an ideal 12 bits ADC, 4096 unique digital codes are produced and the effective resolution is one part in 4096 codes as given by, [1,3],
1 dB 20 Log n 2
(1)
ENOB can be expressed in term of SNR as
SNR ( ENOB) 6.02) 1.76 dB
(2)
By relating the noise ratio to ENOB and rearranging (2), ENOB can be expressed as
ENOB
SNR[ db] 1.76 6.02
(3)
This method of estimating ENOB is extremely sensitive to errors caused by noise [1,2] and requires a large number of samples. Therefore, the new proposed method of WT based testing can be especially suited for ENOB estimations with fewer samples.
162
International Journal of Computer Science & Information Technology (IJCSIT) Vol 5, No 5, October 2013
In the next section, a brief description of the Discrete Wavelet Transform (DWT) illustrates the function and advantage of using DWT.
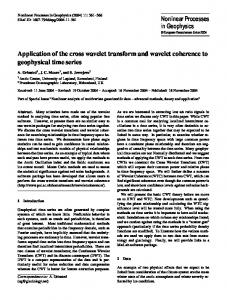
DISCRETE WAVELET TRANSFORM The objective of signal transformation is to have a different representation of a signal with no changes to the signal information. The Fourier transform, which is based on summation series of sine and cosine waves, expresses signals in the frequency domain to determine frequencies in the signal with no time representations. Meanwhile, in Wavelet transform, the objective is to achieve a localized space frequency with the ability to determine the position of frequency components [12-14]. Wavelet transforms have been used in various fields of signal processing [10,12,17] due to the functionality of multi-resolutions that allow pinpointing of signal components. With special properties of dilation and translation [4,10,13], wavelets can create different scaled and shifted functions of signal transformation. In other words, unlike the Fourier transform, wavelet transform capability of dilation and translation allow the shift of a signal in the time domain (X axis), rescaling (to expand or compress a signal on Y axis) and produces flexible windows for analysis as shown in figure 1. Scale
Time
Figure 1: Wavelet Windowing Signal Analysis at Different Frequencies
Large scaling, provide most information of the signal (the big picture), meanwhile, small scales wavelet shows signal details by zooming into the signal components. To better understand wavelets, the continuous wavelet transform (CWT) will be looked at first. In [16], wavelet (Ψ) is a function of zero average as, i.e.
(t )dt 0
(4)
where (Ψ) is base function known as mother wavelet used to drive wavelet transformation function through dilation (s) and translation (u) as
u ,s (t )
1 t u s s
(5)
163
International Journal of Computer Science & Information Technology (IJCSIT) Vol 5, No 5, October 2013
And since Wavelet merely performs a convolution operation with a given signal, Wavelet transform of continuous signal x (t) can be illustrated as
Wx(u, s ) X (t )
1 t u * s s
(6)
However, in this work of analyzing digital (discrete) signal, Discrete Wavelet Transform (DWT) was used for faster computation based on predetermined low and high-pass filters for a particular Wavelet function in most cases. That is, ADC output signal was analyzed first by filter banks of high-pass and low-pass to down-sampled by factor of 2 (decimation) in each scale [10,12,13,15,17] as shown in figure 2. Low-pass filter coefficient produces approximation signal information, while the high-pass filter coefficient produces detail information.
S
h g
h
d
g
a
Figure 2: Wavelet multilevel decomposition
By applying filtering and decimation factors of 2 at each decomposition level, frequency characterizations are passed and number of samples rate is reduced by half (half the frequency band). Starting with the largest scale (the original signal), bandwidth becomes a multiple of half at the high and low-pass filters.
WAVELET-BASED ESTIMATION FOR ENOB In this work, DWT was implemented to test high-speed ADC. Theoretically, by applying clean perfect sine wave, stimulus signal parameters such as (amplitude, frequency, phase, dc offset, etc) can be determined [11] and the deviation of the ADC output signal from the ideal input signal is an effect of ADC performance. For an ideal ADC, the deviation is negligible (zero). However, realistic ADC performance produce quantization error that distort the output signal X [n] as
X [ n] X [ n] q
(7)
where X [ n ] original value and q is quantization error. From equation (7), the output signal is the summation of both input signal and quantization error. Quantization is directly related to ADC’s number of bits through quantization step size ( ) that
164
International Journal of Computer Science & Information Technology (IJCSIT) Vol 5, No 5, October 2013
determine the distance between adjacent codes. The step size expresses the size of bin code and can be determined as
Voltage[2n 1] Voltage[0] FSR n LSB 2n 1 2 1
(8)
where n is ADC number of bits, FSR is ADC full scale voltage, and n is ADC number of bits. By capturing ADC output data X [n] and Appling DWT algorithms, using multi-resolution techniques, a combination of instantaneous low frequency (approximation coefficients an ) and high frequency (detail coefficients d n ). Data from the high-pass filter, detail coefficients were obtained as (9)
(dn1,1dn1,0 , dn1,1 , dn1,2 , dn1,3 , dn1,4 , dn1,5 , dn1,6 , dn1,7 ,)
then down sampled by 2 (by taking the odd values as shown in 12) to end with half of the original data, i.e. (10)
(dn1,1, dn1,1 , dn1,3 , dn1,5 , dn1,7 ,)
In [2], the largest components of DWT high-pass coefficient at scale 1 defines the Dynamic Range (DR) that is used to estimate worst case ENOB. DR can be defined as 1 1 DR 20 log 10 20 log 10 Bˆ 0.5 dB . 2 2 2
(11)
where B is the Effective Number Of Bits ENOB, and Quantization step size. By rearranging equation (11), worst case instantaneous ENOB can be directly estimated as [2].
Bˆ
DR 0.5 bit 20log10 (2)
(12)
Simulation and Measurements In addition to the actual lab testing using DWT algorithms for worst case ENOB, MATLAB simulation was implemented to verify the actual testing results. With no extraneous noise, ADCs (range from 10 bits to 18 bits) were tested based on FFT and DWT algorithms. Results are shown in Tables 1 and 2 for both ideal and non-ideal performance testing. Table 1. ENOB estimation (conventional method Vs. Wavelet) based on no extraneous noise simulation.
DWT/FFT Haar db4 db10 Coif1 FFT
10 Bits ADC 10.14 10.17 10.11 9.78 9.97
12 Bits ADC 12.16 11.92 12.01 12.07 11.84
14 Bits ADC 14.27 13.97 14.06 14.03 14.09
16 Bits ADC 16.1 16.02 16.07 15.72 15.89
18 Bits ADC 18.34 17.8 18.06 18.2 17.97 165
International Journal of Computer Science & Information Technology (IJCSIT) Vol 5, No 5, October 2013
Figure 3. ENOB estimation with no extraneous noise (Table 1). Table 2. ENOB testing results (conventional method Vs. Wavelet) based on extraneous noise simulation.
DWT/FFT Haar db4 db10 coif1 FFT
10 Bits ADC 9.4 9.3 8.7 9.14 8.5
12 Bits ADC 11.5 11.1 10.72 11.21 10.38
14 Bits ADC 13.3 13.5 12.68 12.96 11.35
16 Bits ADC 15.1 15.7 14.84 15.16 12.55
18 Bits ADC 16.4 17.81 16.6 17.45 13.8
Figure 4. ENOB estimation with extraneous noise (Table 2).
Actual Testing Setup and Measurements Sets of ADCs testing boards (10-18 Bits) were used to verify the new testing algorithms. Actual ADCs output data were transformed and analyzed by FFT and DWT (such as Haar, db4, db10, 166
International Journal of Computer Science & Information Technology (IJCSIT) Vol 5, No 5, October 2013
and Coief1) algorithms. A summary of ENOB testing results are given in Tables 3 and 4 for sampling frequency 50 MHz and 100 MHz. Table (3): ENOB estimation (conventional method Vs. Wavelet) at 50 MHz sampling frequency.
DWT/FFT Haar db4 db10 coif1 FFT
10 Bits ADC 9.3 10.56 10.29 9.87 9.31
12 Bits ADC 12.44 11.56 11.91 11.89 10.57
14 Bits ADC 14.2 14.24 13.57 13.48 11.51
16 Bits ADC 15.9 16.97 15.19 15.22 12.36
18 Bits ADC 17.6 19.53 16.91 17.10 13.62
Figure (5): ENOB estimation at 50 MHz sampling frequency (Table 3). Table (4): ENOB estimation (conventional method Vs. Wavelet) at 100 MHz sampling frequency.
DWT/FFT Haar db4 db10 coif1 FFT
10 Bits ADC 10.57 10.6 10.1 9.93 9.27
12 Bits ADC 12.14 11.95 11.93 11.88 10.31
14 Bits ADC 14.25 14.1 13.6 13.8 11.4
16 Bits ADC 16.28 16.34 15.81 15.68 12.26
18 Bits ADC 18.11 18.31 16.89 17.71 13.51
167
International Journal of Computer Science & Information Technology (IJCSIT) Vol 5, No 5, October 2013
Figure (6): ENOB estimation at 100 MHz sampling frequency (Table 4).
As illustrated in Figures 4-6, FFT tend to overestimate ENOB especially as ADCs number of bits increases. FFT test depend on noise summation (average) to all noises including quantization noise and very small noises [2,17]. This fact has higher effect on higher bits ADCs since quantization levels get smaller and any detection of noise offset ENOB estimation. Meanwhile, DWT tend to localize into ADCs output data as a result of multi-resolution property. This property allows obtaining the dynamic range of the output signal without noise summation.
CONCLUSION By implementing Wavelet transform to analyze ENOB, testing results of several types of Wavelets were used and compared with each other and conventional methods such as FFT for better illustration. As a result, it was clearly observed that classical testing of FFT sums all noises (large and small) over many sample point. Such a fact influence ENOB testing results as ADCs number of bits increase, quantization step sizes decrease, and quantization noise averaged. Meanwhile, DWT have provided well localized measurements of signal components, and estimate ENOB based on the localized signal dynamic range. DWT were successful in measuring ADCs performance without averaging noises and therefor; testing cost, duration, and complexity can be reduced based on fewer computed samples. In addition, higher accuracy of ENOB estimation, especially for higher bits ADCs was noticed, which can lead for better DSP testing algorithms and built in self-test ADC parameters.
ACKNOWLEDGEMENTS The authors are grateful to Applied Science University (ASU), Amman - Jordan, for the financial support grated to cover the publication fee of this paper research articles.
168
International Journal of Computer Science & Information Technology (IJCSIT) Vol 5, No 5, October 2013
REFERENCES [1] [2] [3] [4] [5] [6] [7] [8] [9] [10] [11] [12] [13] [14]
[15] [16] [17]
M. Burns and G. W. Roberts, An Introduction to Mixed-Signal IC Test and Measurement (New York, NY: Oxford University Press, 2004). T. Yamaguchi; M. Soma, Dynamic testing of ADCs using wavelet transform, IEEE International Test Conference, 1997, 379-388. Mark Baker, Demystifying mixed signal test methods (Burlington, MA: Newnes-Elsevier Science, 2003). C. Akujuobi, E. Awada, M. Sadiku & A. Warsame, Wavelet-based differential nonlinearity testing of mixed signal system ADCs, IEEE Southeast Conference, 2007, 76 – 81. C. A. Serra & M.F. DaSilva, Combined spectral and histogram analysis for fast ADC testing, IEEE Transactions on Instrumentation and Measurement, 2005, 1617-1623. S. Cherubal & A. Chatterjee, Optimal linearity testing of analog-to-digital converters using a linear model, IEEE Transactions on Circuits and Systems I: Fundamental Theory and Applications, 2003, 317 – 327. F. Xu, A new approach for the nonlinearity test of ADCs / DACs and its application for BIST, IEEE workshop, 1999, 34 – 38. Wen-Ta Lee & Yi-Zhen Lia, A high precision ramp generator for low cost ADC test, IEEE Conf. on , 2103 – 2106. M. Wagdy & S. Awad, Determining ADC effective number of bits via histogram testing” IEEE Transaction on Instrumentation and Measurement, 1991, 770 – 772. E. Awada & M. Alomari, Application of Wavelet Transform Analysis to ADCs Harmonics Distortion, Computer and Information Science, Vol. 6, 2013, 118-124. I. Kollar & J. Blair, Improved determination of the best fitting sine wave in ADC testing, IEEE Transactions on Instrumentation and Measurement, 2005, 1978 – 1983. O. Riouel & M. Vetterli, Wavelet and signal processing, IEEE SP Mag, 1991,14-38. B. Silverman, Wavelet: The key to intermittent information (New York, NY: Oxford University Press, 2000). J. Oliver, R. Shantha Selva Kumari, & V. Sadasivam, Wavelets for improving spectral efficiency in a digital communication system, Computational Intelligence and Multimedia Applications, 2005, 198 – 203. E. Awada C. Akujuobi & M. Sadiku, A Reduced-Code Linearity Test for DAC Using Wavelet Analysis, International Journal of Engineering Research & Innovation, Vol.1, 2010, 69-76. Stephane G. Mallat, Wavelet tour of signal processing (United Kingdom, UK: Academic Press, 1999). E. Awada & C. Akuuobi, DWT Testing of DAC Effective Number of Bits, Proceedings of the IASTED International Conference Circuit and System, 2010, 145-150.
Author Emad Awada is an Assistance Professor at Applied Science University in Amman Jordan. His research interests are in the areas of Mixed Signals Systems, Signal and Image Processing, Broadband / Communication Systems, and Power Systems. He received B.S. degree in electrical engineering from Prairie View University, Prairie View, TX. in 1998. He received M.S. degree and Ph.D in electrical engineering from Prairie View University in 2006 and 2011 respectively.
.
169