design, Assembly Line Design, automation. I. INTRODUCTION. Assembly process plays a key role in production systems. The improvement and optimization of ...
The automation of an assembly system: a business process re-engineering (BPR) perspective (presented at the 6th IESM Conference, October 2015, Seville, Spain) © I4e2 2015 Maurizio Bevilacqua, Filippo Emanuele Ciarapica, Ilaria De Sanctis, Giovanni Mazzuto, Claudia Paciarotti DIISM Università Politecnica delle Marche Ancona, Italy {m.bevilacqua, f.ciarapica, i.desanctis, g.mazzuto, c.paciarotti}@univpm.it Abstract—The purpose of this paper is to automate a manual assembly line following a structured framework, in a motorcyclist industry. Process re-engineering is implemented in order to improve and automate the assembly process of a manufacturing company. The transition from the manual process to the new semi-automated assembly line is composed of 4 main steps: the as-is analysis, the Process reengineering and layout design, the training and finally the mass production. The study has shown that the line automation yields significant improvements: sizeable increase of the workstations saturation, better cohesion with Just in Time principles, reduction of the employed working force, and increase of the quality control process rigor.The scope of the study was limited to one of the firm assembly line. In future, the company plans to perform similar studies on the other lines.This investigation shows significant benefit associated with a structured implementation automation in the field of assembly process. The findings will mainly be relevant for process and logistics managers involved in the planning of a new assembly line or in the redesign of an existing one.This paper provides an original case study of as-is analysis, re-design, training and testing of an improved assembly line. Keywords—Assembly systems, process re-engineering, layout design, Assembly Line Design, automation.
I.
INTRODUCTION
Assembly process plays a key role in production systems. The improvement and optimization of the assembly process is vital to manufacturing competitiveness [1]: about 50% of the product cost should be ascribed to the assembly phase [2]. The increasing degree of automation in industrial facilities is a modern trends in manufacturing. The current trend to assembly automation is evident in both the planning of new assembly line and the redesign of an existing one [3]. Automation is defined as the performance of tasks by machines rather than human operators [4]. Automation results in reduction of operator workload, errors and labour costs [4]; [6]. Under low uncertainty environment, manufacturing system automation has significant positive impact on manufacturing performance [7]. Reference [8] detected nine reasons for automating: Increase labour productivity, Reduce labour cost, Mitigate the effects of labour shortages, Reduce or eliminate routine manual or clerical tasks, Improve worker safety, Improve product quality, Reduce manufacturing lead time, Accomplish processes that cannot be done manually, Avoid
the high cost of not automating. On the other hand, process consciousness may decrease under high automated environment [9] and high level of automation means to loss the flexibility of human operators [10] The automation as competitiveness source also attracted the attention of national government policy. The role of government in promoting the automation adoption should be an effective and can lead to tangible benefits. As instance, the Industrial Development Bureau (IDB) of the Ministry of Economic Affairs in Taiwan has been promoting the program “Manufacturing Automation Promotion Policy (MAPP)” for more than 10 years [11]. The identification of the proper level of automation for best system performance results from a balanced and holistic approach to automation [12]. Decision about the level of automation is not a planned and structured activity and there are not support decision systems to adopts, on the contrary it is mainly an ad hoc nature activity [13] [14]. Frequently, it is possible to notice a lack of strategy formulation and little use of methods to design, introduce and evaluate automation projects [15] [16]. More, the assembly line design is often complex due to the high number of variablesinvolved such as line efficiency, cost, reliability and space [17] [18]. This context leads us to follow a structured approach to the assembly re-design shown in this paper. The adopted methodological approach is described in Section 2. In section 3 the case study is illustrated in detail with a specific attention to each of the four step implemented. Then, in section 4 the results are reported, taking into account both quantitative and qualitative aspects. Section 5 presents conclusions summarizing the information presented. II.
METHODOLOGICAL APPROACH
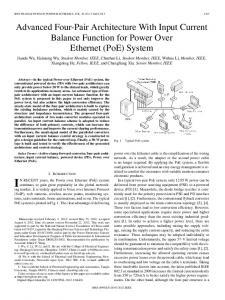
This redesign was done using the approach illustrated in Figure 1.The transition from the manual circular process to the new semi-automated linear assembly line is composed of 4 main steps: the as-is analysis, the Process reengineering and layout design, the training and finally the mass production. The project schedule is reported in a Gantt chart (Figure 2).
Fig. 1. Re-design phases.
AS-‐IS ANALYSIS
Fig. 3. Workstation datasheet.
PROCESS REENGINEERING AND LAYOUT DESIGN
OPERATORS TRAINING
MASS PRODUCTION
The first step of the analysis is the as- is analysis, where the current state of the business process in the organization has been analysed. Three instruments were used to collect information pertaining to the as-is assembly process: the collection of technical data from available document analysis, the on field observation and the exchanges of view with the operators, and the operations simulation on a test bench. The period duration of this first step is 20 days. The second step, as reported in Figure 1, is the Process and layout redesign, where the existing assembly processes have been mapped and then reorganized in order to optimize the operational efficiency, to reduce Wastes (Muda), Unevenness or irregularity (Mura) and Overburden of people and machines (Muri). Following the Process and layout redesign, the third step of the methodology is the operator training. In order to consider the three learning ways, as suggested in [19], direct experience, verbal transmission of information and the reorganizing of what employees already know into a new configuration have been included in the operator training. Even if the training phase duration is 5 days, great importance is given to the operators’ involvement and education in all the re-engineering phases. Indeed human resources are the key factors for the organizational success. Reference [20] accounted even the human resource as the organization unique competitive advantage and its main capital. The last step of the methodology is the Mass production where the new production process is observed and analysed in order to quantitatively evaluate the obtained improvement. The duration of this phase is 20 days, as reported in the Gant chart on figure 2. III.
CASE STUDY
The research presented in this paper is based on a case study at an Italian manufacturing company producing motorcycle. Due to the non-disclosure agreement between the organization and the authors, some information concerning to the organization, included the whole layout map, cannot be exposed in detail. However, the data collected is reported accurately and are in no way changed. A. The as-is analysis The Project started with an analysis of the initial situation in order to create a good starting point for our redesign. This section addresses the existing assembly procedures for seat rail production and the initial layout. Fig. 2. Gantt chart.
The analysis is composed of the 3 main following steps: 1.
Technical data collection (e.g. workstation datasheet and drawings);
2.
On field observation and data collection;
3.
Operations simulation on a test bench.
The technical data collection of the assembly process is obtained by the examination of the workstation datasheets associated at each workstation. These documents contain a synthetic description of the operation to be performed in the workstation, the components required and the illustrations of the operations. A exemplifying version of the workstation datasheet is provided in Figure 3. But, the first step of the analysis is not enough by itself to perform an deep analysis of the existing situation, and it should lead to a wrong and inaccurate assessment. Therefore the direct observation became a basic step for an accurate analysis. The on field analysis is composed by both the working observation and the involvement of workers. The cooperative relationship with the operators is primary; the worker know how is the basis of the continuous improvement and for this reason the opinion on current critical situation and possible improvement is a crucial part of the initial analysis. Finally, as a third step, in order to have the whole description of the as-is state, on a test bench tests have been developed. Indeed, features that should be neglected in the previousstagesshould appear by directly simulating the assembly operation on a test bench. Fig. 4. First layout of linear line.
A so structured analysis of the existing assembly line provided a complete overview of the real processes currently performed. The initial seat rail assembly layout is shown in Figure 4. The seat rail assembly was performed on a manual carousel equipped with four jig. The jigs are able to rotate around the main axis and are equipped with a lock plate. Furthermore, in order to allow and facilitate the operations, the jigs can also rotate around its own axis. All the locking operations and rotations are managed manually. The assembly line is a multimodel one: it produces two seat rail models: model VR1 and VR2 model. The seat rail assembly is split between the five working stations WS1, WS2, WS3, WS4 and WS5; where WS1 and WS2 are used exclusively for the assembly of VR2, while the other workstation are used for both the versions. 3 and 5 workers are required for the VR1 and VR2 models assembly respectively. Each working station has its dedicated supply area and two additional trays located in the centre of the carousel holding down the small components (e.g. rubber washer, screws, nuts). B. Process reengineering and layout design Starting from this preliminary analysis performed in order to well understand the starting point and the tasks necessary to complete the assembly process, the transition from the circular to the linear assembly process can be planned in detail. At first the jig is redesigned basing on the list of requisites emerged from the analysis of the in use jig, and the operators evaluation and suggestions. The new jig shows an increase in the movement degree and an improvement for the lock plates. Furthermore, the definition of the new plant layout, was made with the following objectives: −
Muda (Waste): activities;
Eliminatingnon-value-adding
−
Mura (Unevenness or irregularity): Eliminating unevenness or irregularities in the production process;
−
Muri (Overburden): Eliminating overburden assembly process.
− Fig. 5. Original layout: A central carosel with 4 workstations (WS1-WS2WS3-WS4). Around the 4 workstations there are the working station stores and the fifth (WS5).
Fig. 6. MURA analysis.
In order to obtain the previous objectives the following features were considered: space optimization; ergonomics and operator safety; operator movements minimization and line supply simplification and improvement. Two expert technicianscollected data, through the repetition of each task more than once for each model, for both assembly and controlling operations. The aim of this phase is reducing Muda and Mura and balancing workloads on the assembly line. Infigure 6 results of the time data collection for each activity belonging to a work station have been reported. In particular the mean time and the standard deviation of the data collected have beenrepresented. The main causes of an high standard deviation could be founded in the lack of operative standards, non-compliance of the operative standards, lack of appropriate tools, lack of ergonomics in the workplace. So, taking in account the precedence relationships, the tasks are grouped in order to increase the working station saturation level and reduce wastes. Six operations were assigned to another under saturated assembly line equipped with the necessary facilities so as reducing unevenness and irregularities in the production process. Due to the stability of the product market, the assembly line balancing phase is carried out considering a fixed demand with low uncertainty level.
Fig. 7. MURI Results with the first layout in WS4.
Fig. 8. Detail of operator working position.
But a problem to face, passing from a circular to a linear system, is to define the working side for each task. In fact, during the production process, the operator cannot pass from one side of the line to the other one. So the working side need to be defined for each task. These physical constraintscaused, during the on field simulation, some operative difficulties: the fall of some components and safety problems due to lack of ergonomic conditions. The ergonomic condition for each workstation has been evaluated through a MURI sheet (Appendix 1). In particular each activity has been split in elementary operations and after, each operation has been evaluated in terms of dangers of movements. The flexion of the bust, the rotation of the bust, the arms height, the knees flexion, the difficulty of pick up materials, the length of materials are some of the aspects considered for each elementary operation for the analysis of movements. After, a bar chart, as the one reported in figure 7, represents the total score of criticality for each activities carried out by the workstation considered. The Muri results allow to understand the most critical activities for each workstation. Therefore, designers planned a working station outside the line: operations 487, 489 and 488 are completed in an isolated working station.The first solution designed is the one reported in Figure 5.Through this solution Overburden (Muri) and novalue-adding activities (Muda) have been reduced compared to the initial situation.
But, the proposed solution shows limits connected with the operator safety. In fact, there are a lot of right operations and consequently the operator mainly works counter the assembly line movement direction. In addition, another important element for the plan layout design, is the working side along the line which impact on the number of jig rotation and on the loss time. So comfortable and the ergonomic manner for the worker in the workstation and no- value adding activities could be improved. Indeed developing an ergonomic working conditions among employers reduce accidents, increase safety and comfort and optimize business performance [21]. In Figure 8, the white arrow shows the operator position, while the black one shows the line direction. It is clear that the operator works walking backwards and this represents an unsafe working condition. Hence, the previous layout was improved as illustrated in Figure 9. WS3N position shifted from the left to the right side.Reanalysing the activities through a Muri analysis, as illustrated before, with the actual configuration the operator’s safety problems have been removed.After the feasibility assessment and the balancing phase, the new datasheets were composed. The designed semiautomatic assembly line is moved by a three-phase asynchronous engine and it is equipped with 6 stopping devices. It is 9 meters in length and 0.9 meters in width and 12 jigs are distributed along 4 working station. The feeding system was planned in order to remove, or at least reduce, the non-value adding activities, like moving to take the components or taking them to the workstations. As it is, we can highlight some qualitative improvement obtained by the semi-automated assembly line. In addition to the assembly line work stations, Figure 10 shows the designed line feeding system. It is a relevant aspect to take into account depending on its effect on the efficiency of the manufacturing systems [22]. In the new linear layout, some boxes containing small components were located near the jigs. Further, improvements of ergonomic were obtained by installing simple support devices for the electric screwdrivers. The two lateral replenishment aisles simplify and increase the efficiency of the supply operations: the responsible for the material supply invade no longer the area occupied by the assemblers. C. The training phase and the mass production
Fig. 9. Final layout.
The re-engineering of the assembly process lead to new working procedure. The change necessitated developing an educational path for the operators performing assembly tasks and for technicalemployerssubstituting operators by necessity. An analysis of the educational requirements, production requirements, available time and operators’ role was performed in order to plan in detail the educational path and to prepare the educational material. The training, performed after this preliminary stage, was divided on the following three steps: •
The presentation of training videos and the new workstation datasheets is the first step of the training process and it gives to operators the necessary theatrical information.
•
•
After the descriptive step, an direct confrontation between the new process designers and the operators, enables the operators to clarify potential doubts and to suggest improvements. Then the training path includes the on field experience that is divided into two further steps: at first the task are performed with the assembly line in stationary condition and then, when the operators gain confidence with the tasks, the process is simulated on the running line. So the operators are enabled to simulate the whole process and to learn all the skills and knowledge required for the process performing.
Due to the training, the operators are ready to start the production and to confidently operate on the new assembly line. After this phase, the mass production phase started as planned and the new production process is observed and analysed. The operations time were collected and analysed in order to quantitatively evaluate the obtained improvement. The results are summarized and shown in the following paragraph. IV.
RESULTS
Two parameters have been evaluated in order to provide a complete comparison between the initial system and the new one: •
the working station saturation level;
•
the employed working force.
The line tack time is defined by the tack time of the whole production system. It is 170s.The saturation level of each workstation is calculated as the ratio between the sum of the task time in the workstation and the line tack time.The workstation saturations for the circular assembly line are summarized in Table 1. The oversaturation in WS5 is faced having recourse to a semi-finished product stock that doesn’t fit with the Just in time policies adopted by the company. Moving from the circular to the semi-automated linear line, five operations are allocated to another line not saturated and equipped with the required tools. Tables from 2 to 5 show the task time expressed in seconds for each operation performed and the sum of the task times in each workstation, for both VR1 and VR3, when available.
TABLE I. Workstation Saturation [%]
WORKSATION SATURATION LEVEL
WS1 88
WS2 VA1
VA2
69.3
61.7
TABLE II.
WS3
WS4
WS5
72.7
67.2
121.6
TASK TIME (WS1N)
Workstation WS1N Operation ID
Op. time VR1 [s]
Op. time VR2 [s]
824
⁄
13
862
⁄
20
612
⁄
43
863
⁄
50
TOT
⁄
126
TABLE III.
TASK TIME (WS2N)
Workstation WS2N Operation ID
Op. time VR1 [s]
Op. time VR2 [s]
824
23
23
646
6
6
802
31
31
680
3
3
825
9
9
826
14
14
838
57
57
847
2
2
864
⁄
12
823
13
⁄
TOT
158
157
TABLE IV.
TASK TIME (WS3N)
Workstation WS3N Operation ID
Op. time VR1 [s]
Op. time VR2 [s]
830
50
50
845
10
10
831
37
37
855
17
17
It is possible to calculate the saturation level of the four workstations (Tab. VI).
848
23
23
833
20
20
The new line leads to a clear and sizeable increase in the workstations saturation. The comparison between the mean line saturation is not meaningful because of the presence, in WS5, of a oversaturation condition. The oversaturation is removed in the new assembly line and consequently the Just in Time can pursued.
TOT
157
157
As concern the employed working force, the circular line required five operators for the VR1 assembly and three operators for the VR2 assembly. In the linear assembly line the required working force decrease, in fact, respectively, four and two operators are necessary.
TABLE V.
TASK TIME (WS4N)
Workstation WS4N Operation ID
Op. time VR1 [s]
Op. time VR2 [s]
609
⁄
69
601
⁄
52
600
⁄
43
TOT
⁄
164
TABLE VI. Workstation Saturation [%]
WORKSATION SATURATION LEVEL OF THE NEW LINE WS1N 73.8
WS2N VR1
VR2
92.6
92.3
WS3N
WS4N
92.4
96.1
Further, another interesting improvement is obtained passing from the manual to the semi-automated line in term of quality control. In Workstation 5 the same operator was responsible for both a control and re-control activities over a same component. Such an task assignment is against one of the quality generation principle that the operator performing a control action on an item, cannot be responsible of a further control on the same item. The new line balancing eliminated this incongruence, in fact the two control activities are performed by two different operators in two different workstation, WS1N and WS4N. V.
CONCLUSION
The paper presented the automation process of an assembly line in the motorcycle industry field. The re-engineering process is based on a structured framework. The change from the manual process to the new semi-automated assembly line is composed of 4 main steps: the as-is analysis, the Process reengineering and layout design, the training and finally the mass production. The chosen automation level depends on the complexity of the tasks involved in the process. The study showed that the line automation yielded significant improvements, from both a qualitative and a quantitative perspective. At first the change leads to an improvement of the quality control process rigor and a higher adherence to with Just in Time principles. Then, the on field measures performed before and after the innovation developed, showed further improvements. As concern the employed working force, there was a decrease from 5 to 4 operators for the VR1 and from 3 to 2 operators for the VR2. More, the new line implementation leads to a sizeable increase in the workstations saturation. Even if the study was limited to one of the firm assembly line, it represents a good practice interesting for process and logistics managers involved in the planning of a new assembly line or in the redesign of an existing one.
REFERENCES [1]
[2]
[3]
J., Ritchie, R. Dewar, and J. Simmons, “The generation and practical use of plans for manual assembly using immersive virtual reality”, Proceedings of the Institution of Mechanical Engineer, Vol. 213 No. 5, pp. 461-74, 1999. J. Fan, and J. Dong, “Intelligent virtual assembly planning with integrated assembly model”, IEEE International Conference on Systems, Man and Cybernetics, pp. 4803-4808, 2003. R. Bloss, “Assembly and Automation Expo highlights innovations in automated assembly", Assembly Automation, Vol. 31 No. 3, pp. 220223, 2011.
[4]
R. Parasuraman, and V. Riley, “Humans and automation: use, misuse, disuse, abuse.”, Human Factors, Vol. 39 No. 2, pp. 230-253, 1997. [5] S.W.A. Dekker, “On the other side of promise: what should we automate today?”, In: Harris, D. (Ed.), Human Factors for Civil Flight Deck Design. Ashgate Publishing, Aldershot, Hampshire, pp.183-198, 2004. [6] E. Hollnagel, “Human-oriented automation strategies.”, In: Proceedings of the World Congress on Safety of Modern Technical Systems. TUV-Verlag, Cologne, Cologne, pp. 443-452, 2001. [7] K. Liaoand Q. Tu, "Leveraging automation and integration to improve manufacturing performance under uncertainty: An empirical study", Journal of Manufacturing Technology Management, Vol. 19 No. 1, pp.38- 51, 2008. [8] M.P. Groover, “Automation, Production Systems, and ComputerIntegrated Manufacturing, 2nd ed.”, Prentice Hall, Inc., Pearson Education, 2001. [9] D.B. KaberandM.R. Endsley, “The effects of level of automation and adaptive automation on human performance, situation awareness and workload in a dynamic control task.” Theoretical Issues in Ergonomics Science, Vol. 5 No. 2, pp. 113-153, 2004. [10] C.D. Wickens, “Engineering Psychology and Human Performance, second ed.”, HarperCollins, New York, 1992. [11] T.H. Chang, C.H. Chiou, H.P. Fu, andP. Chao, "The effect of the government's manufacturing automation promotion policy in Taiwan", Journal of Manufacturing Technology Management, Vol. 17 No. 1, pp. 73-88, 2006. [12] T. Martin, J. Kivinen,J.E. Rijnsdorp, M.G. Rodd and W.B. Rouse, “Appropriate automation-integrating technical, human, organizational, economic and cultural factors.”, Automatica, Vol. 27 No. 6, pp. 901917, 1991. [13] M. Winroth, K. Safsten, and J. Stahre, “Automation strategies: existing theory or ad hoc decisions?”, International Journal of Manufacturing Technology and Management, Vol. 11 No. 1, pp. 98114, 2007. [14] V. Granell, “Levels of automation in manufacturing systems: aligning strategic and tactical decisions by means of operational measurement.”, Research Series from Chalmers University of Technology, Report No. 18, Goteborg, Sweden, 2007. [15] U. Sandberg, “Reasons for the Success or Failure of an Automation Project: An Investigation of Small and Medium-‐sized Swedish Manufacturing Companies.”, Integrated Manufacturing Systems, Vol. 3 No. 1, pp. 21-26, 1992. [16] Bevilacqua, M., Ciarapica, F.E., Paciarotti, C., “A BPR approach to hydrogeological risk management”, Natural Hazards, 71 (3), pp. 19952012, 2014. [17] B. Rekiek, and A. Delchambre, "Assembly Line Design: The Balancing of Mixed-Model Hybrid Assembly Lines with Genetic Algorithms", Assembly Automation, Vol. 26 No. 3, pp. 252. [18] M. Bevilacqua, F. E. Ciarapica, I. De Sanctis, G. Mazzuto, C. Paciarotti, “A Changeover Time Reduction through an integration of lean practices: A case study from pharmaceutical sector”, Assembly Automation, Vol. 35,No. 1 , pp. 22-34, 2015. [19] N. Dixon,“The Organizational Learning Cycle: How We Can Learn Collectively”, McGraw-Hill Company, London, 1994. [20] N. Mirsepasi, “Human resources management and relationships: a strategic perspective.”, Tehran: Shervin, 1997. [21] S.,Trzcielinski,W.,Karwowski, “Advances in Ergonomics in Manufacturing”, CRC Press; 1 edition (July 10, 2012). [22] H.S. Kilic, and M.B. Durmusoglu, “Advances in assembly line parts feeding policies: a literature review.”, Assembly Automation, Vol. 35 No. 1, pp. 57–68, 2015.
Appendix 1 MURI sheet.