THE JOURNAL OF BIOLOGICAL CHEMISTRY VOL. 280, NO. 42, pp. 35521–35527, October 21, 2005 © 2005 by The American Society for Biochemistry and Molecular Biology, Inc. Printed in the U.S.A.
The Conformationally Dynamic C Helix of the RI␣ Subunit of Protein Kinase A Mediates Isoform-specific Domain Reorganization upon C Subunit Binding* Received for publication, June 21, 2005, and in revised form, August 17, 2005 Published, JBC Papers in Press, August 17, 2005, DOI 10.1074/jbc.M506769200
Dominico Vigil‡1, Donald K. Blumenthal§, Susan S. Taylor‡, and Jill Trewhella¶2 From the ‡Department of Chemistry and Biochemistry and Howard Hughes Medical Institute, University of California, San Diego, La Jolla, California 92037 and the §Departments of Pharmacology and Toxicology, Biochemistry, and ¶Chemistry, University of Utah, Salt Lake City, Utah 84112 Different isoforms of the full-length protein kinase A (PKA) regulatory subunit homodimer (R2) and the catalytic (C) subunitbound holoenzyme (R2C2) have very different global structures despite similar molecular weights and domain organization within their primary sequences. To date, it has been the linker sequence between the R subunit dimerization/docking domain and cAMPbinding domain A that has been implicated in modulating domain interactions to give rise to these differences in global structure. The small angle solution scattering data presented here for three different isoforms of PKA heterodimer (⌬R-C) complexes reveal a role for another conformationally dynamic sequence in modulating intersubunit and domain interactions, the C helix that connects the cAMP-binding domains A and B of the R subunit. The ⌬R-C heterodimer complexes studied here were each formed with a monomeric N-terminal deletion mutant of the R subunit (⌬R) that contains the inhibitor sequence and both cAMP-binding domains. The scattering data show that type II␣ and type II ⌬R-C heterodimers are relatively compact and globular, with the C subunit contacting the inhibitor sequence and both cAMP-binding domains. In contrast, the type I␣ heterodimer is significantly more extended, with the C subunit interacting with the inhibitor sequence and cAMPbinding domain A, whereas domain B extends out such that its surface is almost completely solvent exposed. These data implicate the C helix of RI␣ in modulating isoform-specific interdomain communication in the PKA holoenzyme, adding another layer of structural complexity to our understanding of signaling dynamics in this multisubunit, multidomain protein kinase.
Protein kinase A (PKA),3 a member of the Ser/Thr protein kinase family, is involved in the regulation of a large number of processes, including cell proliferation and metabolism, as well as higher level functions of learning and memory (1, 2). Mutations in PKA can lead to diseases such as Carney complex (3) and lupus erythematosus (4), underscoring the importance of its role in signaling processes and dis-
* This work was supported in part by a grant from the U. S. Dept. of Energy Office of Science in support of the Oak Ridge Center for Structural Molecular Biology (to J. T.) and National Institutes of Health Grant GM34921 (to S. S. T.). The costs of publication of this article were defrayed in part by the payment of page charges. This article must therefore be hereby marked “advertisement” in accordance with 18 U.S.C. Section 1734 solely to indicate this fact. 1 Supported by National Institutes of Health Supplement Grant GM34921-19A1. 2 To whom correspondence should be addressed: Dept. of Chemistry, 315 S. 1400 East, Rm. 1124 HEB, University of Utah, Salt Lake City, UT 84112. Tel.: 801-585-9328; Fax: 801-581-8433; E-mail:
[email protected]. 3 The abbreviations used are: PKA, protein kinase A (cAMP-dependent protein kinase); C, catalytic subunit of PKA; D/D domain, dimerization/docking domain; Dmax, maximum linear dimension; H/D, hyrogen/deuterium; MOPS, 3-(N-morpholino)propanesulfonic acid; R, regulatory subunit of PKA; Rg, radius of gyration.
OCTOBER 21, 2005 • VOLUME 280 • NUMBER 42
ease states. Unlike many protein kinases, the catalytic and regulatory functions of PKA are on separate polypeptide chains. The catalytic (C) subunits are responsible for catalyzing phosphoryl transfer, whereas the regulatory (R) subunits confer cAMP dependence and localize the holoenzyme to discrete subcellular locations via interactions with protein kinase A anchoring proteins (5). At low intracellular cAMP concentrations, PKA is maintained as an inactive tetrameric holoenzyme complex (R2C2) consisting of a homodimeric R2 subunit and two C subunits. When intracellular concentrations of cAMP are increased in response to specific stimuli, two cAMP molecules bind allosterically to each R subunit, which releases inhibition of the C subunits and allows them to phosphorylate their protein targets. There are four major isoforms of PKA that differ with respect to their R subunits (RI␣, RI, RII␣, and RII). These isoforms have different biological functions, as determined by genetic studies using mice (6, 7). Despite their different cellular functions, the different R isoforms share the same domain organization within their sequences: starting from the N terminus is a dimerization/docking (D/D) domain that also anchors the R subunits to PKA anchoring proteins, a linker region that contains an inhibitor sequence, and two tandem cAMP-binding domains (designated A and B). There is high sequence homology between all the isoforms in the D/D domain and the cAMP-binding domains (8), but the linker regions are highly variable in both length and sequence (9). High resolution structures of the C subunit (10), cAMP-binding domains of RI␣ (11) and RII (12), and the D/D domains of RII␣ (13) and RI␣ (14) provide important molecular insights into the phosphoryl transfer reaction, cAMP binding, and tethering of the R subunits to specific cellular locations. To date, full-length holoenzyme or R2 homodimer crystal structures for PKA have been elusive. Small angle x-ray scattering studies have shown that both full-length RII␣ and RII homodimers are highly extended structures in solution, whereas the RI␣ homodimer is much more compact, having a Y-like shape (9). Likewise, the shape of the full-length type II␣ holoenzyme is much more elongated than the type I␣ (15). These shape differences have been attributed to structural differences in the linkers between type I and type II isoforms that lead to different spatial organizations of domains (9). The results reported here further explore the conformational diversity of R subunit isoforms using small angle solution scattering to study N-terminal-truncated monomeric versions of RI␣, RII␣, and RII that contain the inhibitor sequence and both cAMP-binding domains (A and B) in heterodimeric complexes with the C subunit. Previous small angle scattering studies of a type II␣ R-C heterodimer (16) support structural models in which both the A and B cAMP-binding domains of RII␣ interact with C, leading to a compact overall structure (17). However, hydrogen/deuterium (H/D) exchange coupled with mass spectrometry (18, 19), limited proteolysis (20), and chemical footprinting
JOURNAL OF BIOLOGICAL CHEMISTRY
35521
Isoform-specific Domain Reorganization in Protein Kinase A (21), as well as a recently developed model of the type II R-C heterodimer,4 predict different R-C interfaces for RI␣ versus RII. The first crystal structure showing an R-C interaction was recently obtained for a complex of the C subunit with a deletion mutant of RI␣ that includes just the pseudo-substrate inhibitor region and cAMP-binding domain A (22). This structure shows an interaction with the inhibitor site of RI␣ bound to the active site of C as well as with the helical region of cAMPbinding domain A bound to the surface of the large (C-terminal) lobe of C. Compared with the crystal structures of the free R subunit (11, 12), there are significant conformational rearrangements within RI␣ upon binding C. In particular, the C helix in the A domain of RI␣, which connects the cAMP binding A and B domains, swings away from the -barrel and the phosphate binding cassette, suggesting that the interface between the two cAMP-binding domains may be altered upon C subunit binding. The results reported here show that there is indeed a dramatic conformational change in the disposition of the cAMP-binding domains of RI␣ upon C subunit binding and that there are significant isoform differences in the cAMP-binding domain and C subunit interactions in the heterodimeric complexes studied.
MATERIALS AND METHODS Protein Expression and Purification—Bovine RI␣ (residues 92–379), rat RII␣ (residues 92– 400), and RII (residues 104 – 408) deletion mutants were expressed in Escherichia coli 222 cells and affinity purified on cAMP-Sepharose resin as described previously (9). Recombinant bovine catalytic (C) subunit was expressed in E. coli and purified as previously described (23). R-C heterodimers were formed by mixing purified R subunit deletion mutants with a molar excess of purified C subunit and dialyzing against buffer containing 10 mM MOPS, pH 7.0, 150 mM NaCl, 2 mM MgCl2, and 0.2 mM ATP. These conditions approximate physiological ionic strength and concentrations of Mg2⫹/ATP for most tissues. Gel filtration (Superdex 75) was then used to separate heterodimer complexes from free C subunit, the running buffer being identical to the buffer used for dialysis. Heterodimer activation by cAMP was checked with a coupled kinase assay to confirm that C subunit was inhibited in a cAMP-dependent manner (24). The substrate peptide, Kemptide, with the sequence LRRASLG was synthesized by the Microchemical Facility of the University of California, Berkeley. Amino Acid Analysis—Amino acid composition of the type I␣ heterodimer (Sample 3) was quantified after hydrolysis in 5.7 N HCl containing 0.1% phenol in vacuo at 110 °C. The analysis was performed on a Beckman 6300 analyzer. The reliably quantified amino acids (Ala, Arg, Asx (Asn⫹Asp), Glx (Gln⫹Glu), Ile, Leu, Lys, Phe, and Val) were used to estimate protein concentration of samples analyzed by small angle scattering. The amino acid analysis was performed by Dr. Dennis Winge, University of Utah. Small Angle X-ray Scattering Measurements—X-ray scattering data were collected using the line source instrument described by Heidorn and Trewhella (25) that is now at the University of Utah. Intensity data were reduced to I(q) versus q using standard procedures to correct for detector sensitivity and background signal. A smearing procedure was used to correct for the slit geometry of the instrument when comparing predicted scattering of structural models to the experimental scattering data (25). I(q) is the scattered x-ray intensity per unit solid angle, and q is the amplitude of the scattering vector and is given by 4(sin)/ (where 2 is the scattering angle and is the wavelength of scattered x-rays, which is 1.54 Å for this instrument). The net scattering from the protein was calculated by subtracting a normalized buffer spectrum. 4
D. Law, private communications.
35522 JOURNAL OF BIOLOGICAL CHEMISTRY
The buffer blank was identical to the buffer in the protein samples as it was obtained from protein-free gel filtration fractions collected during purification of the corresponding R-C complex. For each sample, three different protein concentrations were measured (ranging from ⬃1–1.5 to ⬃5–10 mg/ml). There are no concentration-dependent effects in the scattering; i.e. the Rg, Dmax, and P(r) functions remain unchanged within experimental error. Because the signal/noise ratio is the best for the highest concentration samples, the data from these samples were used for analysis. Sample and buffer measurements took between 12 and 24 h, and the samples were kept at 13 °C during the measurements. Small Angle X-ray Scattering Data Analysis—Structural information was derived from the scattering data by calculating the inverse Fourier transform of I(q), which yields P(r), the probable distribution of vector lengths, r, between scattering centers (atoms) within the scattering particles (calculated using the program GNOM) (26). P(r) thus provides insights into the overall shape of the scattering molecule. P(r) goes to zero at the maximum linear dimension, Dmax, of the scattering particle, and its zeroth and second moments give the forward scattering, I(0), and radius of gyration, Rg, values, respectively. Guinier (27) plots (q2 versus lnI(q) for Q䡠Rg ⬍1.3) show the expected straight line fit for monodisperse identical scattering particles. Structural Models—Simulated scattering profiles for the type II␣ model (17) (Protein Data Bank accession number 1KMW) and H/D exchange/docking type II model5 were generated using CRYSOL with standard parameters, including the standard solvation layer thickness and contrast (28). Different arrangements of the B domain with respect to the A domain and C subunit for the type I␣ heterodimer were generated using the program CONTRAST. CONTRAST (29) can take a set of known high resolution structures as well as shapes of uniform scattering density and find the relative position and orientation of these components that give the best fit to a set of experimental scattering profiles. The best-fit model structures are generated using a Monte Carlo approach employed previously (16, 25). CONTRAST uses the fitting parameter F defined in Equation 1 to evaluate the quality of the fit of each model to the data.
F⫽
1 N pts
冉冘
N pts
共I共q兲 ⫺ I m 共q兲兲 2 共q兲 2
冊
(Eq. 1)
Npts is the number of points in the data set, I(q) and Im(q) are the experimental and model intensities, respectively, and (q) is the experimental uncertainty of I(q). We defined two high resolution components for the CONTRAST calculations, the crystal structure of C bound to residues 94 –244 of RI␣ (C/A domain) (Protein Data Bank accession number 1U7E) and residues 245–376 of the isolated, cAMP-free RI␣ B domain (Protein Data Bank accession number 1RL3). The individual structures were connected through residues Tyr243 and Glu244 and allowed to rotate randomly with respect to each other about this pivot point. The selection of this pivot point was based upon observations of the final snapshot of a molecular dynamics simulation performed to discover possible energetically feasible placements of the B domain within the heterodimer5. Because the small angle scattering data are inherently low resolution and only sensitive to overall distributions of molecular mass rather than the locations of specific amino acids, the precise choice for the pivot point within the C helix, as well as the details of the atomic structure in this region, are somewhat arbitrary for the purposes of this study. To find the model that best fit the scattering data, the angles for the bonds about the selected pivot point were assigned 5
J. Gullingsrud, private communications.
VOLUME 280 • NUMBER 42 • OCTOBER 21, 2005
Isoform-specific Domain Reorganization in Protein Kinase A
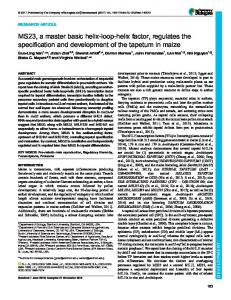
FIGURE 1. Intensity profiles and P(r) functions for the type II␣ and II PKA heterodimers. A, I(q) versus q for the type II␣ heterodimer (upside-down triangles) and the type II (circles). The solid line through the II␣ data is the simulated scattering profile of the II␣ heterodimer model from neutron contrast variation studies (17) (shown in Fig. 5A). The solid line through the type II data is the simulated scattering profile of the II heterodimer H/D-exchange model.4 Scattering profiles are offset for ease of viewing. For clarity, only every other data point is plotted. B, P(r) functions derived from the scattering profiles in panel A and from which the structural parameters in TABLE ONE are calculated. Symbols are the same as in panel A. Areas under the P(r) curves are normalized based on the square of the average molecular weight of the scattering particles. Errors are based on counting statistics and are smaller than the symbols if not shown.
randomly with the only constraint being that no van der Waals overlap between the two rigid bodies was allowed. In this manner the B domain of R could be placed in random locations with respect to the domain A/C subunit component while keeping the distance between them consistent with that required by the sequence connectivity and also avoiding component overlap. Four independent runs of CONTRAST were performed, each testing in excess of 100,000 possible models. The molecular volumes of the atomic models for type I␣ and type II␣ and II heterodimers were calculated using the Porod invariant (30) and simulated scattering profiles generated by CRYSOL (28). Low resolution ab initio shapes that fit the scattering data were generated using the program DAMMIN (31) for each heterodimer isoform. This program constructs arbitrary shapes using assemblies of dummy atoms and tests them against experimental scattering intensity profiles. No symmetry constraints were applied, and the initial shape tested in each DAMMIN run was a sphere with radius equal to Dmax (TABLE ONE). The default parameters were used in each calculation, including a packing radius of dummy atom beads of 3.2 Å for type I␣ and 2.5 Å for type II␣ and type II. For the more complex-shaped RI␣ models, 10 independent models were aligned and averaged using the program DAMAVER with default parameters (32). The program DAMFILT (32) was then used to filter the models based on occupancy, with the mean volume of the constituent runs set as the cutoff to produce the average or most probable model (Fig. 4A). The C␣ coordinates of the previously developed type II␣ heterodimer model (Protein Data Bank accession number 1KMW) were superimposed with the type II␣ heterodimer DAMMIN model, and the C␣ coordinates of the DAMAVER/DAMFILT type I␣ heterodimer model were superimposed with the CON-
OCTOBER 21, 2005 • VOLUME 280 • NUMBER 42
FIGURE 2. Intensity profiles and P(r) functions for the type I␣ PKA heterodimer. A, I(q) versus q for three independent preparations of the type I␣ heterodimer. The solid line through the data sets is the simulated scattering profile of the best-fit CONTRAST model (Fig. 5B). Top, middle, and bottom rows correspond to Samples 1, 2, and 3, respectively. For clarity, only every other data point is plotted. B, P(r) functions of the scattering profiles shown in panel A and from which the structural parameters in TABLE ONE are calculated. Symbols are the same as in panel A. Areas under the P(r) curves are normalized to those in Fig. 1 according to the average molecular weight squared of the scattering particles. Errors are based on counting statistics and are smaller than the symbols if not shown.
TRAST model using the program SUPCOMB (33). The molecular volumes for the DAMMIN models were calculated using the Porod invariant (30) and simulated scattering profiles (from DAMMIN).
RESULTS Small Angle Scattering Data—The small angle x-ray scattering intensity profiles and associated distance distribution functions, P(r), for the type II␣ and II PKA heterodimers are shown in Fig. 1; those for the type I␣ heterodimer are shown in Fig. 2. The Guinier plots for each isoform are all linear, as expected for a monodisperse solution of identical particles (Fig. 3), and the volumes of the scattering particles, calculated from the scattering data using the Porod invariant (TABLE ONE), are as predicted from the molecular weight of each heterodimer complex. In combination, these results are good evidence that we have monodisperse protein solutions suitable for analysis of structural parameters from the scattering data. In the case of the type I␣ heterodimer, data from three independent sample preparations are presented (Fig. 2). Unlike the type II isoforms, the type I␣ isoform shows small variations in the scattering data from different protein preparations. We pursued some additional analyses to see whether we could determine the source of this variability. A reducing SDS-PAGE gel of the RI␣ heterodimer showed no detectable protein contaminants, and band staining intensities were consistent with an ⬃1:1 stoichiometry of R and C (not shown). Quantitative amino acid analysis of the same sample gave a possible range of R:C stoichiometries from 1:1 to 1.2:1. Thus, the sample variability giving rise to the small differences in the P(r) functions appears to be inherent to the RI␣-C heterodimer complex and may reflect small variations in the global
JOURNAL OF BIOLOGICAL CHEMISTRY
35523
Isoform-specific Domain Reorganization in Protein Kinase A structure of the reconstituted complex in different preparations. From simple inspection of the P(r) profiles in Figs. 1 and 2 it is evident that these sample-to-sample variations in RI␣ are very small in comparison to the differences between the RII and RI heterodimers. Compact Domain Organization within the Type II␣ and II Heterodimers—The I(q) data and associated P(r) functions for the type II␣ and II heterodimers are the same within experimental error (Fig. 1). The P(r) profiles have a peak at ⬃35 Å, go to zero at the maximum linear dimension, Dmax, of the scattering particle (⬃90 Å), and yield Rg values of ⬃30 Å (TABLE ONE). The scattering data thus indicate relatively compact structures with the same overall shape for the two RII isoforms. Using the ab initio structure-predicting program DAMMIN (31), we tested a number of predicted shapes against the RII scattering data sets and found that the best-fit shapes were compact, approximately prolate ellipsoids with axes lengths of ⬃40, 50, and 90 Å. Two different atomic models have been proposed for the type II heterodimer complex that each have overall dimensions that agree well with the dimensions of the ellipsoid-shaped models from DAMMIN (Fig. 4A). One of these models is based on neutron scattering solvent
FIGURE 3. Guinier plots of the scattering data for each heterodimer. A, plots of the three independent type I␣ heterodimer samples. Top, middle, and bottom represent Samples 1, 2 and 3, respectively. Solid lines represent linear least-squares fits through the plots. B, plots for the type II␣ (upside-down triangles) and II (circles).
contrast variation data from an RII␣-C heterodimer (16) combined with homology modeling and constrained molecular docking (17) (Protein Data Bank accession number 1KMW). The second is based on H/D exchange data on the RII-C heterodimer (19) and rigid body molecular docking4. Because both these models use the unmodified crystal structures of the isolated and cAMP-bound RII (12) (Protein Data Bank accession number 1CX4), any changes in the A and B domains upon release of cAMP and/or C subunit binding will not be accounted for. However, both models predict substantial differences in the R-C interface from that seen in the recent crystal structure of the RI␣ (A domain)-C heterodimer. Perhaps most noteworthy for this study, both RII heterodimer models predict a more extensive interaction of the C helix of RII with the C subunit than is seen in the RI␣ heterodimer crystal structure and, consequently, a closer spatial relationship to the cAMP-binding domain B. There is excellent agreement between the predicted scattering profiles of each model and the experimental scattering data from the type II␣ and II heterodimers (see F values, TABLE ONE): thus, the predicted Rg values (TABLE ONE) and P(r) functions (Fig. 1B) also agree well. Fig. 4A shows an example of the RII␣-C model from neutron contrast variation studies superimposed onto a representative II␣ heterodimer DAMMIN model. Although the precise details of the R-C interface remain uncertain, the overall compactness of the shape determined from the scattering data means that the B domain must be spatially close to the C subunit in both type II isoform heterodimers. It is also worth noting that major rearrangements between the A and B domains are not required to adequately fit the scattering data. The B Domain in the Type I␣ Heterodimer Extends Away from Both the A Domain and the C Subunit—In contrast to the type II isoforms, the P(r) functions for the type I␣ heterodimer indicate a significantly more extended shape with a peak at ⬃30 –35 Å and a long, extended tail that goes to zero at a Dmax value in the range of 120 –130 Å (Fig. 2). For the type I␣ heterodimer, we also generated ab initio shapes that best fit the highest quality data (Sample 2) using DAMMIN (31). These shapes were not simple ellipsoids but rather more complex shapes. We there-
TABLE ONE
Structural parameters derived from the scattering data Rg
Dmax
Va
Fb
0.9, 1.4, 0.90 1.37, 0.94, 1.63
Å
Type I␣ heterodimer Sample 1 Sample 2 Sample 3 CONTRAST modelc c DAMMIN model Type II␣ heterodimer Current study d Previous study Type II␣ modele Type II heterodimer Current study Type II modele
38.6 ⫾ 1.6 36.4 ⫾ 0.6 37.1 ⫾ 1.4 33.2 36.3
130 120 125 115 120
106 96 110 116 119
29.8 ⫾ 0.8 30.6 ⫾ 0.5 28.6
90 — 90
110 103
1.04
30.2 ⫾ 1.0 29.1
90 90
99 102
0.70
V is the molecular volume (in 103 Å3) calculated using the Porod approximation (30) and either experimental scattering data or simulated scattering profiles of the models. The expected volumes for the type I␣, II␣, and II heterodimers are 88,200, 91,500, and 90,700 Å3, respectively, based on their molecular weights and assuming a partial specific volume of 0.73 cm3/g. b The fitting parameters values, F, listed are calculated using Equation 1. The three sequential F values of the type I␣ heterodimer CONTRAST model and DAMMIN models are for samples 1, 2 and 3, respectively. c These models are shown in Fig. 5. The DAMMIN model was constructed using scattering data from Sample 2. d The data for type II␣ heterodimer were taken from Zhao et al. (16). The Dmax value was not listed in that publication. e Parameters listed are for high resolution models based on neutron contrast variation and constrained docking (type II␣, Protein Data Bank accession number 1KMW (17)) or H/D exchange data and docking (type II4). a
35524 JOURNAL OF BIOLOGICAL CHEMISTRY
VOLUME 280 • NUMBER 42 • OCTOBER 21, 2005
Isoform-specific Domain Reorganization in Protein Kinase A
FIGURE 4. Type II␣ (A) and type I␣ (B) heterodimer models. Ribbon representation of the best-fit R-C heterodimer models superimposed on the low resolution models from DAMMIN. A, the averaged and filtered DAMMIN model (see “Materials and Methods”) for the type II␣ heterodimer is superimposed onto the RII␣-C model (17) (Protein Data Bank accession number 1KMW). B, the averaged RI␣-C DAMMIN model is superimposed onto the best-fit CONTRAST model. For the ribbon models, the C subunit N-terminal lobe is gray, and the C-terminal lobe is yellow. Within R, the linker sequence including the pseudo-substrate inhibitor is red, the A domain is blue, the B/C helix connecting the A and B domains is black, and the B domain is green. Notice that in the RI␣ model, the B domain swings out significantly away from the C subunit, whereas the model for RII␣ is very compact. The DAMMIN-derived models are shown as purple surface representations. Insight II (Accelrys) was used to prepare this figure.
fore determined an average model from 10 independent DAMMIN runs using the program DAMAVER (32). DAMAVER includes a filtering routine similar to that used in processing electron microscopy images to remove statistically low probability features in individual structures. As can be seen from the F value and the structural parameters in TABLE ONE, there is excellent agreement between the averaged and filtered model and the experimental data. Fig. 4B shows the significantly more elongated shape of the type I␣ heterodimer compared with the more compact, globular type II heterodimers. Based on the structural changes observed in the crystal structure of domain A of RI␣ with the C subunit involving the C helix that would normally link cAMP-binding domains A and B, we decided to test various placements of domain B within the RI␣ heterodimer complex against the scattering data using the structural modeling program CONTRAST (29). The four independent sets of CONTRAST calculations (see “Materials and Methods”) each converged to very similar best-fit structures that had a root mean square deviation (r.m.s.d.) value of ⬍0.5 Å (C-alpha r.m.s.d. calculated using SUPERIMPOSE in Insight II, Accelrys). The best-fit CONTRAST models are all consistent with an extension of the C helix in domain A that results in a movement of the A and B domains away from each other. There is also a significant movement of the B domain away from the C subunit (Fig. 4B). The Rg value of the ⌬(1–91)RI␣ subunit is 29.4 Å in our final CONTRAST model as compared with 21.1 Å in the isolated ⌬(1–91)RI␣ crystal structure. Our model also shows that the B domain is almost fully solvent exposed. The simulated scattering intensity profile of the CONTRAST
OCTOBER 21, 2005 • VOLUME 280 • NUMBER 42
FIGURE 5. C helix conformation in RI␣ and representations of the different A and B domain interfaces in RI␣ and RII. A, structure of the A domain of RI␣ and its cAMPbound state (left) and its C subunit-bound state (right). The B/C helices are in gray, and the phosphate binding cassette is in yellow. Notice the large extension of the B/C helices into one long helix and a movement away from the A domain upon binding C. B, A and B domain contacts in RI␣ (left) and RII (right). The black arrow corresponds to the divergence point of the B/C helices that leads to a very different orientation of the C helix in RI␣ versus RII. The A domain cAMP is in yellow and its phosphate binding cassette in red. The blue ribbon is the C helix of the A domain, and the turquoise is the C helix of the B domain. The hydrophobic capping of cAMP in the A domain in RI␣ comes from the very end of the A domain (Trp260), whereas in RII the cAMP is capped by Arg381 from the C helix of the B domain. There is an important salt bridge (Arg241/Glu200) in RI␣ that directly mediates cross-talk of the C helix with cAMP. In RII, this salt bridge is absent, and thus cAMP must mediate its effect in a different manner.
model gives good fits to the overall scattering profiles for each sample measured (see F values, TABLE ONE; see also Fig. 2). The values for Rg, Dmax, and the molecular volume are systematically smaller (by ⬃10, 5, and 3%, respectively) for the CONTRAST-derived models compared with the shapes from DAMMIN. This effect is consistent with there being some structural variability in the R-C interactions that can be accommodated in the ab initio shape analysis, which can account for lower average densities distributed over larger average volumes, but not in an approach that uses atomic models with fixed electron density values and volumes. The program SUPCOMB (33) was used to superimpose the best-fit CONTRAST model to the averaged DAMMIN model to compare the overall similarity of models produced by the different modeling approaches. The overlap of the superimposed models is very good (Fig. 4B), each predicting a similar placement of the B domain relative to the C subunit and A domain.
DISCUSSION The current study shows unequivocally that both cAMP-binding domains interact with C in the type II isoforms, but only domain A does so in the case of RI␣. It has been predicted, based on H/D exchange (17, 18) as well as by previous (17, 18) and recent4 modeling studies, that the RI␣-C and RII-C interactions would differ in their specific interfaces, including these differences in specific domain interactions. The most
JOURNAL OF BIOLOGICAL CHEMISTRY
35525
Isoform-specific Domain Reorganization in Protein Kinase A striking result here, however, is the observation for the first time of the dramatic movement of the A and B domains of the RI␣ subunit away from each other upon binding C subunit, such that the B domain becomes almost fully solvent exposed. This conformational transition is not observed for either of the type II isoforms. A comparison of the crystal structures of RI␣ and the C-RI␣ A domain complex suggests the structural basis for the dramatic conformational transition observed for RI␣ upon binding C. A major conformational change within the A domain of RI␣ upon binding C is observed that involves an extension of the B and C helices into a single long helix and the movement of this helix away from the phosphate binding cassette that constitutes part of the A domain cAMP-binding site (Fig. 5A). This observation suggests that the extension of the B/C helix is the major effector of the conformational change that leads to the extended B domain placement we observe in our solution scattering results. The crystal structure of the isolated tandem cAMP-binding domains of RI␣ (11) shows that the A and B domains make relatively few contacts with each other (Fig. 5B). In this structure, Glu200 in the phosphate binding cassette in the A domain forms a salt bridge with Arg241 of the C helix in the B domain. The Arg241, in turn, binds to Asp267 in the B domain. Upon binding the C subunit, Arg241 flips outward due to the extension of the B/C helix into a single long helix and thus no longer interacts with Glu200 (22). The small number of contacts and the nature of these contacts likely will facilitate reorganization of the A and B domains upon binding the C subunit. A computational analysis of the structures of various cAMP-binding domains suggested that hydrophobic capping of the adenine ring of cAMP plays an important role in the allosteric mechanism of cAMP signaling in all of the cAMP-binding domains and that the C helix provides a crucial link between the hydrophobic capping and the rest of the domain (34). Indeed, we have provided evidence here that the C helix in RI␣ is crucial for orchestrating the conformational dynamics between the A and B domains upon nucleotide binding. The crystal structure of the isolated RII tandem cAMP-binding domains shows a very different interface between the A and B domains compared with that for the isolated RI␣ tandem cAMP-binding domains (12) (Fig. 5). The structures of the individual cAMP-binding domains A and B from each isoform, respectively, can be superimposed reasonably well, but there is a very different angle between the B and C helices of domain A in RI␣ compared with RII (Fig. 5B), resulting in the relative dispositions of the domains being quite different for the different isoforms. In contrast to RI␣, the C helix in RII is already somewhat extended away from the A domain in a conformation already competent for C subunit binding. There are a number of hydrophobic contacts between A and B domains in RII that appear to be cAMP independent, as well as contact of a B domain residue (Arg381) with the adenine ring of cAMP that is likely crucial for interdomain cross-talk. Our previous solution scattering studies of the RI␣ and RII␣ homodimers (9) as well as an RII␣ monomeric form (16) show that for each of these isoforms cAMP binding does not cause any large scale change in domain organization. In addition, neutron contrast variation experiments on an RII␣-C heterodimer (16) show the compact arrangement between the A and B domains in that structure. In combination, these observations suggest that the compact arrangement of RII will be maintained in the absence of cAMP, in contrast to the extended arrangement of RI␣. In addition, sequence segments of RII at the interface between the A and B domains (201–209 and 282–300) do not show large changes in solvent exchange upon binding C (18). The cooperative mechanism for activation of the type I␣ holoenzyme by cAMP has been previously described (35). A molecule of cAMP must
35526 JOURNAL OF BIOLOGICAL CHEMISTRY
first bind to the B domain, allowing cAMP binding to the A domain, which then causes the conformational changes directly responsible for C subunit activation. Here, we suggest a structural mechanism for this cooperativity. Although the A domain is sterically accessible to bind cAMP as demonstrated by our model, the C helix is not in a suitable conformation to properly cap the adenine ring of cAMP, which is required for high affinity. We predict that binding of cAMP to the B domain leads to a concurrent binding of cAMP to the A domain and a collapse between the A and B domains that allows the C helix of the A domain to cap the A domain cAMP, thus conferring high affinity binding and subsequent activation. This mechanism is analogous to the simple hydrophobic capping mechanism that was seen in a crystal structure of RI␣ in which the B domain lacks cAMP (36). Again, this mechanism is fully consistent with the computational analysis that suggested the crucial cooperation of hydrophobic capping and repositioning of the C helix (34). The idea of an accessible A domain in the type I␣ heterodimer could have implications with regard to design of isoformspecific PKA inhibitors or activators that could bind in or near the cAMP-binding site. Molecular dynamics simulations5 suggest that the C helix is dynamic in the absence of cAMP. Thus, in the apo state the R subunit is likely in an equilibrium between the compact cAMP-bound structure and the extended C subunit-bound structure. Binding of cAMP or C might merely alter this equilibrium, with little expenditure of energy, as suggested in an NMR investigation of the structurally similar bacterial cAMP receptor protein transcription factor (37). The isoform differences in the interaction of the cAMP-binding domains of R with C provide yet another layer of isoform-specific structural variation that likely relates to their different biological functions. The close association of the B domain of R with C in the type II heterodimers might mask surface motifs that would otherwise be used in binding other C subunit partners such as the heat-stable protein kinase inhibitor. RI␣, but not RII␣ or RII, contains a conserved putative type II PDZ domain binding motif (Leu-Ser-Val) at its C terminus (38). An extended B domain in RI␣ could easily bind to PDZ domains in other signaling molecules, potentially integrating PKA into signaling networks in a PKA anchoring protein-independent manner. The C subunit-induced conformational change in the tandem cAMP-binding domains of RI␣ has implications for our previous modeling of small angle neutron contrast variation data for the full-length type I␣ holoenzyme (15). In that study, we tested composite models against the neutron scattering data using the structural models available for each of the components at that time: the NMR structure for the RI␣ D/D domain (14), a uniform density cylinder for the linker, and each of the two published models for the R-C heterodimer, one based on data from an RII␣-C heterodimer study (17) and the other based on a model that used the unmodified crystal structure of RI␣ (18). From the results presented here, we clearly can exclude the models for the type I␣ holoenzyme based on RII␣ data (Fig. 4B, Ref. 15). For the model derived using the earlier RI␣-C heterodimer model (Fig. 4A, Ref. 15) some modifications with respect to the detailed R-C interface are indicated, specifically an extension of cAMP-binding domain B away from domain A and from the C subunit. However, the major conclusions from the holoenzyme modeling, i.e. the general Y-shaped arrangement of the components and the C subunits binding to sites on the outer sides of the arms of the Y, remain unchanged. We have previously demonstrated with x-ray and neutron scattering that the linkers between the D/D domain and cAMP-binding domains in the R subunits are highly context dependent and can mediate different spatial arrangements of the D/D domain and cAMP-binding domains (9, 15). In the current work, we show that another conforma-
VOLUME 280 • NUMBER 42 • OCTOBER 21, 2005
Isoform-specific Domain Reorganization in Protein Kinase A tionally dynamic sequence that connects two domains, the C helix, plays a key role in orienting the A and B domains in response to cAMP and C subunit binding, thus playing a role in the proper transmission of information across long distances. It is becoming increasingly apparent that the functions of sequence segments that connect domains in signaling proteins are likely to play many significant roles other than the simple joining of individual functional domains. An important parallel to our study is given by studies of the Ca2⫹-binding protein calmodulin, which consists of two tandem Ca2⫹-binding domains connected by a helix. The connecting helix plays a complex role in the cooperativity of calcium binding between domains and dynamically couples the individual domains in a manner that is necessary for proper protein-protein interactions (39, 40). These studies bring to the fore the need to identify and characterize the full range of functions for these key interconnecting sequences, from the simple joining of domains to actively coordinating communication in multidomain structures, if we are to fully understand how complex, multidomain signaling proteins can integrate diverse stimuli for the desired biological response. Acknowledgments—We thank C. J. Allison for purifying the RII␣ deletion mutant and Mike Deal for purifying C subunit. We also thank Brian MacDonald (Los Alamos National Laboratory) for assistance with the x-ray instrumentation. We thank Justin Gullingsrud for the molecular dynamics results and helpful discussion and Dennis Law for the type II heterodimer model. We thank Dr. Dennis Winge, University of Utah, for performing the amino acid analysis.
REFERENCES 1. Ska¨lhegg, B. S. & Tasken, K. (2000) Front. Biosci. 5, D678 –D693 2. Kandel, E. (2001) Science 294, 5544 3. Kirschner, L. S., Carney, J. A., Pack, S. D., Taymans, S. E., Giatzakis, C., Cho, Y. S., Cho-Chung, Y. S. & Stratakis, C. A. (2000) Nat. Genet. 26, 89 –92 4. Laxminarayana, D. & Kammer, G. M. (2000) Int. Immunol. 12, 1521–1529 5. Wong, W. & Scott, J. D. (2004) Nat. Rev. Mol. Cell. Biol. 5, 959 –970 6. Amieux, P. S. & McKnight, G. S. (2002) Ann. N. Y. Acad. Sci. 968, 75–95 7. Cummings, D. E., Brandon, E. P., Planas, J. V., Motamed, K., Idzerda, R. L., and McKnight, G. S. (1996) Nature 382, 622– 626 8. Canaves, J. M. & Taylor, S. S. (2002) J. Mol. Evol. 54, 17–29 9. Vigil, D., Blumenthal, D. K., Heller, W. T., Brown, S., Canaves, J. M., Taylor, S. S., and Trewhella, J. (2004) J. Mol. Biol. 337, 1183–1194
OCTOBER 21, 2005 • VOLUME 280 • NUMBER 42
10. Knighton, D. R., Zheng, J. H., Ten Eyck, L. F., Ashford, V. A., Xuong, N. H., Taylor, S. S. & Sowadski, J. M. (1991) Science 253, 407– 414 11. Su, Y., Dostmann, W. R., Herberg, F. W., Durick, K., Xuong, N. H., Ten Eyck, L., Taylor, S. S. & Varughese, K. I. (1995) (1995) Science 269, 807– 813 12. Diller, T. C., Madhusudan, Xuong, N. H. & Taylor, S. S. (2001) Structure 9, 73– 82 13. Newlon, M. G., Roy, M., Morikis, D., Hausken, Z. E., Coghlan, V., Scott, J. D. & Jennings, P. A. (1999) Nat. Struct. Biol. 6, 222–227 14. Banky, P., Roy, M., Newlon, M. G., Morikis, D., Haste, N. M., Taylor, S. S. & Jennings, P. A. (2003) J. Mol. Biol. 330, 1117–1129 15. Heller, W. T., Vigil, D., Brown, S., Blumenthal, D. K., Taylor, S. S. & Trewhella, J. (2004) J. Biol. Chem. 279, 19084 –19090 16. Zhao, J., Hoye, E., Boylan, S., Walsh, D. A. & Trewhella, J. (1998) J. Biol. Chem. 273, 30448 –30459 17. Tung, C. S., Walsh, D. A. & Trewhella, J. (2002) J. Biol. Chem. 277, 12423–12431 18. Anand, G. S., Law, D., Mandell, J. G., Snead, A. N., Tsigelny, I., Taylor, S. S., Ten Eyck, L. F. & Komives, E. A. (2003) Proc. Natl. Acad. Sci. 100, 13264 –13269 19. Hamuro, Y., Zawadzki, K. M., Kim, J. S., Stranz, D. D., Taylor, S. S. & Woods, V. L. (2003) J. Mol. Biol. 327, 1065–1076 20. Cheng, X., Phelps, C. & Taylor, S. S. (2001) J. Biol. Chem. 276, 4102– 4108 21. Yu, S., Mei, F. C., Lee, J. C. & Cheng, X. (2004) Biochemistry 43, 1909 –1920 22. Kim, C., Xuong, N. H. & Taylor, S. S. (2005) Science 307, 690 – 696 23. Slice, L. W. & Taylor, S. S. (1989) J. Biol. Chem. 264, 20940 –20946 24. Cook, P. F., Neville, M. E., Jr., Vrana, K. E., Hartl, F. T. & Roskoski, R., Jr. (1982) Biochemistry 21, 5794 –5799 25. Heidorn, D. B. & Trewhella, J. (1988) Biochemistry 27, 909 –915 26. Svergun, D. I., Semenyuk, A. V. & Feigin, L. A. (1988) Acta Crystallogr. Sect. A 44, 244 –250 27. Guinier, A. (1939) Ann. Phys. 12, 166 –237 28. Svergun, D. I., Barberato, C. & Koch, M. H. J. (1995) J. Appl. Crysallogr. 28, 768 –773 29. Heller, W. T., Abusamhadneh, E., Finley, N., Rosevear, P. R. & Trewhella, J. (2002) Biochemistry 41, 15654 –15663 30. Porod, G. (1982) in Small Angle X-ray Scattering (Glatter, O. & Kratky, O., eds) pp. 18 –50, Academic Press, New York 31. Svergun, D. I. (1999) Biophys. J. 76, 2879 –2886 32. Volkov, V. V. & Svergun, D. I. (2003) J. Appl. Crystallogr. 36, 860 – 864 33. Kozin, M. B. & Svergun, D. I. (2001) J. Appl. Crystallogr. 34, 33– 41 34. Berman, H. M., Ten Eyck, L. F., Goodsell, D. S., Haste, N. M., Kornev, A. & Taylor, S. S. (2005) Proc. Natl. Acad. Sci. U. S. A. 102, 45–50 35. Herberg, F. W., Taylor, S. S. & Dostmann, W. R. (1996) Biochemistry 35, 2934 –2942 36. Wu, J., Brown, S., Xuong, N. H. & Taylor, S. S. (2004) Structure 12, 1057–1065 37. Gekko, K., Obu, N., Li, J. & Lee, J. C. (2004) Biochemistry 43, 3844 –3852 38. Songyang, Z., Fanning, A. S., Fu, C., Xu, J., Marfatia, S. M., Chishti, A. H., Crompton, A., Chan, A. C., Anderson, J. M. & Cantley, L. C. (1997) Science 275, 73–77 39. Qin, Z. & Squier, T. C. (2001) Biophys. J. 81, 2908 –2918 40. Hoeflich, K. P. & Ikura, M. (2002) Cell 108, 739 –742
JOURNAL OF BIOLOGICAL CHEMISTRY
35527