SIViP DOI 10.1007/s11760-008-0059-2
ORIGINAL PAPER
The effect of microarray image compression on expression-based classification Qian Xu · Jianping Hua · Zixiang Xiong · Michael L. Bittner · Edward R. Dougherty
Received: 24 April 2007 / Revised: 8 January 2008 / Accepted: 3 April 2008 © Springer-Verlag London Limited 2008
Abstract Current gene-expression microarrays carry enormous amounts of information. Compression is necessary for efficient distribution and storage. This paper examines JPEG2000 compression of cDNA microarray images and addresses the accuracy of classification and feature selection based on decompressed images. Among other options, we choose JPEG2000 because it is the latest international standard for image compression and offers lossy-to-lossless compression while achieving high lossless compression ratios on microarray images. The performance of JPEG2000 has been tested on three real data sets at different compression ratios, ranging from lossless to 45:1. The effects of JPEG2000 compression/decompression on differential expression detection and phenotype classification have been examined. There is less than a 4% change in differential detection at compression rates as high as 20:1, with detection accuracy suffering less than 2% for moderate to high intensity genes, and there is no significant effect on classification at rates as high as 35:1. The supplementary material is available at http://gsp. tamu.edu/web2/Compression. Keywords
Microarray · Classification · Compression
1 Introduction The cDNA microarray technology can monitor the transcript production of thousands of genes simultaneously, thereby Q. Xu · Z. Xiong · E. R. Dougherty (B) Department of Electrical and Computer Engineering, Texas A&M University, College Station, TX, USA e-mail:
[email protected] J. Hua · M. L. Bittner · E. R. Dougherty Translational Genomics Research Institute, Phoenix, AZ, USA
providing a powerful enabling tool for genetic research and drug discovery. In particular, microarray data can be used to perform phenotype classification via different gene expression patterns. Classification can be between different types of cancer, different stages of tumor development, or a host of such differences. Correct classification of tumor cells is essential for highly discriminatory molecular-based diagnosis and reliable future treatment. This requires designing a classifier that takes a vector of gene expression levels as input, and outputs a class label that predicts the class containing the input vector. While here we are focusing on cancer discrimination, microarrays are being used in practically every area of medicine. One of the most basic applications is the discovery of genes that are differentially expressed under some pathological condition, so that this aberrant gene behavior can be used as a biomarker for the condition. In this context, a classifier is a biomarker dependent on a panel of genes rather than a single gene. The ultimate purpose of classifying diseases at the molecular level is to devise personalized diagnoses and therapies specific to a patient’s genetic make-up, rather than using the current strategy of applying a sequence of treatments, each known to work for some minority of the population, in hope that one of them applies to the current patient. Moreover, although we will not discuss it in the present paper, gene-expression data are being used to develop gene regulatory models that can be used to study the dynamics of gene regulation and derive treatment policies based on altering the long-run control of these dynamics. Relative to engineering, these various investigations constitute the bulk of the emerging area of genomic signal processing [1,2]. Typical microarray images are very large. For instance, the Agilent 22K human oligo microarray can contain over 51 MB (MegaBytes) of data with both red and green channels. With the numbers of microarrays in experiments increasing
123
SIViP
as the cost goes down, the effect of transmission bandwidth limitations in conjunction with the need for efficient distribution and storage of such enormous amounts of information are becoming an important issue. Therefore, it can be beneficial to apply compression technology to microarray images to alleviate the transmission burden for data sharing and save storage space. To achieve significant compression, lossy techniques are necessary. In this paper, we study the effect of microarray image compression on expression-based classification. We apply the current standard JPEG2000 [3] image coding algorithm based on the wavelet transform to microarray images from real specimens. Gene expressions are extracted from the JPEG2000 decompressed images, features are selected, a classifier designed, and the misclassification error rate is calculated using cross-validation. This is done for several different datasets at increasing compression ratios, with results compared to those obtained in an identical manner from the original uncompressed microarray datasets. The effect of lossy compression is evaluated in terms of both the misclassification error rate and feature-selection. Three points should be recognized: 1. Because lossless compression is important for medical images in general and microarray images in particular (for feature selection and classification), it is reasonable to consider the international standard JPEG-LS1 [4] for lossless image compression. However, since our focus is on efficient distribution and storage of large numbers of microarray images, we are primarily concerned with high compression ratios that go well beyond what lossless compression can achieve. 2. An advantage of using JPEG2000, the current international standard for image compression, is that it achieves much better compression efficiency than JPEG and its software is also publicly available on the web, and therefore the results of this study can be easily reproduced and conclusions on the effect of lossy compression can be readily applied in practice. 3. The main reason for employing JPEG2000 is its high compression efficiency and rich set of functionalities (e.g., embedded coding and lossy-to-lossless compression).2 Since we do not observe any significant advantage of using compression algorithms (e.g., [5,6]) specifically designed for microarray images, we claim that the versatile JPEG2000 is sufficient for microarray image compression. 1
Although JPEG-LS has a near-lossless mode, we limit ourselves to its lossless mode throughout this paper.
2
“Lossy to lossless” refers to graceful degradation and scalability in progressive video compression schemes. The decoder can recover a lossy version of the source with partial encoded bitstream and a lossless one with the full bitstream.
123
2 Systems and methods 2.1 Description of test microarray images Three datasets are used in this study. The first microarray image set is generated based on Agilent’s 22K Human Oligo Microarray platform. The size of these images in each channel is 2,160 ×6,100, and the resolution is 16 bits/pixel (bpp). Thus, 51 MB are required to store one two-channel microarray image. There are 19 microarrays from patients with breast cancer and 24 microarrays from patients with ovarian cancer. Both the original images and decompressed images are processed by Agilent’s feature extraction software 8.1 with the default setting: no background subtraction is applied during intensity extraction and lowess normalization is applied after linear scaling of each dye channel. For comparison, they are also processed with local background subtraction where pixels not segmented as spots are used to model the background. In each microarray image, there are 21,073 data spots whose log-ratios are extracted and analyzed, and 1,081 control spots used only in gridding and normalization. The second and the third microarry image sets were retrieved from the Stanford MicroArray Database (SMD) at http:// genome-www.stanford.edu/microarray. The second set was generated in the microarray experiments of [7] to identify two major histological phenotypes of breast cancer, invasive ductal carcinoma (IDC) and invasive lobular carcinoma (ILC). RNA from 21 ILCs and 38 IDCs were amplified and hybridized to a ∼42,000 clone cDNA microarray. The predictive analysis of microarrays (PAM) [8] was performed in [7] to identify differentially expressed genes that succinctly distinguish these two phenotypes. The third set of microarrays is the published data from [9]. In that work, cDNA microarrays were created to identify gene expression profiles related to fms-like tyrosine kinase 3 (FLT3) status in childhood acute myeloid leukemia (AML). There are 24 diagnostic specimens that have FLT3 mutations with internal tandem duplications (ITDs) and 36 with FLT3 wild-type (FLT3-WT). PAM was also carried out to identify genes that differentiated FLT3-ITD from FLT3-WT cases in [9]. 2.2 Image compression Image compression techniques generally fall into two categories: lossy and lossless compression. The former generally achieves higher compression ratios than the latter. For lossless compression, the common method to archive microarray images is to store them losslessly in TIFF format with LZW compression [10,11]. This approach does not exploit the 2D correlation among image pixels and has low compression efficiency. The JPEG-LS (part 1) lossless image compression standard was developed by incorporating the LOCO-I
SIViP
algorithm [12], which employs prediction-based coding and has low computational complexity. The average lossless compression ratio with either LZW compression or JPEG-LS is typically 2∼3:1 for all classes of images (including microarrays), which is not high enough considering the large size of microarray images. 2.2.1 Wavelet image coding and JPEG2000 Wavelets [13,14] are tools for decomposing signals, such as images, into a hierarchy of increasing resolutions: considering greater numbers of resolution layers gives an increasily detailed look at the image. Different from a Fourier decomposition, which only gives a frequency representation, a wavelet image decomposition offer a space–frequency representation. When integer wavelet transforms are used, the wavelet image representation also has integer precision, making it feasible to realize lossless compression with competitive compression ratios. The wavelet representation prompted the study of new quantization strategies (for lossy image compression) to exploit this underlying space-frequency image characterization. Shapiro [15] made a breakthrough in 1993 with his embedded zerotree wavelet (EZW) coding algorithm. Since then a new class of algorithms has been developed that achieves significantly improved performance over the EZW coder. In particular, Said and Pearlman’s work on set partitioning in hierarchical trees (SPIHT) [16], which improves the EZW coder, proves to be very successful for both lossy and lossless compression. In response to the success of EZW and SPIHT, the International Standards Organization (ISO) Joint Photographic Expert Group (JPEG) adopted the wavelet transform as the workhorse in the current JPEG2000 image coding standard [3]. The baseline JPEG2000 coder employs the embedded block coding with optimized truncation (EBCOT) [17] algorithm for bit-plane coding of wavelet coefficients. The JPEG2000 coder performs competitively with most other coders published in the literature, while possessing desirable functionalities such as lossy and lossless compression (when integer wavelet transforms are used), scalability in rate and image resolution, region-of-interest coding, and error resilience. 2.2.2 JPEG-LS versus JPEG2000 for lossless microarray image compression Compared to the wavelet-based JPEG2000, JPEG-LS has lower computational complexity since it is based on predictive coding. It usually gives slightly higher compression ratios than JPEG2000 (in the lossless coding mode) on natural images. For the three microarray datasets described in Sect. 2, Table 1 lists the average lossless compression per-
Table 1 Lossless compression results (in bpp) from JPEG-LS and JPEG2000 on three sets of microarray images represented with 32 bpp before compression Data set
JPEG-LS
JPEG2000
1
11.48
12.48
2
16.95
18.21
3
17.14
18.48
formance of JPEG-LS and JPEG2000 (with the default biorthogonal 3/5 filters). It is seen that JPEG-LS performs a bit better (1∼1.34 bpp) than JPEG2000 as well on the microarray images. However, because JPEG2000 can generate a single embedded bitstream that enables lossy-to-lossless recovery of the original image when using integer wavelet transforms, it is more widely supported than JPEG-LS. 2.2.3 Microarray image specific compression algorithms Because microarray images have black background and bright foreground with high variability only in designated spots, instead of using the generic JPEG2000 standard, one can tailor-design compression algorithms to exploit the specific geometric structure of microarray images. One such algorithm, which is rooted in LOCO-I [12] and called segmented LOCO (SLOCO), was introduced in [5]. It enables lossy-to-lossless compression by employing a two-tier coding strategy that first encodes microarray images lossily with near-lossless compression and then applies bitplane coding to the quantization error to refine the coding results until lossless compression is achieved. SLOCO can generate a partially progressive bitstream with a minimum bit rate determined by the compression of the first tier, and coding is conducted on the foreground and background separately. Another lossy-to-lossless compression algorithm specifically designed for microarray images is called BASICA [6]. It uses a fast Mann–Whitney test-based algorithm [18] to segment cDNA microarray images, and performs postprocessing to eliminate the segmentation irregularities. The segmentation results, along with the foreground and background intensities obtained through background adjustment, are used for independent compression of the foreground and background. Compression is realized by modifying the EBCOT algorithm [17] used in JPEG2000 to achieve optimal rate-distortion performance in lossy coding while still maintaining outstanding lossless compression performance. Table 2 compares the lossless compression results of JPEG-LS, JPEG2000, BASICA, and BASICA without intensity and bit shifts (denoted by BASIC w/o shifts) on the first microarray image (with 16 bpp for each of the red and green components) of the second dataset described in Sect. 2. It is
123
SIViP Table 2 Lossless compression results (in bpp) of different coders on the first microarray image (represented with 32 bpp) of the second dataset described in Sect. 2 JPEG-LS
JPEG2000
BASICA
BASICA w/o shifts
16.02
16.73
16.38
15.97
seen that BASICA performs slightly better than JPEG2000 while BASICA w/o gives the best lossless compression result, beating JPEG-LS. This finding is consistent with results reported in [6] on cDNA microarray images. However, BASICA and BASIC w/o shifts can only be applied to gridded microarrays, which require human intervention for accurate grid alignment and spot finding. In addition, the high complexity of BASICA (due to the iterative nature of Mann– Whitney test-based segmentation [18] and time-consuming morphological pruning) makes it unsuitable for real-time applications. This is the main reason why we only report results on one microarray image in Table 2. In summary, although JPEG-LS achieves slightly higher compression ratio than JPEG2000, it lacks the attractive functionality of lossy-to-lossless compression. On the other hand, BASICA gives the best lossless compression result while enabling embedded compression, but its complexity is much higher than that of JPEG2000. Thus JPEG2000 offers the best tradeoff in terms of functionality, compression performance, computational complexity, and availability. This leads to our choice of JPEG2000 as a fully automatic standard algorithm for compression of microarrays in this study.
2.3 Accuracy of differential expression detection We first consider the classification of genes with outcomes classified as up-regulated, down-regulated, and invariant according to their expression levels. A simple quantitative model of gene expression data analysis is assumed, and we decide that if the log-ratio is smaller or larger than a certain threshold range [−θ, θ ], then the spot is down- or up-regulated, respectively; otherwise, it is invariant. To evaluate the effect of microarray image compression, an identification disagreement is defined as a different classification outcome after a lossy reconstruction. The identification disagreement rate is calculated as the average fraction of genes that show identification disagreement. To detect any intensity-dependent trends in identification disagreement, a threshold β is introduced. When calculating the identification disagreement rate, only the genes with two-channel product intensities above β in the original uncompressed image are considered.
123
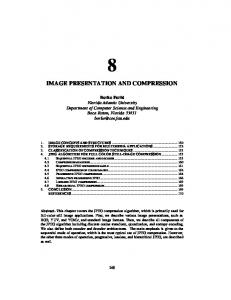
2.4 Effect on expression-based classification For the second dataset, the microarray images of the 21 ILCs and 38 IDCs were downloaded from the SMD, with two TIFF images corresponding to red and green channels for each sample. These uncompressed TIFF images were compressed and decompressed separately using JPEG2000 at compression ratios ranging from lossless to lossy at maximum 45:1 compression ratio. The average lossless compression ratio, r0 , with JPEG2000 for this dataset is 1.76:1. Figure 1 shows part of the decompressed microarray images of the first ILC (red channel) at lossless compression (1.90:1) and lossy compression ratio 5:1, 10:1, and 20:1. There are altogether 11 sets of images: the original image set S and the ten sets of decompressed images Sr at compression ratios r = r0 for lossless, and r = 5, 10, 15, . . . , 45 for lossy. Each set contains 59 2-channel images, and these are extracted using GenePix Pro6.0 software with the default setting. For each sample, 42,000 gene log-ratios were extracted, and low quality and non-informative genes were then filtered out. Only spots with fluorescent signal at least M-fold greater than the local background were included in the analysis. Genes that do not meet this criterion for at least 80% of measurements across all samples were excluded from further analysis. Also, for each set of samples, genes were selected for further analysis if they display at least M-fold variation from their mean expression value, in at least one sample. This process was repeated for the original image set S and the 10 decompressed sets Sr (Sr0 being the losslessly recovered version). Approximately 20,000 (M = 4) or 35,000 (M = 2) out of the 42,000 genes were selected for each set before performing classification. We can estimate missing values across the selected genes for all the samples using the k nearest neighbor (kNN) impute engine as published [19], or we can simply set them to zero for simplicity.3 As to the third dataset, the microarray images of the 21 FLT3-ITDs and 32 FLT3-WTs were downloaded from the SMD, with two TIFF images corresponding to red and green channels for each sample. The average lossless compression ratio, r0 , with JPEG2000 for the this dataset is 1.73:1. We found that three microarrays of FLT3-ITDs and four of FLT3WTs generated run-time errors when being analyzed with GenePix Pro6.0. Thus, they were removed from the experiments. We further compressed the images and pre-filtered the genes as we did for the second dataset. Cross-validation was used for error estimation, and 3NN and linear discriminant analysis (LDA) for classification rules. Two approaches were employed to find the optimal feature set before building the classifier. In the first approach, two-sample t-test was used to identify genes that are 3
In the paper we will refer to this method as “without filling missing values”.
SIViP Fig. 1 Part of the decompressed microarray images of the first ILC sample (red channel) after a lossless compression, b 5:1 compression, c 10:1 compression, d 20:1 compression. The original size is 5, 556 × 1, 904, and only 175 × 175 pixels are shown. Intensity adjustments were applied in order to show the image clearly
differentially expressed across the two classes. A p value of the t-test was computed for each gene, and the genes with the D smallest significance values were chosen for classifier design. The maximum of D is 50 in our experiments. For the second approach, we considered the performance of the popular sequential floating forward search (SFFS) [20] algorithm. To reduce the computational complexity of SFFS, the t-test was used as a first-round feature-selection to filter the 20,000 genes down to a smaller set of D1 genes. SFFS was then performed to select the best D (D < D1 ) genes among the D1 genes. D1 = 500 and the maximum of D is 20 in the experiments. Bolstered resubstitution error estimation was used inside the SFFS loop for LDA and semi-bolstered resubstitution for 3NN. With nearest neighbor classification rule, a sample is classified based on a majority vote of the classes of its neighbors in the feature space. The LDA classification uses linear discriminant functions of features to separate the samples into different groups. After feature-selection, a 3NN or LDA classifier was designed using the training samples
with the D features as input, and the misclassification rate was calculated for the designed classifier over the hold-out testing samples and averaged over the total number of folds (11 for the second data set and 10 for the third data set). This process was repeated 20 times for every data set to reduce the variation caused by cross-validation.
3 Discussion 3.1 Accuracy of differential expression detection Experiments to evaluate the effect of compression on the accuracy of differential expression detection have been carried out on the 19 breast cancer samples and 24 ovarian cancer samples in the first dataset after lossy-to-lossless compression with JPEG2000 (with the default biorthogonal 3/5 filters) and the results (with and without background subtraction during feature extraction) are shown in Table 3. The
123
SIViP Table 3 The disagreement rate versus the compression ratio for (a) the 19 breast cancer samples and (b) the 24 ovarian cancer samples without background subtraction. The results with background subtraction for these two sets are shown in (c) and (d) respectively β
10:1
20:1
30:1
3.2 Effect on expression-based classification
40:1
(a) 0
0.0197
0.0387
0.0620
0.0819
5.5
0.0070
0.0170
0.0311
0.0451
6.8
0.0042
0.0104
0.0181
0.0265
8.2
0.0020
0.0054
0.0099
0.0132
0
0.0194
0.0371
0.0567
0.0785
7
0.0045
0.0102
0.0165
0.0272
8.4
0.0024
0.0053
0.0089
0.0139
9.9
0.0012
0.0027
0.0044
0.0071
(b)
(c) 0
0.0207
0.0438
0.0770
0.1048
4.5
0.0101
0.0275
0.0586
0.0858
6.4
0.0048
0.0133
0.0266
0.0452
8.1
0.0022
0.0062
0.0121
0.0178
(d) 0
0.0222
0.0433
0.0686
0.0986
6.1
0.0069
0.0164
0.0279
0.0507
8.1
0.0033
0.0071
0.0115
0.0185
9.8
0.0019
0.0030
0.0052
0.0091
For instance, in Table (a), the values of β are chosen as 0, 5.5, 6.8, and 8.2 such that the percentages of genes with log product-intensities above them are 100, 75, 50, and 25% respectively
average lossless compression ratio r0 for the 19 breast cancer samples is 2.60:1 and that for the 24 ovarian cancer samples is 2.53:1. The log-ratio threshold θ is chosen to detect a fold change of two or larger. The four thresholds are chosen for β such that the percentages of genes with product-intensities above them are 100, 75, 50, and 25% respectively, while the total number of genes is 21,073. This provides identification disagreement rate changes over genes with different log product-intensity thresholds. It is seen from the table that the results of the two cancer types are quite consistent with each other. At a fixed compression ratio, higher intensity genes have lower identification disagreement rate, showing that JPEG2000 is more capable of compressing high intensity genes without causing identification disagreement. The identification disagreement rate for all genes monotonically increases with the compression ratio, but even for the lowest value of β, with 100% of the intensities exceeding it, the disagreement rate is still under 4.5% at 20:1 compression for both sets with or without background subtraction. For β chosen so that 75% of the intensities exceed it, the disagreement
123
rate remains under 9% at 40:1 compression, and under 3% at 20:1 compression rate, for both sets.
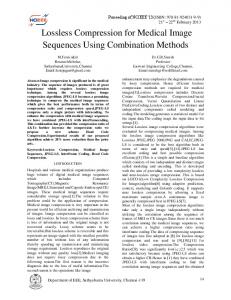
All experimental results with the two classifiers and two feature-selection methods for S and Sr at r = r0 , 5, . . . , 45 are all available in the supplementary website. To clearly explain the results and their interpretation, we will focus in detail on using t-test/t-test + SFFS feature-selection and LDA classifier for S, Sr0 , S10 , S20 , S30 , and S40 . As a classic linear classifier, LDA is expected to have comparable or slightly worse performance to the PAM used in both [7] and [9], which is a modified linear discriminant analysis regulated through the idea of nearest shrunken centroids [21]. To evaluate the effect of lossy compression, we first considered the misclassification error rates for different sets at various feature sizes, and the results are shown in Fig. 2. Only results with M = 4 and without filling missing values are shown here; other results can be accessed at the complementary website. For the second dataset, the PAM analysis performed in [7] indicates that the misclassification error is 0.15 with 45 genes. Our experiment with the original image set S shows that the minimum error rate is about 0.17 at feature-size 21 (in Fig. 2a). These two results are very close considering that the error estimator used in [7] is resubsitution, which is typically low-biased. For the third dataset, the misclassification error is 0.11 by the PAM analysis with 24 ITDs and 32 WTs performed in [9], while our best result is around 0.20 with less than 20 genes. This difference may be due to both the seven unavailable samples and the low bias of resubsitution error estimation. In the case of lossless compression with JPEG2000, the microarray images are the same as the original image, so the difference between the “Original” and “Lossless” curves in Fig. 2 shows the inherent variance of cross-validation. We see that this variance is not large after 20 repetitions of cross-validation, as these two curves are quite close. The error rates after lossy compression can be either smaller or larger than that of the original image at different featuresizes, but in general they show very similar trends as in the original. It is interesting to notice the typical peaking phenomenon with the LDA classifier, that is, the error declines as the number of features grows to a certain point and then begins to increase as the number of features increases beyond that point. For example, in Fig. 2c, the curve reaches the minimum 0.20 with 8 genes being selected, and then gradually increases as more features overfit the data. But if t-test + SFFS is used instead of t-test for feature selection, then the curves quickly reach a minimum at a fairly small feature-size and then become very flat afterwards. The salient observation is that a higher compression ratio (or more loss due to compression) does not necessarily deteriorate classification
SIViP 0.4
0.4
0.35
0.35
Original Lossless 10:1 20:1 30:1 40:1
0.3
0.25
Testing error
Testing error
Fig. 2 Misclassification rate for the second dataset with LDA classifier and a t-test feature selection, b t-test + SFFS feature selection. Misclassification rate for the third dataset with LDA classifier and c t-test feature selection, d t-test + SFFS feature selection
0.2
0.15
Original Lossless 10:1 20:1 30:1 40:1
0.3
0.25
0.2
0.15
0.1
0.1 0
5
10
15
20
25
30
35
40
45
0
50
2
4
6
Number of features
8
0.45
0.45
0.4
0.4
0.35
0.35
Testing error
Testing error
0.5
0.3 0.25 0.2
Original Lossless 10:1 20:1 30:1 40:1
0.15 0.1 0.05 10
15
20
25
30
35
Number of features
(c) performance. The curve at 30:1 shows superior performance in Fig. 2a, but is the worse one at feature-size 10–30 in Fig. 2c. This kind of result is not unusual. For instance, lower image resolution often results in better classification accuracy. In our case, image compression/decompression acts as a nonlinear lowpass filter that may help classification by reducing inherent noise in the image due to microarray production. Whether or not the compression/decompression benefits or degrades classification depends on the relationship between noise reduction and loss of image information—an extremely difficult and not well understood relationship in the case of nonlinear filters. 3.3 Hypothesis testing Having visually shown that there appears to be no systematic degradation in classification performance owing to even high compression ratios, we will now employ hypothesis testing to statistically evaluate the significance of the differences that do exist. Let Er,d be the set of 32 misclassification errors with the microarray images at compression ratio r and feature size d, where each error is obtained under one of the following combinations: (1) the second or the third data set, (2) M = 2 or M = 4 (recall that M denotes the fold change threshold used during gene pre-filtering of the microarray images), (3) fill in missing values with k NN method or simply set missing values to 0, (4) LDA or 3NN classification
14
16
18
20
40
45
16
18
20
Original Lossless 10:1 20:1 30:1 40:1
0.3 0.25 0.2 0.15 0.1 0.05
0 5
12
(b)
(a) 0.5
0
10
Number of features
50
0
0
2
4
6
8
10
12
14
Number of features
(d) rule, and (5) t-test only or t-test + SFFS for feature selection. E d is the similar set of 32 misclassification errors with the original microarray images. Distribution-free tests are carried out between Er,d and E d with the null hypothesis H0 being that the mean difference of the two sets is 0. For each test we compute the p value relative to the null hypothesis. A small p value indicates that compression significantly changes classification performance and the null hypothesis should be rejected. We list the p values of the hypothesis tests at feature sizes d = 4, 8, 12, 16, 20 for compression ratios r = r0 , 10, 20, 30, 40 in Tables 4 and 5 using sign test and signed-rank test, respectively. Both tests can be used for paired sampling, while the latter one requires that the random-variable difference possesses a symmetric distribution. The suitability of the signed-rank test is indicated by the distribution of the differences, as shown on the complementary website. We observe that the hypothesis test results with the two methods are consistent with each other: they both give high p values at low compression rates and the only very low p value occurs in the same case: d = 4 and r = 40. This indicates that even high ratio lossy compression of the microarray images will significantly change (or degrade) the classification performance if only a small number of features are used. Note that the p values for lossless compression r = r0 are not always 1 due to the variation introduced by cross-validation error estimation, although Sr0 is the same as S.
123
SIViP 50
Table 4 The p value of the sign test between Er,d and E d Feature size
4
8
12
16
20
lossless
0.8601
0.2153
0.4731
0.5966
1.0000
10:1
0.8601
0.5966
1.0000
0.8601
0.3771
20:1
0.5966
0.3771
0.3771
0.3771
0.2153
30:1
0.1102
0.2153
0.2153
0.8601
0.8601
40:1
0.0021
0.5966
0.8601
0.3771
1.0000
Lossless 10:1 20:1 30:1 40:1
45
Table 5 The p value of the signed-rank test between Er,d and E d
Number of overlapped genes
40 35 30 25 20 15 10
Feature size
4
8
12
16
20
5
lossless
1.0000
0.2103
0.5967
0.6136
0.6808
0
10:1
0.2781
0.7791
0.3795
0.8517
1.0000
20:1
0.5496
1.0000
0.4774
0.9255
0.7084
30:1
0.0615
0.1499
0.5249
0.4322
0.5876
50
40:1
0.0014
0.1162
0.7506
0.3897
0.5876
45
0
5
123
20
25
30
35
40
45
50
35
40
45
50
(a)
Number of overlapped genes
In addition to finding an actual classifier to distinguish between tumor classes, a second goal is to identify genes that make up the variables for classification, the idea being that identifying genes useful for classification can be a first step in identifying the mechanisms underlying the differences between the two phenotypes. While this reasoning is certainly plausible, one cannot jump to the conclusion that there is some gold-standard gene set that is going to be found when using feature selection. In fact, as has been discussed from several different perspectives, there are typically many gene sets providing many close-to-optimal classification rules, so that different data sets and different featureselection methods can yield very different gene sets [22–26]. In practice, the existence of many virtually equivalently performing gene sets results from a number of reasons: (1) there are millions of potential feature sets; (2) there is redundancy in cell regulation; (3) complex pathways mean that information is not localized; (4) and imprecise error estimation assures inaccuracy in ranking gene sets [26]. Since compression/decompression effectively alters the sample data, we should expect that feature ranking will be altered, although perhaps not to the extent seen when finding features from different samples, where there can be very little overlap between top-ranked features. To avoid the effects of cross-validation error estimation, we have ranked the genes based on the t-test using all sample data. Before considering the effects of compression, we note that, using the original image sets of both the second and third data sets, the results provided by the t-test exhibited substantial overlapping with those provided in the original studies. For the second data set, we found that the four top-ranked
15
Feature size
Lossless 10:1 20:1 30:1 40:1
40
3.4 Feature selection
10
35 30 25 20 15 10 5 0 0
5
10
15
20
25
30
Feature size
(b) Fig. 3 Feature selection results for a the second dataset and b the third dataset
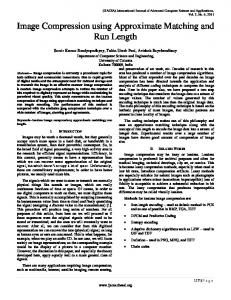
genes, CDH1, BAZ1A, UCK1, and FXYD3, picked by t-test were also selected by the PAM analysis as genes that separated IDCs and ILCs with the lowest overall misclassification rate in [7]. For the third data set, among the set of 65 features identified by the PAM analysis in [9], 22 were included in the top 50 genes found by the t-test. In the case of lossy compression, we are concerned with the comparison between G r,d and G d for d = 1, . . . , 50 and r = 10, 20, 30, 40, where G r,d is the set of the d top-ranked genes of image set Sr , and G d is the set of the d top-ranked genes of original image set S . The comparison of the number of overlapped genes between G r,d and G d vs. feature-size d for different r are shown in Fig. 3. The ideal curve would be the diagonal line (corresponding to lossless compression), which indicates that G r,d is identical to G d for each d. The results in Fig. 3a for the second dataset clearly demonstrate the impact of lossy compression. As in Sect. 3.2,
SIViP
only the case with M = 4 in pre-filtering and without filling missing values is considered. The curve with lossless compression is a diagonal line as expected, and the higher the compression ratio, the smaller the amount of overlapped genes for d > 20. At compression ratio 20:1, about 60% of the genes in G 20,d overlap with G d for each d. Similar observations can be made from Fig. 3b based on the third dataset. The number of common genes decreases with higher compression ratios. Around 75% of the genes in G 20,d also belong to G d , so it seems compression has less effect on feature-selection with this dataset than with the previous one. But in both cases, the number of common genes is more than is typically seen with different sample sets [26]. One can interpret these results in two different ways. In one sense, they indicate that compression/decompression filtering does not affect gene selection to the extent resulting from different sample sets. From a different perspective, given that compression/decompression has, for the most part, no meaningful effect on the accuracy of a designed classifier, the gene differences that do exist provide further evidence for the instability of selected features relative to slight changes in the data, for instance noise, and this instability is consistent with instability across different sample data sets. 3.5 Concluding remarks Based on the micrarray images utilized in this paper, even at high compression rates, 30:1 and greater, classification using the decompressed JPEG2000 microarray images is statistically no worse than would be achieved using the original uncompressed image. From an image processing perspective this means that lossy JPEG2000 compression does well at preserving the image characteristics relevant to intensity extraction and subsequent classifier design. From a classification perspective, at compression rates below 30:1, on average, one can do as well designing from the JPEG2000 decompressed images as from the original ones.
References 1. Dougherty, E.R., Datta, A.: Genomic signal processing: diagnosis and therapy. IEEE Signal Process. Mag. 22, 107–112 (2005) 2. Dougherty, E.R., Datta, A., Sima, C.: Research issues in genomic signal processing. IEEE Signal Process. Mag. 22, 46–68 (2005) 3. Taubman, D., Marcellin, M.: JPEG2000: Image Compression Fundamentals, Standards, and Practice. Kluwer, Dordrecht (2001) 4. ISO/IEC 14495-1, ITU Recommendation T.87, Information technology—Lossless and near-lossless compression of continuous-tone images (1999) 5. Jornsten, R., Wang, W., Yu, B., Ramchandran, K.: Microarray image compression: Sloco and the effect of information loss. Signal Process. 83, 859–869 (2003)
6. Hua, J., Liu, Z., Xiong, Z., Wu, Q., Castleman, K.: Microarray basica: Background adjustment, segmentation, image compression and analysis of microarray images. EURASIP J. Appl. Signal Process. 92–107 (2004) 7. Zhao, H., Langerød, A., Ji, Y., Nowels, K.W., Nesland, J.M., Tibshirani, R., Bukholm, I.K., Kåresen, R., Botstein, D., BørresenDale, A., Jeffrey, S.S.: Different gene expression patterns in invasive lobular and ductal carcinomas of the breast. Mol. Biol. Cell 15, 2523–2536 (2004) 8. Tibshirani, R., Hastie, T., Narasimhan, B., Chu, G.: Diagnosis of multiple cancer types by shrunken centroids of gene expression. Proc. Natl. Acad. Sci. USA 99, 6567–6572 (2002) 9. Lacayo, N.J., Meshinchi, S., Kinnunen, P., Yu, R., Wang, Y., Stuber, C.M., Douglas, L., Wahab, R., Becton, D.L., Weinstein, H., Chang, M.N., Willman, C.L., Radich, J.P., Tibshirani, R., Ravindranath, Y., Sikic, B.I., Dahl, G.V.: Gene expression profiles at diagnosis in de novo childhood aml patients identify flt3 mutations with good clinical outcomes. Blood 104, 2646–2654 (2004) 10. Ziv, J., Lempel, A.: Coding theorems for individual sequences via variable-rate coding. IEEE Trans. Inform. Theory 24, 530–536 (1978) 11. Welsh, T.: A technique for high-performance data compression. IEEE Comput. Mag. 17, 8–19 (1984) 12. Weinberger, M., Seroussi, G., Sapiro, G.: The LOCO-I lossless image compression algorithm: principles and standardization into JPEG-LS. IEEE Trans. Image Process. 9, 1309–1324 (2000) 13. Strang, G., Nguyen, T.: Wavelets and Filter Banks. WellesleyCambridge Press, New York (1996) 14. Vetterli, M., Kovaˇcevi´c, J.: Wavelets and Subband Coding. Prentice-Hall, Englewood Cliffs (1995) 15. Shapiro, J.: Embedded image coding using zero trees of wavelet coefficients. IEEE Trans. Signal Process. 41, 3445–3463 (1993) 16. Said, A., Pearlman, W.: A new, fast, and efficient image codec based on set partitioning in hierarchical trees. IEEE Trans. Circuits Syst. Video Technol. 6, 243–250 (1996) 17. Taubman, D.: High performance scalable image compression with EBCOT. IEEE Trans. Image Process. 9, 1158–1170 (2000) 18. Chen, Y., Dougherty, E., Bittner, M.: Ratio-based decisions and the quantitative analysis of cDNA microarray images. J. Biomed. Opt. 2, 364–374 (1997) 19. Troyanskaya, O., Cantor, M., Sherlock, G. et al.: Missing value estimation methods for DNA microarrays. Bioinformatics 17, 520–525 (2001) 20. Pudil, P., Novoviˇcová, J., Kittler, J.: Floating search methods in feature selection. Pattern Recognit. Lett. 15, 1119–1125 (1994) 21. Tibshirani, R., Hastie, T., Narashimhan, B., Chu, G.: Class prediction by nearest shrunken centroids with applications to dna microarrays. Stat. Sci. 18, 104–117 (2003) 22. Ioannidis, J.P.: Microarrays and molecular research: noise discovery? Lancet 365, 454–455 (2005) 23. Dougherty, E.R., Brun, M.: On the number of close-to-optimal feature sets. Cancer Inform. 2, 189–196 (2006) 24. Ein-Dor, L., Kela, I., Getz, G., Givol, D., Domany, E.: Outcome signature genes in breast cancer: is there a unique set? Bioinformatics 21, 171–178 (2005) 25. Grate, L.R.: Many accurate small-discriminatory feature subsets exist in microarray transcript data: biomarker discovery. BMC Bioinformatics, vol. 6, 2005 26. Sima, C., Attoor, S., Braga-Neto, U., Lowey, J., Suh, E., Dougherty, E.R.: Impact of Error estimation on feature-selection algorithms. Pattern Recognit. 38, 2472–2482 (2005)
123