SELECTED TOPICS in SYSTEM SCIENCE and SIMULATION in ENGINEERING
The simulation of Hybrid logic in Reverse Logistic Network MOSÈ GALLO, TERESA MURINO, ELPIDIO ROMANO Department of Materials Engineering and Operations Management University of Naples “Federico II” P.le Tecchio – 80125 Napoli ITALY
[email protected],
[email protected],
[email protected] http://www.impianti.unina.it Abstract: The work define the methodology to design, on the base of the Reverse Logistics Network theories, a quantitative model that simulate the mechanism in which the citizen waste recovery flow to the citizen collection center, up to the Reprocessing Center for recycling and then the disposal. The model is based on System Dynamics concepts, simulated in iThinkR environment, in order to represent the PUSH/PULL hybrid logic for the management of WEEE (Waste Electrical and Electric Equipment) physical and informative flows. The model will be implemented and the simulation results will be analysed focusing on efficiency parameters, analysing the Current State Map and creating the Future State Map. Key-Words: - WEEE management, System Dynamics model, Hybrid manufacturing system, Vehicle routing problem.
1 Introduction
2 Definition and literature review
Problems related to the management of end of life durable products are faced. Those are electrical or electronic products that we definitely needed, maybe just since trendy, and then suddenly we need to through them out because not useful. Instead abandoning these products somewhere outside the place where we live, it is possible to assure a new place, a kind of reincarnation, through their recovery and then the recycling, reparation, refurbishment in order to allow the whole product, or only some components to have a more chance. To this purpose with this research work, the subjects related to an efficient WEEE recovery and treatment are studied. In this paper we analyse recovery mechanisms in order to achieve an effective great number of recycled appliances to be in tune with the sustainability concept, considering that the European Union target is 4kg/inhabitant for year. The tools that we have decided to use starting from the Reverse Logistics Network theories [1] representing the mechanism in which the citizen waste recovery flow to the citizen collection center, up to the Reprocessing Center for recycling and then the disposal in order to implement a profitable system. The model is based on System Dynamics concepts, simulated in iThink environment, in order to represent the PUSH/PULL hybrid logic for the management of WEEE physical and informative flows. Finally, the model will be implemented and the simulation results will be analysed focussing on efficiency parameters analysing the Current State Map and creating the Future State Map.
Main reasons pushing the enterprises to develop a reverse logistic system are summarised in the following three categories: ; Economic profits; ; Legislation pressures; ; The increasing of corporate citizenship. In other terms, the enterprises are interested on Reverse Logistics since they can get economical advantages and they feel socially motivated. In the reverse logistics the goal is to reorder a chaotic and variable return flow. Today the enterprises are trying to manage the reverse flow in a more scientific way [1, 19]. In the design of logistic system a reverse logistic must be considered, without it cannot be set a whole production plan. In this way an integral logistic chain including all product life cycle is obtained [3]. Rogers and Tibben-Lembke [10, 11] highlight that a good management of a Reverse Logistic can be considered a part of life cycle management. Forward and reverse logistic are considered together for tactical and operational choices, since are part of the same system. It follows the simultaneous management of physical, informative, and finance flows. Bowersox stress on the necessity to guarantee a strong integration degree among logistics parts: “The fundamental managerial objective is to achieve integration of all components in the logistical system”. The reverse logistics isn’t the mirror image: the different physical and informative flows require not homogeneous planning and management activities. Consequently many models and traditional logistical tools cannot be used in the Reverse Logistic. For this reason, as above mentioned,
ISSN: 1792-507X
378
ISBN: 978-960-474-230-1
SELECTED TOPICS in SYSTEM SCIENCE and SIMULATION in ENGINEERING
many authors prefer to manage the two different flows separately, independently, using different employees. Among the strategic elements for the reverse management flow there is the need to design a supply chain network. Most firms, for several reasons, are not able to develop autonomously all different reverse process activities. Firstly, expensive investments are necessary, and single firm cannot financial sustain. In the second place, the missed attainment of returns quantities, essential in order to trigger economy scale, can make the operations unfeasible. At last, the knowledge and competences required in the different phases are heterogeneous and therefore the firm in a difficult way can wholly accomplish them. It is indispensable a cooperative approach, not only with supply chain actors, but also with competitors and state institutions, often sponsor of an association. The participants to the net mainly are: ; the forward logistic chain actors (producers, distributors, retailers); ; the operators specialized in the reverse process (remanufactures); ; the “opportunistic players”, such as no profit organizations.
2.1 WEEE Management The European Directives, specifies ten WEEE categories: 1. large household appliances; 2. small household appliances; 3. IT and telecommunications equipment; 4. consumer equipment; 5. lighting equipment; 6. electrical and electronic tools (with the exception of large-scale stationary industrial tools); 7. toys, leisure and sports equipment; 8. medical devices (with the exception of all implanted and infected products); 9. monitoring and control instruments; 10. automatic dispensers. These categories are further grouped into five homogeneous clusters: WEEE in the same cluster must be handled in the same way so to easier manage them in the collection centers as concerns their collection, transportation and safety measures to be adopted: • Group 1 - Large cooling appliances, refrigerators, freezers, other large appliances for refrigeration and air conditioning; • Group 2 - Other large white goods: washing machines, dryers, dishwashers, cooking appliances, heaters, microwave ovens, electrical appliances for heating and other large electrical equipment; • Group 3 - TV and monitor; • Group 4 - Other: IT equipment, consumer equipment, small appliances, lighting, everything not explicitly present in the other groups; • Group 5 - light sources.
ISSN: 1792-507X
The Decree furthermore introduces some regulatory relieves for those affected by the legislation: • distributors have to recover electrical and electronic equipment when a new one is sold without any additional charge on the customer; • municipalities must manage collection centers and have close relationship to citizens. The latter must: • design and implement the WEEE collection systems throughout the country; • collect and ship WEEE to the suitable treatment facilities; • inform consumers, recycling and disposal centers about the proper WEEE disposal; • send regular communication to the Registry of Producers; • financing and manage the WEEE (deriving from professional and consumer markets) collection and recycling system. The EEE producers joined in voluntary non-profit consortium (Collective Systems). Each partnership had to take charge of a WEEE share equal to the market share of the producers who joined the partnership itself. To improve their performance, and to guarantee the same coverage throughout the country, a National Coordination Center was established, financed and managed by producers. Each consortium must adhere to the Coordination Center.
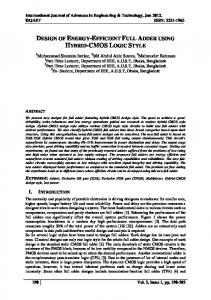
3 Problem Formulation In according to the current regulations, previously analysed, we define the way with waste reach the collection Center, in order to be transported to the treatment Center. The final user, when he needs to “generate” the WEEE, can choice between two different transfer good way to the collection center: 1. to call the collection house-to-house service of cumbersome waste; the waiting time is maximum two working days, depending on request time, if before or after 12.00 a.m.; 2. to autonomously transport the waste with owns vehicle to the closer collection center; The waste, once reached the collection center are going to be subdivided on groups (R1, R2, R3, R4 or R5), as well as stocked in proper containers. The collection center staff, achieved the maximum container capacity, calls the callcenter of the WEEE National Coordination Center in order to request the withdrawal of the related load. The latter sorts the order picking, carries out the load picking to the collection Center and then it transports the load to the treatment Center in order to dispose waste material [18]. As regards the studies previously discussed, relevant to a management WEEE flows system, like depicted in the flow diagram in the figure 1, it has been highlighted how many criticalities are present in the waste collection.
379
ISBN: 978-960-474-230-1
SELECTED TOPICS in SYSTEM SCIENCE and SIMULATION in ENGINEERING
In order to analyse it the Value Stream Mapping tool has been used. In order to build the CSM (Current State Map) the following hypotheses are done: ; The citizens of the various area of the plan are aggregated into a single point known as centroid; ; Every area has a single collection box whose capacity is equal to the sum of the single citizen collection Centers; ; The request house-to-house collection process of cumbersome wastes is hypothised of two days, since most requests happen before 12:00 a.m.; ; The distance between treatment Center to collection center has been calculated as the weighted average travel time; ; The average waiting time in the waste collection Centers for each centroid has been calculated with the ARENA simulation and optimization tool and it was obtained a optimal value considering 5 vehicles [18].
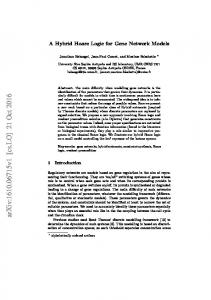
and then 'pulled', from downstream of the supply chain, i.e. it is the Treatment Center able to activate the 'collection/transport' of waste to the own center and, on the other side, leaving the push logic for the arrival waste system to the collection Center. In order to do that two tools: 'the supermarket' and 'the milk run' have been used. The delivery and the multiple pickings, among the different manufacturing industries, by the 'milk-run' vehicles, allows to avoid store of material in order to optimise a vehicle that only links two companies at once. The 'milk-run' vehicle turns more times during a day among different firms, delivering or collecting at every step instead of making dedicated travels to 'load/reload' to only one company in only one day.
Fig. 1 – CSM in the South Italy area
Fig.2 – From direct input/output transportation to milk run
The figure highlights the great difference between the activities at added value and the ones at not. Waiting time of WEEE at collection center is an activity at not added value weighing for the 30% out of total value. Besides, it is possible to highlight a problem of fluidity of information flow marking the process. Then, all criticalities here highlighted are the starting point for the introduction of hypotheses in order to improve the management of WEEE physical and informative flows.
The logic of many aggregated small travels, rather than individual and heavy travels, allows to decrease the warehouses inventory levels, optimizing the materials delivery travels and it also achieves a sensible value stream improvement. Now it is possible to introduce the hybrid logic created for the WEEE management flow system related to the nine districts of interest and to the treatment Center.
4 The hybrid logic: from push to push/pull From the analysis of WEEE management flow system, it has been concluded that the average waiting time of waste in the collection Center is the main activity at ‘not added value’ which affect the total time. This activity, notably its high execution time, is a consequence of management choice of waste process 'collection/request’ about a pull logic. The request for withdrawal from the Collection Center staff only occurs after the warehouse reach the capacity. It would like to change, thus, the management waste system from the collection Center to the Treatment Center about a pull logic; this means, that the system is activated,
ISSN: 1792-507X
Fig. 3 – FSM (Future State Map) in the hybrid logic hypothesis
4.1 Conceptual model Let’s refer to the same geographical area (south of Italy), as defined in [18], in order to be able to compare the obtained results to the previously defined ones.
380
ISBN: 978-960-474-230-1
SELECTED TOPICS in SYSTEM SCIENCE and SIMULATION in ENGINEERING
The proposed modifications and changes can be summarised as follows: ; law decree introduction “one against one”: the waste coming from an equivalent electrical and electronic appliance purchased in specialized stores part of organised distribution chains; ; sending/reception system arrangement of WEEE requests; ; supermarket placed in strategic places for waste picking by the Treatment Center. ; WEEE picking definition through the milk run; Such splitting is justified since the electrical and electronic appliances seller must assure just at the purchase time the free picking of the equivalent appliance, and then to send the collected waste to the common Collection Center where his store is located. For this reason the Collection Center function is quite transformed; the waste will arrive to it managed with push logic: that is only when the container is full, waste will be sent to Supermarket and no more to Treatment Center. The Treatment Center will change the role, as matter of fact, introducing the pull logic will allow the downstream request picking of a supply chain. Then, an informative flow between Treatment Centers and Supermarkets in different geographical area is developed. The Treatment Center will carry out a kind of WEEE disposal activity, depending on the production rhythm, to the achievement of a given waste thresholds even available, then it will send a supply request to the related supermarket, answering on the basis of their inventory levels. At this point a milk run in order to recovery WEEE from Treatment Center and then their physical flow will be triggered. The Treatment Center will send their owns vehicle at the closer Supermarket. If it will be able to satisfy their own request, picking only from the latter, depending on the previously received information, it will make the means of transport returning to the Treatment Center, otherwise they will be go to other Supermarkets in order to satisfy the remaining request.
5 Model Construction A very important phase is data selection and acquisition. The purpose of case study is only waste belonging to R1 and R2 categories, related to the nine south Italy districts (provinces): Napoli, Caserta, Salerno, Avellino, Benevento, Matera, Potenza, Cosenza, Crotone. The considered time is the year 2009. Province Centroid
Residents
Population %
MT
203.804
30
61.141
67.255
PZ
386.944
58
224.428
246.870
ISSN: 1792-507X
Users
733.494
58
425.427
467.969
KR
173.351
14
24.269
26.696
AV
439.707
71
312.192
343.411
BN
289.057
71
205.230
225.754
CE
903.660
71
641.599
705.758
NA
3.074.208
71
2.182.688
2.400.956
SA
1.105.847
71
785.151
863.667
Table 1 – WEEE and population distribution in the study area
With regard to the equipments of R1 and R2 categories, we record the following percentage: ; washer – 37,5%; ; fridge – 22,5%; ; dishwasher – 15%; ; microwave, oven, cooking tops – 10%; ; air conditioner – 5%. Instead, as regards to the question “what are the motivations that have led you to buy a new household appliance/electronic device?”, the sample of survey answered as follows: ; out of necessity, replacement – 60%; ; since it can be of great use, helpful – 12%; ; improving life – 10%; ; in order to reduce consumptions, increase performances – 10% ; if there are incentives – 5%; ; for pleasure, amusement – 3%. Finally, it has been found that the technology products purchase channels mostly used by Italian families are the follows: ; Specialized store – 42,5% ; Shopping Center/Supermarket/Hyper market – 37,0% ; Random, without rules – 19,7% ; Discount - 0,1% ; Local market – 0,6%
5.2
5.1 Data analysis
CS
System Dynamics model
Below the representation and the WEEE flow management process explanation, applying the push/pull logic, is carried out [2, 4, 5].
waste (kg)
381
ISBN: 978-960-474-230-1
SELECTED TOPICS in SYSTEM SCIENCE and SIMULATION in ENGINEERING
In the previous figure the required supply of Treatment Center model is represented. The Treatment Center is represented as stock variable, related to the exit flow suggested from the carried out daily disposal, and the input flow as the sum of the picking coming from the three different Supermarket. When the Treatment Center reaches the reorder point, that is dropping below it, a “request event”, addressed to all Supermarkets, giving a supply priority at closer Supermarket. Only when the Treatment Center cannot satisfy the request, then a second “request event” addressed to alternative Supermarkets is going to [12, 13, 14, 15, 17]. Fig. 4 – Sample model of WEEE management in the hybrid logic
5.2.1 Treatment Center request - Routing submodel Let’s consider the treatment Center operates two hundred days per year, five days per week, for one daily shift of 8 hours. Let’s define the daily disposal treatment Center rhythm through a RANDOM function, equal to a RANDOM (4000, 5000); that is, let’s suppose the treatment Center disposal capacity included between 4000 kg and 5000 kg. Once defined the production rhythm, and, then, since the treatment Center is the peacemaker of our reverse logistics, identified as a stock variable, the reorder point (ROP) is defined as the stock necessary to the Treatment Center in order to cover the supply lead time, when it reach a stock out situation. The Treatment Center capacity is of about 30.000 kg of waste per week. The ROP calculation is conducted as follows: EDDLT = C × LT (1) where EDDLT represents the expected average consumption of waste quantity during transportation lead time and LT represents the time necessary in order to make the Treatment Center to be supplied by Potenza, Salerno and Napoli Supermarkets, and we suppose to be equal two working days; ROP = EDDLT + SS (2) where SS is safety stock. Then the reorder point will be equal to the expected average consumption during the supply lead time, added to a safety stock, assumed equal the 10% of it.
5.2.3 Supermarket Management submodel As it is possible to note through the following figures, each Supermarket is identified by a stock variable. Inside of each Supermarket converges waste coming from the Collection Center once reached the threshold of 3500 kg, whereas waste coming from the Distribution Centers are removed on request from the Supermarkets itself. The waste arrival to the Collection Center, as well as to the Distribution Centers, both managed as arrays in the model, is defined from a RANDOM function varying between a minimum and a maximum of daily waste, in order to make possible the Distribution Centers and the Collection Centers reaching.
Fig. 6 – Supermarket management
Each Supermarket, being a stock variable, as the Treatment Center, will be susceptible of a reorder point (ROP), previously defined. The supermarket capacity is always defined on the basis of maximum weekly waste. When reached the reorder point of each supermarket an event request will start, and it will be satisfied when there is a supermarket picking to the related distributors.
6 Results analysis Let’s assess the stock trend inside the Supermarket in order to verify if they are able to effectively satisfy the requests coming from the Treatment Centers. Fig. 5 – Information flow management
ISSN: 1792-507X
382
ISBN: 978-960-474-230-1
SELECTED TOPICS in SYSTEM SCIENCE and SIMULATION in ENGINEERING
Fig. 7 – Pattern of release and reintegration cycle at supermarket
As it is possible to depict from the figure, the Supermarket is never in stock out neither even less it overcomes the assigned capacity level [4, 5]. 6.1 PUSH logic comparison We drew up the results obtained thanks to the hybrid push/ pull logic [7]. Now, to test the validity of our theory, we’ll compare the level of Treatment Center development, obtained thanks to the above logic, with the one found by adopting the PUSH logic. This theory states that the Collection Center receives all kinds of waste, both those originating from one to one decree and those arising from the citizen appliance decay, without a corresponding purchase of an equivalent one. Then, each Collection Center, represented as a stock variable, has WEEE in input, generated to citizens. PUSH logic requires that each Collection Center at its achievement of a share threshold, equal to 3500 kg (depending on vehicle capacity), has to send the waste to the Treatment Center.
representative of the Push/Pull logic. Indeed, the adoption of Push logic, the Treatment Center has a quantity of disposed waste whose maximum is 10.000 kg of waste, while in hybrid logic such value increases at 30.000 kg. Moreover, the trend is on a typical impulse and has a frequency much lower than the push logic. Thus, actually the logic designed would improve the continuous flow to the Treatment Center. For the purpose of the simulation process, we are interested to define, furthermore the waste average stocking time within each supermarket to be compared with the critical value identified through the Current State Map equal to a waste average waiting time in the Collection Center of 92 standard hours. The index that better than others can operate efficiently on inventory assessment is the rotation rate index. This is the ratio between the material out of the warehouse in a defined time unit and the warehouse average stock in the same unit of time. The average stock is calculated as the difference between the sum of stocks at the beginning of the time period and the material input and output in the same time. In this regard, we note, through the table pad, shown in the figure below, the total picking from the Treatment Center at each supermarket within a year (first column) and a total pickings from the Treatment Centers at each supermarket within a year (last two columns) and the total input supermarket always referred to the same timeframe.
1: CdT Push 1:
7000
1:
3500
1:
0
1 1.00
1 92.00
Page 1
1 183.00
1 274.00
365.00 16.21
Days
lun 26 lug 2010
Untitled
Fig. 8 – Treatment Center trend in the push logic 1: Liv CDT 1:
Table 2 – Performance table representation
30000
1
1:
Then, the yearly rotation index is: pickings IR = GM
∑
15000
1
1:
0
1 1.00
92.00
Page 1
183.00 Day s
1 274.00
365.00 16.21
lun 26 lug 2010
where GM =
Untitled
RI
∑ 365 days ⋅ 20 ⋅10
Fig. 9 - Treatment Center trend in the hybrid logic (push/pull)
RI = input WEEE at CC + DC Picking − TC Picking
It is possible to see by the above graphs, changes in levels of CdT (Treatment Center), in the push case (fig. 8) is much lower than the one depicted in the figure below,
CC is Collection Center; DC is Distribution Center; TC is Treatment Center.
ISSN: 1792-507X
383
ISBN: 978-960-474-230-1
(3)
(4) (5)
SELECTED TOPICS in SYSTEM SCIENCE and SIMULATION in ENGINEERING
At the end of the simulation, the table pad will display the values of the arriving waste to the collection Center, to the distributor picking and to the picking at Treatment Center. These data, well developed, to calculate the average waiting stock time at each supermarket: 56 standard hors. The average stock time at each supermarket are much lower than those identified with the Current State Map. Comparing this value to the one obtained from the implementation of the Current State Map, there is a time reduction equal to 21%. Furthermore, although activities in non-added value are increased, through the introduction of the supermarket, the processing time is reduced from 140 standard hours to 110 standard hours. Finally, the reduction in the time line (represented in the Future State Map below) and, in particular, the WEEE waiting time in Supermarket, makes the system more robust to the waste flow increase expected in coming years, when the decree “one against one” will be running regularly.
Fig. 10 – Future State Map
References: [1] J. Sarkis, M. M. Helms, A. A. Hervani, 2009, “Reverse Logistics and Social Sustainability”, Wiley InterScience; [2] P. Georgiadis, M. Besiou, 2008, “Sustainability in Electrical and Electronic Equipment Closed Loop Supply Chains: A. System Dynamics Approach”, Journal of Cleaner Production; [3] J. Hesselbach, M. Ohlendorf, C. Herrmann, 2001, “Configuration of Recycling Networks for Enhanced WEEE RECICLING”, Institute of Machine Tools and Production Technology; [4] C. L. Lay, W.B. Lee, W. H. Ip, 2003, “A Study of System Dynamics in Just-in-Time Logistics”, Journal of Materials Processing Tecnology; [5] Q. Hao, W. Shen, 2007, “Implementing a Hybrid Simulation Model for a Kanban-based Material Handling System”, ScienceDirect; [6] N. Zheng, L. Xiaochun, 2009, “Comparative Study on Push and Pull Production System Based on Anylogic”, International Conference on Electronic Commerce and Business Intelligence;
ISSN: 1792-507X
[7] N. Zheng, L. Xiaochun, 2008, “Performance Comparisons of Supply Chain Between Push and Pull Models With Competing Retailers”, IEEE; [8] F. Shultmann, 2005, “Modeling Reverse Logistics Tasks Within Closed-loops Supply Chain: An Example From through Automotive Industry”, European Journal of Operational Research; [9] R. Gamberini, E. Gebennini, R. Manzini, A. Ziveri, 2010, “On the Integration of Planning and Environmental Impact Assessment for a WEEE Transportation Network-A Case Study”, Resources Conservation and Recycling; [10] Tibben-Lembke R.S., Rogers D.S., 2002, “Differences Between forward and Reverse Logistics in a retail environment”, Supply Chain Management: An International Journal, Vol.7, No.5,pp. 271-282. [11] Rogers D.S., Tibben-Lembke R.S., 1999, “Going Backwards: reverse logistics trends and practices”, Reverse Logistics Executive Council, Pittsburgh, PA. [12] Baptista S., Oliveira R. C., Zuquete E., 2002, “A period vehicle routing case study”, European Journal of Operational Research 139, pp. 220-229. [13] Barreto S., Ferreira C., Paixao J., Santos B. S., 2007, “Using clustering analysis in a capacitated location-routing problem”, European Journal of Operational Research 179, pp. 968-977. [14] Caramia M., Dell’Olmo P., Gentili M., Mircandani P. B., 2007, “Delivery itineraries and distribution capacity of a freight network with time slots”, Computers & Operations Research 34, pp. 1585-1600. [15] Dethloff J., 2001, “Vehicle routing and reverse logistics: the vehicle routing problem with simultaneous delivery and pick-up”, OR Spektrum 23, pp. 79-96. [16] Fleischmann M., 2000, “Reverse logistics network structure and design”, Capitolo tratto da “Business perspective on Closed Loop Supply Chain”, Guide V.D.R. [17] L. Guerra, T. Murino, E. Romano, 2007,“A Heuristic Algorithm for the Constrained Location-Routing Problem”. International Journal of Systems Applications, Engineering & Development, Vol. 1, n°4, pp. 146-154, 2007. Available on-line at www.universitypress.org.uk. [18] L. Guerra, T. Murino, E. Romano, 2009, “Reverse Logistics for Electrical and Electronic Equipment: a modular simulation model”. Proceeding of the 8th Recent Advances in System Science and Simulation in Engineering ICOSSSE 2009, pp. 307-312, 2009. ISSN: 1790-276. [19] Stock J.R., 1992, “Reverse Logistics”, Council of Logistics Management, Oak Brook, IL.
384
ISBN: 978-960-474-230-1