IEEE TRANSACTIONS ON VISUALIZATION AND COMPUTER GRAPHICS, VOL. XX, NO. Y, MONTH 2014
1
ThemeDelta: Dynamic Segmentations over Temporal Topic Models Samah Gad, Member, IEEE, Waqas Javed, Member, IEEE, Sohaib Ghani, Member, IEEE, Niklas Elmqvist, Senior Member, IEEE, Tom Ewing, Keith N. Hampton, and Naren Ramakrishnan, Member, IEEE Abstract—We present ThemeDelta, a visual analytics system for extracting and visualizing temporal trends, clustering, and reorganization in time-indexed textual datasets. ThemeDelta is supported by a dynamic temporal segmentation algorithm that integrates with topic modeling algorithms to identify change points where significant shifts in topics occur. This algorithm detects not only the clustering and associations of keywords in a time period, but also their convergence into topics (groups of keywords) that may later diverge into new groups. The visual representation of ThemeDelta uses sinuous, variable-width lines to show this evolution on a timeline, utilizing color for categories, and line width for keyword strength. We demonstrate how interaction with ThemeDelta helps capture the rise and fall of topics by analyzing archives of historical newspapers, of U.S. presidential campaign speeches, and of social messages collected through iNeighbors, a web-based social website. ThemeDelta was evaluated using a qualitative expert user study involving three researchers from rhetoric and history using the historical newspapers corpus. Index Terms—Language models, time-series segmentation, text analytics, visual representations.
F
1
I NTRODUCTION
EVERAL visual analytic applications require the analysis of dynamically changing trends over time. Example contexts include studies of idea diffusion in scientific communities, the ebb and flow of news on global, national, and local levels, and the meandering patterns of communication in social networks. Trends, each representing a particular keyword or concept, that converge into topics at different points in time, then just as unpredictably diverge into new defined topics at a later time, are key patterns of interest to an analyst. Both experts and casual users alike need mechanisms for understanding such evolving trends for analysis, prediction, and decision making. While much research exists in data mining and visualization, we posit that they are insufficient to address the needs of these emerging applications. Existing visualization techniques such as ThemeRiver [1] and streamgraphs [2] are aimed to capturing overall trends in textual corpora but fail to capture their branching and merging nature. Concomitantly, data mining algorithms have evolved greatly over the past years, especially for topical text modeling [3], but capturing key breakpoints in topic evolution and defining appropriate visual representations
S
• Waqas Javed is with GE Global Research. E-mail:
[email protected]. • Niklas Elmqvist is with University of Maryland in College Park, MD, USA. E-mail:
[email protected]. • Sohaib Ghani is with KACST GIS Technology Innovation Center, Umm Al-Qura University, Makkah, KSA, E-mail:
[email protected]. • Keith N. Hampton is with Rutgers University in New Brunswick, NJ, USA, E-mail:
[email protected]. • Samah Gad, Tom Ewing, and Naren Ramakrishnan are with Virginia Tech in Blacksburg, VA, USA, E-mail: {samah, etewing, naren}@vt.edu.
for such breakpoints is an understudied problem. In this paper, we present T HEME D ELTA, a visual analytics system for accurately extracting and portraying how individual trends gather with other trends to form ad hoc groups of trends at specific points in time. Such gathering is inevitably followed by scattering, where trends diverge or fork to form new groupings. Understanding the interplay between these two behaviors provides significant insight into the temporal evolution of a dataset. We built T HEME D ELTA to support hypothesis generation by focusing on developing a system for exploring and navigating trends. A natural extension to ThemeDelta is expanding the system capabilities to further support robust knowledge generation, but this is beyond the scope of this paper. There has been significant research in capturing the dynamic evolution of topics underlying text corpora. Most of these efforts are focused on extending the classical probabilistic model of Latent Dirichlet Allocation (LDA) [3] to a time-indexed context. Our ThemeDelta temporal topic modeling approach is differentiated by its emphasis on automatically identifying segments where topic distribution is uniform and segment boundaries around which significant changes are occurring. We embed a temporal segmentation algorithm around a topic modeling algorithm to capture such significant shifts of coverage. A key advantage of our approach is that it integrates with existing topic modeling algorithms in a transparent manner; thus, more sophisticated algorithms can be readily plugged in as research in topic modeling evolves. Similar to how ThemeRiver [1] uses a single stacked graph centered around a horizontal timeline that resembles a physical river, our ThemeDelta visualization is composed of multiple individual trend streams, or trendlines, represented by sinuous and variable-width lines that branch and merge in a fashion reminiscent of real-world river deltas. We use the width of
IEEE TRANSACTIONS ON VISUALIZATION AND COMPUTER GRAPHICS, VOL. XX, NO. Y, MONTH 2014 do middle
thank fair
people hard
class
job
house
do
system
do
economy
job
basic
care
health
seen
care
vision
reason
campaign
kid tough
energy sense
reason
mean million
idea
thank
reform system
campaign seen crisis
energy million
do
kid money boo
opportunity tough
lost
time
vision
world
vision
2
reason crisis
campaign
try lost
people office invest
start
invest
world
energy
company
tough
friend
hard matter understand
mean
happen
world
mean built
reason
believe extraordinary unit
bill
matter
able
chicago
issue
government
world
start
get reform
continue crisis
little future
education
extraordinary continue
choice
little create
cut
economy
run company
cut
elect idea
race
energy
business
tell
values reason
elect
idea
believe elect
help
american
afford
extraordinary unit education
change
Nov 07 - Jan 02 2011 2012 8 weeks
Jan 03 - Feb 28 2012 2012 8 weeks
tax
world class unit
cut
plan
care
afford able
tell
elect
extraordinary
get college values
office
future
family education
family
american elect
sense
hard
future
unit
future
people
american
trillion
run
unit
little
house
class
cut
built
pay tax
business
fight
bill will family opportunity
company
chance
issue
boo
time
plan
tax
pay
basic
believe
tell
cut forward
time
middle
family
start
republican
love change run million
trillion
republican
built
energy
cut
change
race
fight
health
tell
tax
understand
congress
friend
unit
little
love
opportunity
tell
pay
war
tax pay
choice
cut
plan choice
basic bill
forward
government
congress
pay
believe create
believe
help reason
tell
try chicago
chance
people
choice
applause
idea tell
hard
million
thank
middle mean
congress trillion
education million
world
people will
fair
college
get
happen
thank
war
will change
money
forward company
applause
Aug 20 - Sept 10 2012 2012 3 weeks
Sept 11 - Sept 17 2012 2012 1 week
energy million
future
world
american
Feb 29 - Apr 04 2012 2012 5 weeks
Apr 05 - May 31 2012 2012 8 weeks
Jun 01 - Jun 15 2012 2012 2 weeks
Jun 16 - Aug 11 2012 2012 8 weeks
Aug 12 - Aug 19 2012 2012 1 week
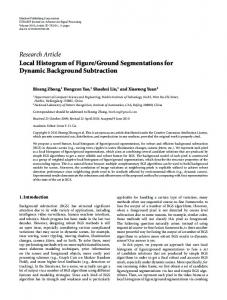
Fig. 1. ThemeDelta visualization for Barack Obama‘ campaign speeches during the U.S. 2012 presidential election (until September 10, 2012). Green lines are shared terms between Obama and Romney. Data from the “The American Presidency Project” at UCSB (http://www.presidency.ucsb.edu/).
each trendline to communicate the prominence of its trend in the dataset at a particular time, and its color to communicate category or overall weight of the trend. A heuristic layout technique calculates the order of trends for each timestamp while minimizing the number of trendline crossings. Interaction techniques allow for highlighting individual trendlines, changing the layout order, and drilling down into the data. As demonstrated later, there are several potential usage scenarios for our novel ThemeDelta system. We dedicate the main part of this paper to explore three scenarios: (1) historical U.S. newspaper data from four months in the year 1918 during the second wave of the Spanish flu pandemic; (2) the similarities and differences in trends and themes being discussed by the two candidates in the U.S. 2012 presidential campaign; and (3) social messages exchanged between virtual communities via the i-Neighbors web-based application [4]. These applications are intended to demonstrate that ThemeDelta provides an interesting insight into datasets not immediately apparent through other representations. The remainder of this paper is structured as follows: We first survey the literature on text visualization, temporal visualization, and temporal topic modeling. We then present an overview of ThemeDelta system followed by detailed review of the temporal topic modeling algorithm and visual representation. The next three sections deal with the presidential campaign, iNeighbors, and newspaper applications. We then discuss the results of a qualitative user study, performed to measure the effectiveness of the system when used by experts. We close with a discussion, conclusions, and future plans.
2
R ELATED W ORK
Textual data is one of the most common forms of data today [5] and is ubiquitously available from a wide variety of sources such as websites, books, reports, newspapers, and magazines. Reading and understanding many textual datasets is often impossible due to their massive scale or having limited time to review them [6]. Tools such as information retrieval, data mining, and visualization have been suggested to help in this activity, often by summarizing texts and highlighting important themes. Here we survey the most relevant among such tools. 2.1 Text Visualization Text visualization uses interactive visual representations of text that go beyond merely the words themselves to show important features of a large dataset [7]. The simplest feature is word frequency; tag clouds (or word clouds) [8], [9] are the most common text visualization technique and use graphical variables like font, color, weight, and the size of the word to convey its importance in the source text. Variations include Wordle [10] and ManiWordle [11] for producing more compact and aesthetically pleasing layouts. More advanced text visualization techniques convey not only word frequency but also structural features of the text corpus (or corpora), often using a graph structure. Examples include [12], Phrase Nets [13], and GreenArrow [14], which all used variants of a dynamic graph to convey the structure in the document. Clustered word clouds [15], [16] took another approach by using word structure to modify the layout in a tag cloud, which is similar to the themescape representation used by INSPIRE [17].
IEEE TRANSACTIONS ON VISUALIZATION AND COMPUTER GRAPHICS, VOL. XX, NO. Y, MONTH 2014
2.2
Temporal Text Visualization
Text data may often be analyzed over time to expose aspects of the data that evolved during a specific time period; for example, recent studies have highlighted the importance of time and causality in investigative analysis [18]. While less saturated than general text visualization, several pieces of work exist that visualize text over time in this field. Perhaps one of the earliest and most seminal of these is ThemeRiver [1], which essentially can be thought of as a horizontal arrangement of a large number of one-dimensional tag clouds over time; the keywords become bands in a stacked graph evolving on a timeline. Byron and Wattenberg [2] later formalized these representations into so-called streamgraphs, and applied them to many other types of data. Several approaches exist that are similar to the basic ThemeRiver stacked chart. Tufte [19] showed an illustration of changing themes of music through the ages. NewsLab [20] applied a ThemeRiver representation to visualize a collection of thousands of news videos over time. NameVoyager [21] used streamgraphs to show temporal frequencies of baby names. TIARA [22] blended tag clouds onto temporal stacked charts for important themes. However, because stacked charts group themes into a single visual entity, none of these techniques are capable of conveying the structural features of the corpus. A select few techniques provide both temporal and structural information. Parallel tag clouds (PTCs) [23] integrated onedimensional tag cloud layouts on a set of parallel axes, each which could potentially be used for a time or date. However, while visually similar to our ThemeDelta technique, PTCs did not explicitly convey the grouping of words into topics. Another similar design is TimeNets [24], which used colored lines to show groupings over time for genealogical data. In fact, “Movie Narrative Charts (comic 657) of the web comic XKCD1 also used sinuous lines to convey groupings of characters in time and space for famous movies. Finally, Turkay et al. [25] presented two techniques for visualizing structural changes of temporal clusters that are reminiscent of ThemeDelta; while not specifically designed for text, the clusters used in their work could very well stem from textual corpora. ThemeDelta uses a similar visual metaphor but focuses on text and is intrinsically tied to the scatter/gather temporal segmentation component as well. A very relevant work is ParallelTopics, a visual analytics system that integrated LDA with interactive visualization [26]. The system used the parallel coordinate metaphor to present document topic distributions, with applications to exploring National Science Foundation awarded proposals, VAST publications, as well as tweets. This system presented the underlying probabilistic distributions in the LDA model from a temporal perspective using multiple aggregation strategies and interactions. The system can capture the topics and their evolution over time but only by using fixed time frames. In contrast, our ThemeDelta approach discovers time frames automatically based on topic reorganizations across time. Finally, TextFlow [27] is perhaps the closest related work to ThemeDelta and used tightly integrated visualization and 1. http://www.xkcd.com/
3
topic mining algorithms to show an evolving text corpus over time. However, whereas we draw upon the same basic visual representation as TextFlow, our focus in this work is segmenting time based on topic shifts and then interfacing with standard topic modeling using a novel algorithm. Furthermore, ThemeDelta does not aggregate keywords into stacks or glyphs but instead puts more emphasis on an interactive layout. 2.3
Temporal Topic Modeling
Text visualization techniques are only as good as the extracted features they are visualizing. Text mining is the concept of deriving high-quality features from text [28]. One of the current most promising lines of research in text mining is topic modeling [3], where documents are modeled as distributions (mixtures) over topics, and topics in turn are distributions over the vocabulary used in the corpus. LDA is considered a generalization of Probabilistic Latent Semantic Analysis (PLSA), proposed by Hofmann [29]. The difference between LDA and PLSA is that the topics distributions in LDA are assumed to be distributed according to a Dirichlet prior. Temporal topic modeling algorithms started to appear around 2006, with most of them being generalizations of static topic models. The difference between our goals and those of previous work is that we aim to automatically identify segment boundaries that denote shifts of coverage and, in this manner, extract temporal relationships for examination. Therefore, we are not proposing a new topic model but instead are proposing how we can “wrap around existing topic modeling algorithms to segment timestamped data. Classical work in this space was done by Blei and Lafferty [30], who extended traditional state space models to identify a statistical model of topic evolution. They also developed techniques for approximating the posterior inference for detecting topic evolution in a document collection. Wang and MacCallum [31] proposed a non-Markov model for detecting topic evolution over time. They assume that topics are associated with a continuous distribution over timestamps and that the mixture distribution over topics that represent documents is influenced by both word co-occurrence relationships and the document timestamp. Thus, in their model, topics generate both observed timestamps and words. Iwata and Yamada [32] also proposed a topic model that enabled sequential analysis of the dynamics of multiple time scale topics. In their proposed model, topic distributions over words are assumed to be generated based on estimates of multiple timescale word distributions of the previous time period. Finally, Wang and Blei [33] have recently proposed a model that replaced the discrete state space that was originally proposed by Blei and Lafferty [30] with a Brownian motion law [34] to model topic evolution. They assumed that topics are divided into sequential groups so that topics in each slice are assumed to evolve from the previous slice. This line of research has been extended to mining text streams, e.g., as done in [35]. Here, the authors study the problem of mining evolving multi-branch topic trees inside a text stream by proposing an evolutionary multi-branch tree clustering method. In their method, they adopt Bayesian rose trees to build multi-branch trees and used conditionals prior
IEEE TRANSACTIONS ON VISUALIZATION AND COMPUTER GRAPHICS, VOL. XX, NO. Y, MONTH 2014
3
T HEME D ELTA OVERVIEW
ThemeDelta is intended to convey local and global temporal changes in the distribution of evolving trends. The system detects and visualizes how different trends converge and diverge into groupings at different points in time, as well as how they appear and disappear during a time period. The system consists of two major components: a backend data analytics component, and a frontend visualization component: • The analytics backend is responsible for accepting a large temporal text corpus and automatically identifying segments that characterize significant shifts of coverage. The algorithm responsible for this task was originally developed to detect deliberation in social messages [40]. For ThemeDelta it was modified to detect and work with named entities: geo-political, person, organization, as well as possibly uncategorized entities. • The visualization frontend is responsible for graphically representing the discovered trending of topics. While originally designed for timestamped text collections, we see many additional applications such as for genealogy (e.g., [24]), communication graphs (e.g., [41]), and general dynamic graphs. In this section, we review the data format expected by the different components of the system and then discuss implementation details. 3.1
Data Format
The backend accepts a text dataset consisting of timestamped data. The frontend takes the output of the backend for visualization. The backend output consists of trends , topics (groups of trends at a specific point in time), and segments (a closed interval of time, modeled as a group of topics).
The exact mapping of these general concepts to a dataset is domain-specific. For example, for a timestamped document collection, trends could represent the terms extracted from the documents, and the topics would model how these terms converge into groupings at different points in time. 3.2
Implementation
ThemeDelta is web-based application that is built to be capable of running in any modern web browser. To realize this the backend of ThemeDelta was built using Java and this includes all data preprocessing, clustering, and segmentation. The frontend was built using JavaScript and SVG. The current implementation is fully interactive and animated, and is built using the Rapha¨el2 toolkit for scalable vector graphics.
4
T EMPORAL TOPIC M ODELING
The ThemeDelta backend is responsible for the segmentation and discovering the trending topics from the input dataset. Our segmentation algorithm expects the input data to be in a bag-of-word format. The preprocessing needed is thus to tokenize the text into individual words, followed by standard processing steps such as: lower case conversion, stemming, stop words removal, spell checking, and punctuation removal. The main task of the segmentation algorithm is to automatically partition the total time period defined by the documents in the collection such that segment boundaries indicate important periods of temporal evolution and re-organization. Segment 1 Segment 2
Z1
Z2
Z3
w6 w2 w1 w4 w5 w2 w3 w6 w1 w2 w3 w4 w8
w5 w1 w3 w6 w5 w1 w3 w7 w2 w4 w8
Segment 2
Z`1
Z`2
Segment 1
over tree structures to keep the information from previous trees as well as maintain tree smoothness over time. To keep the consistency of trees over time, they define a constraint tree from triples and fans to compute the tree structure differences. Other work focused on multiple text streams. Wang et al. [36] and [37] aimed to “align time series streams so as to identify correlated and/or common topics across disparate streams. Our algorithm was designed to analyze a single time-indexed corpus as opposed to multiple time (and asynchronous) text streams. The work of Leskovec et al. [38] stringed together individual tweets (meme) into a thread. The authors placed additional constraints in identifying these threads (e.g., that they originate in a single meme). The granularity of analysis in our work is clusters rather than tweets; the desired output is rich scatter-gather relations between clusters rather than simple branching patterns. The work presented by Gao et al. [39] is the closest to our work. The authors conducted topic modeling and investigate both scattering and gathering possibilities of cluster organization. The difference is that our work automatically determines segmentation boundaries where significant shifts of topic distributions occur, whereas the work of Gao et al. incrementally clustered every time point separately and then aimed to make splitting and merging decisions.
4
Z`1
Z`2
Z`3
Z1
2
1
2
Z2
3
2
1
Z3
2
2
3
Z`3
Fig. 2. Contingency table used to evaluate independence of topic distributions for two adjacent windows [40]. The algorithm moves across the data by time and evaluates two adjacent windows assuming a given segmentation granularity (e.g., discrete days, weeks, or months). This granularity varies from application to another and it is decided by domain experts. We evaluate adjacent windows by comparing their underlying topic distributions and quantifying common terms and their probabilities. We chose to quantify common terms based on the overlap between them. The overlap can be captured using a contingency table. Figure 2 shows a simplified example of two segments, each comprising three topics and the corresponding contingency table measuring the overlap between these distributions. For example, topic 1 (Z1) in segment 1 and topic 1 (Z 0 1) in segment 2 overlap in w1 and w6. This 2. http://raphaeljs.com/
IEEE TRANSACTIONS ON VISUALIZATION AND COMPUTER GRAPHICS, VOL. XX, NO. Y, MONTH 2014
resulted in adding the count 2 in the contingency table cell that corresponds to the overlapping cell between the two topics from the two segments. We would like the topic models of the two adjacent windows to be maximally independent, which will happen if the table entries are near uniform. Formally, given the input data to be indexed over a time series T = {t1 ,t2 , . . . ,tt }, the segmentation problem we are trying to tackle is to express T as a sequence of segments or t tb , . . . , Stkl ) where each of the windows windows: ST = (Stt1a , Sta+1 Sttse ,ts ≤ te denotes a contiguous sequence of time points with ts as the beginning time point and te as the ending time point. Each window Sttse has a set of topics that is discovered from the set of documents that fall within this window. The topics are discovered by applying LDA (Latent Dirichlet Allocation) [3]. Applying this algorithm will result in two main distributions: document-topic distribution (representing the distribution of the discovered topics over the documents) and topic-terms distribution (representing the distribution of the discovered topics over the vocabulary). Topics within each window is represented as Sttse = {z1 , z2 , . . . , zn } where n is the number of top topics z discovered. Each topic is represented by a set of terms w as follow: zi = {w1 , w2 , . . . , wm } where m is the number the top terms extracted from the topic-terms distribution resulted from applying LDA on the documents within a window. Number of top topics n and top terms representing a topic m vary from application to another. te te We represent two adjacent windows as Sts 1 and Sts 2 . To 1 2 evaluate two adjacent windows, we construct the contingency table for two windows. The contingency table is of size r × c where rows r denote topics in one window and columns c denote topics in the other window. Entry ni j in cell (i, j) of the table represents the overlap of terms between topic i of te te Sts 1 and topic j of Sts 2 . 1 2 We used a contingency table because it enable the replacement of LDA with any emerging topic modeling variants. As presented in [42] we can embed any vector quantization clustering algorithm in a contingency table framework. For instance, distributions inferred from a more sophisticated model can be compared using the contingency table formulation introduced here. Then to check the uniformity of the table, three steps should be accomplished: first, calculate the following two quantities: • Column-wise sums ni. = ∑ j ni j • Row-wise sums n. j = ∑i ni j These two quantities will be used to quantify the overlap between the topics discovered from two adjacent windows. In our implementation for this step, each topic is represented by its top assigned terms. The contingency table is created from these terms (here we chose 20 terms and the choice of the number of terms is inherently heuristic and specific to the application). A probabilistic similarity measure such as the KL- or JS-divergence between the distributions being compared is another possibility. Second, we define two probability distributions, one for each row and one for each column: ni j , (1 ≤ j ≤ c) (1) p(Ri = i) = ni.
p(C j = j) =
5
ni j , (1 ≤ i ≤ r) n. j
(2)
Third, we calculate the objective function F to capture the deviation of these row-wise and column-wise distributions with regard to the uniform distribution. The objective function is defined as follows: F=
1 1 1 r ∑ DKL (Ri kU( c )) + c r i=1
c
(3)
j=1
where DKL (PkQ)) = ∑ P(i) log i
1
∑ DKL (C j kU( r )) Q(i) P(i)
(4)
This objective function can reach a local minimum, which is acceptable given that we are trying to segment time based on shifts in topics and this approach capture the first shift in topics (as opposed to detecting an optimal segmentation which would require a more exhaustive search through breakpoint layouts). Here, DKL denotes the KL-divergence that is used to calculate the distance between the row-wise and the uniform distribution. Likewise, it is used to calculate the distance between the column-wise distributions and the uniform distribution. Then the values resulting from using the DKL will be used in calculating the objective function F. The algorithm repeats the above mentioned steps for all permutations of the two sliding window sizes. The goal is to minimize F, in which case the distributions observed in the contingency table are as close to a uniform distribution as possible, in turn implying that the topics are maximally dissimilar. There are two stopping conditions for this algorithm: (1) if conversion of F is achieved, or (2) the maximum size for both windows was achieved. Detailed description of the algorithm is shown in Algorithm 1. Putting all these ideas together into a working ThemeDelta application involves several implementation decisions. Model selection (i.e., choosing the ‘right’ number of topics) is a key underlying issue and Bayesian criteria such as the AIC or BIC or information-theoretic criteria such as perplexity can be utilized for this purpose. More formally, a hierarchical Dirichlet process (HDP) model can be employed. An inordinate number of topics would lead to an under-determined system and inference of redundant topics. Here, we apply a simple word filtering technique on the discovered topics within and across segments to eliminate repeated topics and repeated terms. This can potentially alter the number of topics in each segment and number of words used to represent each topic.
5
T HEME D ELTA : V ISUAL R EPRESENTATION
ThemeDelta‘s visual representation draws on TextFlow [27], and uses a basic visual encoding consisting of sinuous trendlines—each representing a trend in the dataset—stretching from left to right along a timeline mapped to the horizontal axis (Figure 3). The horizontal space along this axis is divided equally among different time segments (t1 , t2 , and t3 in Figure 3). Topics for each segment are perceptually conveyed by clustering the trendlines for the grouped trends next to each
IEEE TRANSACTIONS ON VISUALIZATION AND COMPUTER GRAPHICS, VOL. XX, NO. Y, MONTH 2014
Algorithm 1. Topic Modeling Based Segmentation Input: T = {t0 ,t1 ,t2 ,t3 , . . . ,tt } x = min. window size. y = max. window size. Output: ST = {} //Set of all segments between t0 and tt W 1Start = t0 W 1Size = x F =Initialize objective function with a large number. while W 1Start +W 1Size + x ≤ tt and W 1Size ≤ y do //x is added to W1 to take into account the data availability for W2. Conversion = False //Reset start and size of W2. W 2Start = W 1Start +W 1Size + 1day W 2Size = x while W 2Start +W 2Size ≤ tt and W 2Size ≤ y do Apply LDA separately on W 1 and W 2 Calculate F 0 for W 1 and W 2 if F 0 > F or W 1Size == y or W 2Size == y do //Conversion or max. window size limit reach. Add W 1 and W 2 to ST W 1Start = W 2Start +W 2Size + 1day W 1Size = x Conversion = True Break F = F0 W 2Size+ = x //Expand W2. if !Conversion do W 1Size+ = x if leftover data exists do //leftover data starts at W1Start and ends at tt . Apply LDA on leftover data. Add window of leftover data to ST . return ST
Fig. 3. Basic visual representation used by ThemeDelta.
other along the vertical axes, leaving a fixed amount of empty vertical space between adjacent topics. Vertical lines, one for each time segment, partition their horizontal positions. 5.1
Visual Design
Given this basic design, many design parameters remain open. Below we review the most important of these and motivate our decisions for the visualization technique. A visualization developer using the same basic visual representation may make different choices than these depending on the application.
6
Shape. To communicate the organic nature of evolving trends, we use splines to yield smooth curves. The resulting lines are continuous, predictable, and appealing. An alternative design would have used rectilinear or sharp angles, but curves are likely easier to perceive and more aesthetically pleasing. Thickness. Trendline thickness is a free visual variable. While it is possible to use a uniform thickness for all trendlines, it can also be used to convey scalar data for each time segment. Because increasing thickness will raise the visual salience of a trendline, we tend to use it to convey the weight of each keyword calculated by our segmentation algorithm. Furthermore, our visual representation uses vertical dashed lines to partition time segments on the visual space. The thickness of these lines is another free variable that can, e.g., be used to indicate the relative extent of each time segment. This is useful since time segments may be irregular; some segments are significantly longer than others. Color. Color is another free parameter in our visual representation, and can convey either a quantity (using a color scale) or a category (using discrete colors). The choice depends on the application. For example, we use it both to show the strength of a correlation, as well as to convey which entity class a particular trendline belongs to. Discontinuities. Trendlines can begin and end at any time segment, sometimes only to reappear later in time. We communicate this using a tapered endpoint of the line (see borders in Figure 3). An alternative design could have dashed the trendlines for the periods of time where there is no associated value, similar to the use of different trend shapes in TextFlow [27]. We chose to avoid this to minimize visual complexity. Labels. We draw the names of each trendline on the line itself for each time segment. While this is redundant (one instance of the label is sufficient) and potentially a source of visual clutter, it prevents the user from having to trace an undulating trendline back to a single label at the far end of the visualization. We also scale the label size based on the trendline‘s thickness, similar to word scaling in word clouds. Duplicated Trends. Sometimes a trend may exist in more than one topic for a particular time segment (see trend A at time t2 in Figure 3). To make the visualization consistent, as well as to convey the fan-out, we are forced to fork the trendline into two or more pieces. Analogously, in a time segment following a duplicated trend instance, the trendlines should be merged to maintain consistency. In situations when there is more than one candidate to fork from or merge to, we choose the two trend instances that are vertically closest to each other (see the layout algorithm discussed below). 5.2
Interaction
Several interaction techniques are meaningful for ThemeDelta frontend. First of all, geometric zoom and pan allows for being able to magnify a certain part of the visualization to see details. Furthermore, hovering over a trendline will highlight the line, including all of its branches in other parts of the visualization (even past a discontinuity). Figure 1 shows this interaction, where the trend lines associated with the keyword energy are highlighted in response to a mouse hover interaction.
IEEE TRANSACTIONS ON VISUALIZATION AND COMPUTER GRAPHICS, VOL. XX, NO. Y, MONTH 2014
The interface also supports searching for trendlines by name. In addition, we provide a combined filtering and resorting operation. Clicking on a trendline will add it to a filter box, causing the layout to be recomputed with the selected trendline at the top of the screen. The new layout will only include trendlines that are connected to the selected trendline, i.e., which in at least one time segment belong to the same topic as the selected trendline. Following the example presented in Figure 1, clicking on the trend line for the keyword energy performs the filtering operation, and the visual layout is changed such that the filter keyword is positioned at the top (Figure 4). Additional trendlines can be added to the filter box, yielding a conjunctive filter (only trendlines which are connected to all selected trendlines are shown). 5.3
Layout
The ThemeDelta frontend visualization layout divides the available horizontal space equally between time segments, while vertical space is divided locally between the topics associated with each time segment. Due to the ever-changing topic groupings over time as well as the dynamic appearance and disappearance of trends, it is typically not possible to represent trends as straight lines. In fact, a single trend could appear in a different topic and at a different vertical position with each new time segment. This is the reason for using smooth splines to convey this organic trend evolution. Of course, this in turn means that trendlines will frequently cross one another while connecting the multiple occurrences of a single term across different time segments. Research in graph drawing has shown that the ease with which a user can follow an edge depends on the number of crossings with other lines in its path [43]. Tanahashi and Ma [44] discussed a set of layout design principles for better legibility of storyline visualizations like ThemeDelta. However, the complexity of their algorithm makes it difficult to achieve real-time layout updates. Other work proposed by Liu et al. [45] trade-off optimal layout with algorithm performance to achieve real-time updates. The algorithm used for ThemDelta is similar to the one proposed by Liu et al. [45]. However, contrary to their algorithm, we do not have hierarchical relationships in the underlying data and to facilitate the identification of individual topics by supporting a constant reasonable vertical space between them, the layout algorithm used in this paper does not perform the topic alignment step. Moreover, to achieve real time interactivity our implementation minimizes line crossings through a single iteration across different time segments. In particular, ThemeDelta relies on a deterministic layout algorithm that minimizes trendline crossings by first sorting the vertical positioning of different topics, followed by sorting the trends within each topic. While sorting topics at a particular time segment ti , a topic p1 is placed before another topic p2 if the average vertical position of the trends contained in topic p1 is less than the terms present in topic p2 at the previous time segment ti−1 . Topic position in the first time segment is either determined randomly, or using some attribute of the underlying data.
7
After sorting topics it is time to sort the trends within each topic. Except for the first time segment, trends within a topic are sorted such that their relative vertical position remains the same as it was in the previous time segment. Once all trends are sorted, the trends contained within topics of the first time segment are sorted such that their vertical position remains the same as in the second time segment. Figure 5 shows the progressive decrease in the number of trendline crossings at different stages of the layout. In Figure 5(a) the dataset is visualized without any sorting. This results in a total of twelve crossings between trendlines, connecting multiple occurrences of terms across the two time segments t1 and t2 . Figure 5(b) shows the resulting layout after topic sorting. As shown in the figure, the topics within time segment t2 are now ordered based on the average vertical position of their corresponding terms within time segment t1 . This ordering of topics has reduced the number of line crossings from 12 to 6. Finally, Figure 5(c) shows the resulting layout after trend sorting. Here again it is evident that the number of line crossings is reduced even further. All in all, as a result of the layout algorithm, the number of trendline crossings has been reduced from 12 to 2.
6
U.S. 2012 P RESIDENTIAL C AMPAIGN
Political speeches, especially during an election campaign, are particularly interesting document collections to analyze because the political discourse tends to change and evolve as different candidates respond and challenge each other over the course of the campaign. Visualizing the speeches of different candidates would allow for comparing the trends of each candidate with each other. To study such effects, we used the U.S. 2012 presidential election campaign speeches. The U.S. presidential election takes place every four years (starting in 1792) in November (the 2012 election day was November 6), and is an indirect vote on members of the U.S. Electoral College, who then directly elect the president and vice president. In 2012, the Republican and Democratic (the two dominant parties, representing conservative vs. liberal agendas) conventions were held on the weeks of August 27 and September 3, respectively. The two opposing candidates were Republican nominee Mitt Romney, and Democratic nominee Barack Obama (incumbent President of the United States). The ThemeDelta for both candidates is shown in Figures 1 and 6. 6.1
Data
In collecting data for the United States presidential election, we used campaign speech transcripts for both candidates from the UCSB American Presidency Project.3 For Mitt Romney, we used transcripts from 46 speeches over a 62-week period: from announcing candidacy on July 29, 2011, to August 14, 2012. This corpus included speeches from both the Republican primary election (settled on May 14, 2012 as the main competing nominee Ron Paul withdrew). For Barack Obama, we used transcripts from 40 speeches over a 44-week period: November 7, 2011 to September 17, 2012. 3. http://www.presidency.ucsb.edu/
IEEE TRANSACTIONS ON VISUALIZATION AND COMPUTER GRAPHICS, VOL. XX, NO. Y, MONTH 2014 mean million
do
people reason
energy
system
invest tough
tough
world million
sense
energy
energy
health love change
happen
will
college war
people
time
tell
world
tell
world
energy million
reason do
mean invest
do
energy reform system
8
money
applause million
time
energy little tell values
reason
reform
believe
little
reason
war
believe
elect
believe
happen
do money
tell
mean
tell world
elect
reason
little
will change
love
elect
believe
believe elect
applause
tough
tell
tell
time
mean
elect
little
million
health
college
change
sense
values
people
will change
world
NovS07S-SJanS02 2011 2012 8Sweeks
JanS03S-SFebS28 2012 2012 8Sweeks
FebS29S-SAprS04 2012 2012 5Sweeks
AprS05S-SMayS31 2012 2012 8Sweeks
JunS01S-SJunS15 2012 2012 2Sweeks
JunS16S-SAugS11 2012 2012 8Sweeks
AugS12S-SAugS19 2012 2012 1Sweek
world
AugS20S-SSeptS10 2012 2012 3Sweeks
SeptS11S-SSeptS17 2012 2012 1Sweek
Fig. 4. ThemeDelta visualization after performing a filtering operation, based on the keyword “energy”, in the visualization presented in 1. A
F
A
D
A
A
B
C
B
A
B
D
C D
E B
C D
E B
D C
B E
E
D
E
F
E
C
F
A
F
C
F
F
t1
t2
t1
t2
t1
t2
(a) Without sorting.
(b) Topic sorting only.
(c) Topic plus term sorting.
Fig. 5. Comparison of different stages of the layout sorting algorithm used for the ThemeDelta technique.
6.2 Discussion Visualizations of the two candidates Barack Obama and Mitt Romney are shown in Figure 1 and Figure 6. Trendlines in both visualizations represent characteristic keywords that each candidate uses as a theme in his speeches. Democratic trendlines are colored blue, Republican ones are red, and trendlines for keywords that both candidates share are green. For the Romney dataset (Figure 6), there is a clear impact of time on keywords and topics that the candidate is using. Romney’s message starts out relatively simple with only two main topics, but quickly branches out in complexity as time evolves. The effect of main competitor Ron Paul withdrawing in May is clear: before this date, Romney is trying to win the party nomination, whereas afterwards, he is going for the presidential seat. As a result, his message becomes more simple again: both the number of keywords and the number of topics decreases during the last three segments, presumably to focus on key issues in the Republican election platform. For the Obama dataset (Figure 1), a good portion of the identified keywords are common with Mitt Romney (i.e., green in color). This could be seen as Obama discussing many of the issues that has become central to the U.S. presidential race. Furthermore, there is a clear presence of keywords such as “health,” “insurance,” and “care,” which may refer to the president’s health care reform from 2010 (informally called Obamacare). This is a controversial issue that still causes a major divide between voters; a Reuters-Ipsos poll in June 2012 indicated that a full 56% of Americans were against the law. Taken as a whole, both datasets have a heavy emphasis on
economics keywords. This is commensurate with the overall theme of the 2012 presidential race, which largely has focused on the poor economic situation of the United States.
7 I -N EIGHBORS S OCIAL M ESSAGES The Internet facilitates informal deliberation as well as civic and civil engagement. Web-based applications for informal deliberation (e.g., i-Neighbors [4]) facilitate the collection of data that we can analyze to provide insight into how neighborhoods with different poverty levels use ICTs for informal deliberation. Using ThemeDelta, we can characterize differences and detect common interests in informal deliberation between advantaged and disadvantaged communities. The goal of this application was to study two basic questions: what lengths of time neighborhoods with different poverty levels spend discussing topics? And what is the average similarity in topics discussed between neighborhoods with different poverty levels, and the similarity in topics discussed between neighborhoods with similar poverty levels? 7.1 Data The data for this application was collected through the iNeighbors system. The site is open for anyone in the United States or Canada to create a virtual community that matches their geographic neighborhood and start conversations on local issues, announce events, disseminate information, etc. When we collected the data in 2010, the i-Neighbors website had over 100,000 users who had registered more than 15,000 neighborhoods. Over 1,000 neighborhoods were
IEEE TRANSACTIONS ON VISUALIZATION AND COMPUTER GRAPHICS, VOL. XX, NO. Y, MONTH 2014 life
life
life
ago
religion
religion
cut
constitution
god
hard budget
val
lift
economy
energy
life
cut
obama
party
create
budget
strengthen
opportunity government
job
right
military
9
faith
power god
romney liberty
energy
freedom
policies
remember government
history
job faith
china
convict
tonight
enterprise
debt
prosper
campaign
liberty
economy freedom
faith
strengthen
friend liberty freedom
prosper
help
hope
prosper
freedom
success
choice
lead believe promise
economy
spend
women
campaign
government
prosper
school economic
military obama
debt
economic
china
call generate
party
government
freedom
time
people
history
crowd
congress
constitution day
life
economic
ago
unemployment
tonight
policies
hard
believe
security
time
future path
final
crowd
friend
percent
job thank
romney
god path
opportunity
romney
unit
choice
final
school
student
education
thank
campaign
spend
create resources
debt
congress
day
tonight
call
debt
special
percent
god
strengthen prosper
help
lead
help
real
special
future
rate
business family unit little
american
thank
lift promise
percent
union energy
american
trade
help
unemployment
people
trade
success
cut energy
education
generate
business
rate
business
union
country
public
hope real
resources
american
fail
freedom
believe
people
family
student
remember
business trade
public
union
tonight
job
job
right
women
american
stand
freedom
power
free
enterprise
promise
business
fail
american
hope
future stand
stand
little
country
val
believe
business
free
secure
convict
day
spend
NovM20M-MJanM15 2011 2012 7Mweeks
JanM16M-MFebM20 2012 2012 4Mweeks
fail
JulM29M-MSeptM23 2011 2011 7Mweeks
SeptM24M-MNovM19 2011 2011 7Mweeks
FebM21M-MAprM17 2012 2012 5Mweeks
AprM18M-MMayM02 2012 2012 2Mweeks
MayM03M-MJunM28 2012 2012 7Mweeks
JunM29M-MAugM03 2012 2012 5Mweeks
AugM04M-MAugM14 2012 2012 1Mweek
Fig. 6. ThemeDelta visualization for Mitt Romney campaign speeches for the U.S. 2012 presidential election (as of September 10, 2012). Green lines are shared terms between Obama and Romney speeches. Data from the American Presidency Project at UCSB (http://www.presidency.ucsb.edu/).
active with more than 7,000 unique messages contributing to neighborhood discussion forums. We collected data from six geographically diverse communities located in Georgia, Maryland, New York, and Ohio. We selected the three groups located in areas with concentrated levels of poverty (a poverty rate of 25% or more, 2009 American Community Survey, US Census Beureau) who exchanged the most messages, and the three most active groups in more advantaged areas. neighbor email
watch
clubhouse
crest
law
inform
vote state
budget
increase
issue
tax
year meet
library
neighbor
crest thank
vote
year
million
district
central
budget
tax
budget
student
elementary children
build
animal
central thank
message
family
year
day
aver
family
street
neighbor
community
police
neighbor
dog
hope
ave
state project
park
message
project
build
inform
council issue police
park
house avenue call
street community day
car
money
year hope
people think kid
dog night
reside hoa
email
ave
community
day
animal
way
police car
law
student elementary
people
children way
thank Jan 28 - Feb 28 2009 2009 1 months
school
budget
library
park
clubhouse
million increase tax money
teacher
community
community
city
tax
hoa
email
community
school
district
money
reside
neighbor clubhouse
watch
school
council
teacher think
Feb 01 - Nov 01 2009 2009 9 months
Nov 02 - Jan 02 2009 2010 2 months
dog house
call
car night
kid
Jan 03 - Sept 03 2010 2010 8 months
neighbor meet
Fig. 7. Result of searching for the word “watch” in lowpoverty neighborhood. 7.2 Discussion We applied our temporal segmentation algorithm on the six selected neighborhoods. Topics within each segments can be examined using the visualization to find topic similarities between neighborhoods. Segmentation labels indicating segments size can be used for comparing the time spent by different neighborhood discussing certain topics. A partial segmentation output is shown for a disadvantaged neighborhood in Figure 8 and Figure 9 for a more advantaged neighborhood. From these two examples, the segments sizes are not very different and we can conclude that both the
street Jan 01 - May 01 2009 2009 4 months
May 02 - Jan 02 2010 2009 8 months
Jan 03 - Feb 03 2010 2010 1 month
community
Feb 04 - Oct 04 2010 2010 8 months
Fig. 8. Partial output from a high-poverty neighborhood.
disadvantaged and advantaged neighborhoods spend similar amounts of time discussing topics. Examining the words groupings in both neighborhoods can lead to discovering differences and similarities in their discussions. For example, in the low-poverty neighborhood in segment [Feb 1, 2009 to Nov 1, 2009], there is a topic that has the words “watch” and “neighbor,” which lead us
IEEE TRANSACTIONS ON VISUALIZATION AND COMPUTER GRAPHICS, VOL. XX, NO. Y, MONTH 2014 mail see
car
notice
address
address
forest meet call
park live
neighbor
mail office
night front
income email
reside hoa website
crest site
meet
clubhouse
site
good
community
people
door
hospital city
number four
community
watch crest thank
email
clubhouse law
hour
notice website
front
twenty park
front
call
way
community
neighbor
house
court
business
ban
meet open
county campaign
loan
town open
church
today
afternoon even
city report
committee
wife town
daughter spent
son
family
liberty
friend
tho
work
county
house
men
way
door
afternoon
even
year
disease
daughter
even
campaign
wife
mask
loan
spent
daughter
good
email
committee
spent son
epidemic
number phone
liberty
call night
pneumonia
meet business
income
quota
car
hour
epidemic
number four
law
phone
people
hoa
way
care
church
ban
pneumonia
watch house
court
people
reside
clubhouse
number call
two
city board
twenty
live
neighbor
hospital
president
two
tho board
forest
community
10
son family
home
family friend
universal
four today
hospital
friend service
thank front
door
good
car
people
night
office
Jan 28 - Feb 28 2009 2009 1 months
care
Feb 01 - Nov 01 2009 2009 9 months
church universe
hospital year
Nov 02 - Jan 02 2009 2010 2 months
Jan 03 - Sept 03 2010 2010 8 months
Fig. 9. Partial output from a low-poverty neighborhood.
service
8 H ISTORICAL U.S. N EWSPAPERS Newspaper stories are precisely the type of ongoing, evolving trend datasets for which ThemeDelta was designed. Below we review the source, segmentation, and visualization for a dataset consisting of historical U.S. newspaper stories from 1918. 8.1 Data Our data source was a historical newspapers database hosted on the Chronicling America website,4 a Library of Congress resource that provides an Internet-based, searchable database of historical U.S. newspapers. The website is maintained by the National Digital Newspaper Program (NDNP), a partnership between the National Endowment for the Humanities (NEH) and the Library of Congress. Some of newspapers included in this example are: The Washington Times (Washington, DC), Evening Public Ledger (Philadelphia, PA), The Evening Missourian (Columbia, MO), El Paso Herald (El Paso, TX), and The Holt County Sentinel (Oregon, MO). We gathered data from them, restricting the time to the period September 1918 through December 1918. From this dataset, we extracted only paragraphs that mention 4. http://chroniclingamerica.loc.gov/
work
boy
hospital
work
call
home
army report
company
german general
number
service call company
red
red
committee
general
case
disease cross
red
Sept 09 - Oct 09 1918 1918 4 weeks
cross
cross
german
mask to conclude that there were some arrangements or discussions about a neighborhood watch. This topic is not found in the the disadvantaged neighborhood visualization. If the user searched for the word “watch” this will result (Figure 7) in only showing the topics that has the this word and any other related topic. Similarly, an example of similarities of topics discussed between neighborhoods can be shown by examining the segment [Jan 03, 2010 to Sept 3, 2010] in the advantaged neighborhood (Figure 9) and segment [Feb 4, 2010 to Oct 4, 2010] in the disadvantaged neighborhood (Figure 8). In both segments, there exist two topics in which both communities discuss a park-related project.
boy quota
men camp
given
pneumonia camp
army
president service given
general
mask
case
Oct 10 - Dec 05 1918 1918 8 weeks
Dec 06 - Dec 13 1918 1918 1 week
Dec 14 - Dec 28 1918 1918 2 weeks
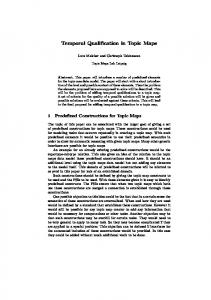
Fig. 10. ThemeDelta visualization for newspaper paragraphs during the period September to December in 1918. Color transparency for different trendlines signify the global frequency for that keyword.
the word “influenza” resulting in 2,944 paragraphs. This corresponds to the 1918 flu pandemic (also known as the “Spanish flu”) which spread around the world from January 1918 to December 1920, resulting in some 50 million deaths. 8.2 Discussion Applying the above dataset to ThemeDelta using a weekly segment granularity yields four discrete time segments over the four-month time period. Figure 10 shows a visualization of the result, where the transparency value of each trendline has been mapped to the global ranking of the keyword corresponding to the trendline. The thickness of the trendline conveys the ranking of each keyword for a particular time segment, calculated by our segmentation algorithm. Figure 10 offers several observations that summarize the qualitative nature of trends exposed by ThemeDelta. The output is showing many events that were related to the 1918 pandemic in the data. For example, in the first time segment, September 9 until October 9, there are a topic that contain the terms “mask” and “German.” This corresponds to advisories and guidelines recommending people to use masks to protect themselves from the ongoing influenza pandemic during World War I. In the same segment, the words “liberty,” “loan,” and “campaign” appeared in one of the topics, and continued appearing in the following segment, October 10 until December 5, because a liberty loan campaign were issued to support the army during World War I. Also, in the October 10–December 5
IEEE TRANSACTIONS ON VISUALIZATION AND COMPUTER GRAPHICS, VOL. XX, NO. Y, MONTH 2014
segment, the army men left the camps to go back home from service and stay with their families; this explains the topic with the words “family,” “home,” “serves,” “spent,” “wife,” and “son.” This topic appeared along with the topic with the words “case,” “disease,” “mask,” “cross,” and “red” because the returning soldiers were exposed to the disease and some of them were sick. As a result, families were advised to take protective measures. World War I ended on November 11, 1918, which explains the disappearance of the word “German,” but the country continued suffering from the disease. The word “mask” reappeared back along with “epidemic,” “hospital,” and “disease” in the December 14 until December 28 segment, which aligns with the second influenza wave. Again, during this time people were advised to wear masks to slow down the spread of the disease. The Red Cross was frequently mentioned in the last three segments, which is indicative of the second, deadlier wave of the pandemic that began in October. In both the December 6 to December 13 and December 14 to December 28 segments, the terms “people,” “ban,” and “meet” appeared because people were banned from meeting each other as a precaution measure to limit the spread of the disease. The term “president” appeared in the last segment along with “service” appeared initially in the first segment and then returned with significant strength in the last segment, illustrating the seriousness accorded to the national scale of the pandemic.
9
Q UALITATIVE U SER S TUDY
To validate the utility of the ThemeDelta system, including both its temporal segmentation algorithm as well as its visual representation, we conducted a qualitative user study involving expert participants. The purpose was to study the suitability of the approach for in-depth expert analysis of dynamic text corpora. Because of our existing collaboration with historians (the sixth author of this work is a historian), we opted to use the historical U.S. newspaper dataset and engage experts from the history department at one of our home universities. 9.1
Data
We used historical data from five U.S. newspapers for our qualitative evaluation from three different areas: New York, Washington, D.C., and Philadelphia. The data was collected from the Chronicling America website5 and focused on the 1918 influenza epidemic, which killed as many as 50 million people worldwide and has long been recognized as one of the most deadly disease outbreaks in modern world history. Historians are interested in reconstructing the timeline of events, with a view to understanding previously concealed or neglected connections between public opinion, health alerts, and prevailing medical knowledge. 9.2
Method
We recruited three graduate students as participants: one from the history department and two from the English department at our university. The participants were all required to have 5. http://chroniclingamerica.loc.gov/
11
prior knowledge of America around the Great War/First World War period. Two participants were Ph.D. students and one was a Masters student. We required no particular technical skill prior to participation. While the number of study participants may appear to be low, we want to emphasize that these participants represent a highly expert population and that our study protocol is focused more on an expert review [46] rather than a comparative or performance-based user study. The total study time was an hour. The procedure was as follows: Participants were first asked to fill out a background questionnaire. Then the study moderator explained the tool and its features, followed by the task the participants were asked to perform using the tool. After that, the participants were asked to solve several high-level tasks (reviewed below) using the tool. Finally, they were asked to complete a post-session questionnaire to collect feedback on the tool. The tasks that we asked the participant to accomplish with the help of our system was answering some questions on the 1918 influenza pandemic. Participants were encouraged to refer to the visualization in their answers by mentioning segments names, giving examples, or taking screen captures from the visualization. Tasks were divided into change and connection questions, to allow us to determine whether the visualization and algorithmic choices we made were helpful or not. The change-focused questions were: • How did the newspapers describe the spread of influenza? • How does the description of the pandemic change over time? • Are there different times when the influenza pandemic becomes less important? What are those time periods? Questions that were focused on connections were: • What are the categories that appear to be associated with influenza in different newspapers? • Was there a specific feeling that surrounded the influenza reporting in the newspapers? 9.3
Results
All three participants were successful in accomplishing the task using ThemeDelta. We determined this by comparing their answers to the task questions with model answers provided by the history faculty collaborator (reviewed in Section 8). They correctly reported the sentiments that surrounded the influenza from the five newspapers. They also successfully described the change in reporting of the influenza spread. Finally, they all succeeded in discovering the connection between influenza and other categories (e.g., schools, war, and hospitals). The subjective results of the study were overall positive and the participants all vouched for the helpfulness of the system and the need for such systems in their research. None of the participants had previous experience using any visual analytics systems. This implies that the participants found ThemeDelta to be understandable and easy to use. All the three participants finished the tasks within the allocated time. They also uniformly reported that the same type of task, if done manually as part of their own research, would normally take several days if not weeks. This highlights an additional strength to our system: minimizing the time spent on
IEEE TRANSACTIONS ON VISUALIZATION AND COMPUTER GRAPHICS, VOL. XX, NO. Y, MONTH 2014
manual analysis of large amounts of text, allowing the analyst to focus on collecting insight instead. In the post-session questionnaire, participants were asked to give their feedback on specific ThemeDelta features. The features that were reported as very useful were labels, line thickness, duplicate trends, and discontinuations. Participant ratings for other features ranged from very useful to not useful at all, the latter typically because they did not use that particular feature. Some of the identified weaknesses of the tool included not being able to see full phrases or word combinations, managing keyword filtering, controlling the dynamic layout, and high complexity for large datasets.
10
D ISCUSSION
ThemeDelta excels at discovering trending topics and visualizing not just the discovered topics, but also their evolution over time. We have demonstrated the utility of our analytics component by applying it to several types of text corpora. Furthermore, we have also shown that the visualization part of ThemeDelta can be applied to other types of data beyond text; the FriendShare app is one example of how the technique can be used to show temporal edges in a dynamic graph, i.e., for edges that appear at specific points in time. However, while ThemeDelta has many strengths, it is also balanced by several weaknesses and areas of future improvement. 10.1
Visual Design
For the visualization component, limitations appear in the presence of many trends, long time periods, and high visual complexity. While existing techniques such as TextFlow [27] take a macroscopic approach to summarizing massive text corpora using high-level overviews, ThemeDelta uses a trendlevel design that does not scale as well when the number of trends or time segments increases. While we have not derived a formal limit, even many of the examples presented in this paper skirt the boundary of the utility of the technique. In practice, large datasets (in either trends or time, or both) yield high visual complexity, particularly in the number of trendline crossings as well as incident trendlines. Such effects make perceiving the visualized data more difficult. Several possible strategies can solve this problem, such as filtering, sampling, or aggregation. Figure 11 shows FriendShare, a social media application for Facebook that we have developed to showcase one such strategy. FriendShare does not use the temporal segmentation algorithm proposed in this paper, but instead aggregates a Facebook user‘s interactions with friends in their social media network on a monthly basis. This data is collected and aggregated using the Facebook Graph API. Each friend becomes a trendline that appears and disappears for the periods when that friend interacts and does not interact, respectively, with the selected user. The example in Figure 11 shows that “Andrew Smith” has several friends that regularly keep in touch with him, illustrated by the many unbroken trendlines in the visualization. 10.2
Topic Modeling
The underlying algorithm of ThemeDelta has limitations stemming from non-adaptive window sizing and fixed number of
12
discovered topics. The minimum and maximum window sizes have to be pre-specified before the segmentation algorithm is run. This introduces the problem of force-adding a segmentation point when the maximum window size is reached, to overcome this we increase the maximum window size which can result in a slower running algorithm. The fixed number of topics discovered from each segment can introduce redundant topics. Overcoming this weakness effectively and systematically is a direction of future work. 10.3
Evaluation
We opted to not run a controlled quantitative experiment using ThemeDelta, Instead, we choose to run a qualitative expert review [46]. One reason for this choice is that we found no suitable technique to use as a baseline comparison for such an experiment. While techniques such as TextFlow [27] and TIARA [22] do provide insight on trends evolving over time, they cluster keywords together and focus on providing overview instead of detail at the level of individual keywords. In this sense, parallel tag clouds [23] are perhaps the closest technique to ThemeDelta in that it visualizes individual keywords, yet PTCs do not show the clustering of trends into topics over time. This makes direct comparison difficult. While our qualitative review did not compare ThemeDelta to other techniques, it did give rise to much more qualitative and generally useful results.
11
C ONCLUSION
AND
F UTURE W ORK
We have presented ThemeDelta, a visual analytics system for discovering and representing the evolution of trend keywords into ever-changing topic aggregations over time. While ThemeDelta builds on earlier text visualization techniques and text analytics algorithms, its main advantage is an emphasis on how keywords scatter and gather across a dataset. To showcase the applicability of ThemeDelta, we applied it to the political speeches of the two main candidates for the U.S. 2012 presidential campaign, social messaging practices in the i-Neighbors system, and historical U.S. newspaper data on the deadly Spanish Flu pandemic during the last part of 1918. We evaluated our system by conducting a qualitative expert user study using five different newspaper corpora. The study confirmed that ThemeDelta helped our expert participants in answering typical research questions in their fields. A major future direction for this work is to extend ThemeDelta to be a complete visual analytics system wherein it supports knowledge generation as well. As mentioned in [47], and echoed in our own earlier work [48] this requires thoughful integration of analyst’s discovery processes through additional interfaces and metaphors. Our future work will also study aggregation methods—time-based and keyword-based alike—for ThemeDelta that would increase the scalability of the system. Another focus will be to enable the automatic detection and visualization of the diffusion of ideas in scientific communities. From the algorithmic perspective, we will be looking to extend the segmentation algorithm ability to work with nonparametric bayesian models as Hierarchal Dirichlet Process (HDP) proposed by Teh et al. [49]. Unlike
IEEE TRANSACTIONS ON VISUALIZATION AND COMPUTER GRAPHICS, VOL. XX, NO. Y, MONTH 2014
13
Fig. 11. FriendShare for Facebook app visualizing ego-centric communication patterns for the period October 2011 to September 2012 for a person named “Andrew Smith” (highlighted in dark blue). Trendlines representing male friends use a blue color, females use a pink color, and undisclosed gender (or entities) use green. The inset shows details for June 2012. Note the high number of connections in the month of November, Andrew‘s birthday month.
LDA, the number of topics in the HDP model is automatically inferred. Currently, our algorithm only supports parametric Latent Dirichlet allocation given that they are the most commonly used in practice and research. We also intend to continue to study applying additional advanced visualization and algorithmic techniques within the context of social websites such as Facebook. This work is partly supported by the U.S. National Science Foundation grant IIS-1249229. We thank the user study participants for their time and effort.
R EFERENCES [1]
S. Havre, E. Hetzler, P. Whitney, and L. Nowell, “ThemeRiver: Visualizing thematic changes in large document collections,” IEEE Transactions on Visualization and Computer Graphics, vol. 8, no. 1, pp. 9–20, Jan. 2002. [2] L. Byron and M. Wattenberg, “Stacked graphs — geometry & aesthetics,” IEEE Transactions on Visualization and Computer Graphics, vol. 14, no. 6, pp. 1245–1252, 2008. [3] D. M. Blei, A. Y. Ng, and M. I. Jordan, “Latent dirichlet allocation,” Journal of Machine Learning Research, vol. 3, pp. 993–1022, 2003. [4] “i-neighbor website,” http://www.i-neighbors.org/, May. [5] B. Shneiderman, “The eyes have it: A task by data type taxonomy for information visualizations,” in Proceedings of the IEEE Symposium on Visual Languages, 1996, pp. 336–343. [6] R. Baeza-Yates and B. Ribeiro-Neto, Modern Information Retrieval. Addison-Wesley, 1999. [7] A. Don, E. Zheleva, M. Gregory, S. Tarkan, L. Auvil, T. Clement, B. Shneiderman, and C. Plaisant, “Discovering interesting usage patterns in text collections: integrating text mining with visualization,” in Proceedings of the ACM Conference on Information and Knowledge Management, 2007, pp. 213–222. [8] M. A. Hearst and D. K. Rosner, “Tag clouds: Data analysis tool or social signaller?” in Proceedings of the Hawaii International Conference on System Sciences, 2008, pp. 160–160. [9] S. Lohmann, J. Ziegler, and L. Tetzlaff, “Comparison of tag cloud layouts: Task-related performance and visual exploration,” in Proceedings of INTERACT, ser. Lecture Notes in Computer Science, vol. 5726. Springer, 2009, pp. 392–404. [10] F. B. Vi´egas, M. Wattenberg, and J. Feinberg, “Participatory visualization with Wordle,” IEEE Transactions on Visualization and Computer Graphics, vol. 15, no. 6, pp. 1137–1144, 2009. [11] K. Koh, B. Lee, B. H. Kim, and J. Seo, “ManiWordle: Providing flexible control over Wordle,” IEEE Transactions on Visualization and Computer Graphics, vol. 16, no. 6, pp. 1190–1197, 2010.
[12] K. T. Kim, S. Ko, N. Elmqvist, and D. S. Ebert, “WordBridge: using composite tag clouds in node-link diagrams for visualizing content and relations in text corpora,” in Proceedings of the Hawaiian International Conference on System Sciences, 2011. [13] F. van Ham, M. Wattenberg, and F. B. Vi´egas, “Mapping text with phrase nets,” IEEE Transactions on Visualization and Computer Graphics, vol. 15, no. 6, pp. 1169–1176, 2009. [14] P. C. Wong, P. Mackey, K. Perrine, J. Eagan, H. Foote, and J. Thomas, “Dynamic visualization of graphs with extended labels,” in Proceedings of the IEEE Symposium on Information Visualization, 2005, pp. 73–80. [15] J. Clark, “Clustered word clouds,” http://neoformix.com/2008/ ClusteredWordClouds.html, oct 2008. [16] Y. Hassan-Montero. and V. Herrero-Solana, “Improving tag-clouds as visual information retrieval interfaces,” in Proceedings of the International Conference on Multidisciplinary Information Sciences and Technologies, 2006, pp. 25–28. [17] J. A. Wise, J. J. Thomas, K. Pennock, D. Lantrip, M. Pottier, A. Schur, and V. Crow, “Visualizing the non-visual: Spatial analysis and interaction with information from text documents,” in Proceedings of the IEEE Symposium on Information Visualization, 1995, pp. 51–58. [18] B. Kwon, W. Javed, S. Ghani, N. Elmqvist, J. S. Yi, and D. Ebert, “Evaluating the role of time in investigative analysis of document collections,” IEEE Transactions on Visualization and Computer Graphics, vol. 18, no. 11, pp. 1992–2004, 2012. [19] E. R. Tufte, The Visual Display of Quantitative Information. Cheshire, Connecticut: Graphics Press, 1983. [20] M. Ghoniem, D. Luo, J. Yang, and W. Ribarsky, “NewsLab: Exploratory broadcast news video analysis,” in Proceedings of the IEEE Symposium on Visual Analytics Science & Technology, 2007, pp. 123–130. [21] M. Wattenberg, “Visual exploration of multivariate graphs,” in Proceedings of the ACM 2006 Conference on Human Factors in Computing Systems, 2006, pp. 811–819. [22] F. Wei, S. Liu, Y. Song, S. Pan, M. X. Zhou, W. Qian, L. Shi, L. Tan, and Q. Zhang, “TIARA: a visual exploratory text analytic system,” in Proceedings of the ACM Conference on Knowledge Discovery and Data Mining, 2010, pp. 153–162. [23] C. Collins, F. B. Vi´egas, and M. Wattenberg, “Parallel tag clouds to explore faceted text corpora,” in Proceedings of the IEEE Symposium on Visual Analytics Science and Technology, 2009, pp. 91–98. [24] N. W. Kim, S. K. Card, and J. Heer, “Tracing genealogical data with timenets,” in Proceedings of the ACM Conference on Advanced Visual Interfaces, 2010, pp. 241–248. [25] C. Turkay, J. Parulek, N. Reuter, and H. Hauser, “Interactive visual analysis of temporal cluster structures,” Computer Graphics Forum, vol. 30, no. 3, pp. 711–720, 2011. [26] W. Dou, X. Wang, R. Chang, and W. Ribarsky, “ParallelTopics: a probabilistic approach to exploring document collections,” in Proceedings of the IEEE Conference on Visual Analytics Science and Technology, 2011, pp. 231–240.
IEEE TRANSACTIONS ON VISUALIZATION AND COMPUTER GRAPHICS, VOL. XX, NO. Y, MONTH 2014
[27] W. Cui, S. Liu, L. Tan, C. Shi, Y. Song, Z. Gao, H. Qu, and X. Tong, “TextFlow: Towards better understanding of evolving topics in text,” IEEE Transactions on Visualization and Computer Graphics, vol. 17, no. 12, pp. 2412–2421, 2011. [28] A. Hotho, A. N¨urnberger, and G. Paass, “A brief survey of text mining,” LDV Forum, vol. 20, no. 1, pp. 19–62, 2005. [29] T. Hofmann, “Probabilistic latent semantic analysis,” in Proceedings of the Conference on Uncertainty in Artificial Intelligence, 1999, pp. 289– 296. [30] D. M. Blei and J. D. Lafferty, “Dynamic topic models,” in Proceedings of the International Conference on Machine Learning, 2006, pp. 113– 120. [31] X. Wang and A. McCallum, “Topics over time: a non-Markov continuous-time model of topical trends,” in Proceedings of the ACM Conference on Knowledge Discovery and Data Mining, 2006, pp. 424– 433. [32] T. Iwata, T. Yamada, Y. Sakurai, and N. Ueda, “Online multiscale dynamic topic models,” in Proceedings of the ACM Conference on Knowledge Discovery and Data Mining, 2010, pp. 663–672. [33] C. Wang, D. Bleid, and D. Heckerman, “Continuous time dynamic topic models,” in Proceedings of the Conference on Uncertainty in Artificial Intelligence, 2008, pp. 579–586. [34] G. F. Lawler, Introduction to stochastic processes. Chapman & Hall/CRC, 1995. [35] X. Wang, S. Liu, Y. Song, and B. Guo, “Mining evolutionary multibranch trees from text streams,” in Proceedings of the 19th ACM SIGKDD International Conference on Knowledge Discovery and Data Mining, 2013, pp. 722–730. [36] X. Wang, K. Zhang, X. Jin, and D. Shen, “Mining common topics from multiple asynchronous text streams,” in Proceedings of the Second ACM International Conference on Web Search and Data Mining, ser. WSDM ’09. ACM, 2009, pp. 192–201. [37] X. Wang, C. Zhai, X. Hu, and R. Sproat, “Mining correlated bursty topic patterns from coordinated text streams,” in Proceedings of the 13th ACM SIGKDD International Conference on Knowledge Discovery and Data Mining, ser. KDD ’07. ACM, 2007, pp. 784–793. [38] J. Leskovec, L. Backstrom, and J. Kleinberg, “Meme-tracking and the dynamics of the news cycle,” in Proceedings of the 15th ACM SIGKDD International Conference on Knowledge Discovery and Data Mining, ser. KDD ’09. ACM, 2009, pp. 497–506. [39] Z. Gao, Y. Song, S. Liu, H. Wang, H. Wei, Y. Chen, and W. Cui, “Tracking and connecting topics via incremental hierarchical dirichlet processes,” in Data Mining (ICDM), 2011 IEEE 11th International Conference on, 2011, pp. 1056–1061. [40] S. Gad, N. Ramakrishnan, K. N. Hampton, and A. Kavanaugh, “Bridging the divide in democratic engagement: Studying conversation patterns in advantaged and disadvantaged communities,” in Proceedings of the IEEE Conference on Social Informatics, 2012. [41] N. Elmqvist and P. Tsigas, “Causality visualization using animated growing polygons,” in Proceedings of the IEEE Symposium on Information Visualization, 2003, pp. 189–196. [42] I. D. L. T. W. M. Shahriar Hossain, Naren Ramakrishnan, “How to alternatize a clustering algorithm,” in Data Mining and Knowledge Discovery, vol. 27, no. 2. Springer, 2013, pp. 193–224. [43] G. DiBattista, P. Eades, R. Tamassia, and I. G. Tollis, Graph Drawing: Algorithms for the Visualization of Graphs. Prentice Hall PTR, 1998. [44] Y. Tanahashi and K.-L. Ma, “Design considerations for optimizing storyline visualizations,” IEEE Transactions on Visualization and Computer Graphics, vol. 18, no. 12, pp. 2679–2688, 2012. [45] S. Liu, Y. Wu, E. Wei, M. Liu, and Y. Liu, “Storyflow: Tracking the evolution of stories,” IEEE Transactions on Visualization and Computer Graphics, vol. 19, no. 12, pp. 2436–2445, 2013. [46] M. Tory and T. M¨oller, “Evaluating visualizations: Do expert reviews work?” IEEE Computer Graphics & Applications, vol. 25, pp. 8–11, 2005. [47] D. Sacha, A. Stoffel, F. Stoffel, B. C. Kwon, G. Ellis, and D. A. Keim, “Knowledge generation model for visual analytics.” in IEEE Trans. Vis. Comput. Graph, vol. 20, no. 12, 2014, pp. 1604–1613. [48] A. Endert, M. Hossain, N. Ramakrishnan, C. North, P. Fiaux, , and C. An-drews., “The human is the loop: new directions for visual analytics,” in Journal of intelligent information systems, 2014, pp. 1–25. [49] Y. W. Teh, M. I. Jordan, M. J. Beal, and D. M. Blei, “Hierarchical dirichlet processes,” in Journal of the american statistical association, vol. Vol. 101, no. No. 476, pp. pp. 1566–1581.
14
Samah Gad received her Ph.D. degree from Virginia Tech in Blacksburg, VA, USA in 2014. She received her Master and Bachelor degrees in Computer Engineering from the Arab Academy for Science and Technology in Alexandria, Egypt. She is currently the Chief Technology Officer and Co-Founder of KustomNote, a SaaS company. Her research interest is data mining, visual analytics, and machine learning. Waqas Javed received the Ph.D. degree from Purdue University in West Lafayette, IN, USA in 2013. He received his Bachelor of Science in Electrical Engineering in 2007 from the University of Engineering and Technology, Lahore in Pakistan. Currently he is working as a HCI researcher at General Electric in San Ramon, CA, USA. His research interests include information visualization, visual analytics, and humancomputer interaction. Sohaib Ghani received the Ph.D. degree from Purdue University in West Lafayette, IN, USA in 2013. He received his Bachelor of Science in Electrical Engineering in 2007 from the University of Engineering and Technology, Lahore in Pakistan. Currently he is working as an assistant professor at KACST GIS Technology Innovation Center, Umm Al-Qura University, Makkah, KSA. His research interests include information visualization, visual analytics. Niklas Elmqvist received the Ph.D. degree in 2006 from Chalmers University of Technology in ¨ Goteborg, Sweden. Currently, he is an associate professor in the College of Information Studies at University of Maryland, College Park, MD, USA. He was previously an assistant professor in the School of Electrical & Computer Engineering at Purdue University in West Lafayette, IN. Before that he was a postdoctoral researcher in the Aviz group at INRIA Saclay in Paris, France. Tom Ewing is Associate Dean for Graduate Studies, Research, and Diversity in the College of Liberal Arts and Human Sciences and professor of History at Virginia Tech. His education includes a B.A. from Williams College and a Ph.D. in history from the University of Michigan. His articles on digital history have appeared in Perspectives on History, IEEE Computer, Social Education, and The Journal of Women’s History. Keith N. Hampton received his Ph.D. and his M.A. from the University of Toronto in 2001 and 1998, respectively, and a B.A. in sociology from the University of Calgary in 1996. He is an associate professor in the Department of Communication at Rutgers University. His research interests focus on the relationship between new information and communication technologies, social networks, democratic engagement, and the urban environment. Naren Ramakrishnan received his Ph.D. in Computer Sciences from Purdue University in 1997. He is currently the Thomas L. Phillips Professor of Engineering in the Department of Computer Science at Virginia Tech. His research has been supported by NSF, DHS, NIH, NEH, DARPA, IARPA, ONR, General Motors, HP Labs, NEC Labs, and Advance Auto Parts. He has served as both program chair and general chair of the IEEE International Conference on Data Mining (ICDM).