e.g., genetic algorithms (GAs) (Alba and Chicano, 2004;. Montana and Davis, 1989), evolution strategies (Mandis- cher, 2002), differential evolution (DE) (Ilonen ...
Soft Computing manuscript No. (will be inserted by the editor)
Training neural networks with ant colony optimization algorithms for pattern classification Michalis Mavrovouniotis · Shengxiang Yang
Received: December 7, 2013 / Revised: May 14, 2014 / Accepted: May 20, 2014
Abstract Feed-forward neural networks are commonly used for pattern classification. The classification accuracy of feed-forward neural networks depends on the configuration selected and the training process. Once the architecture of the network is decided, training algorithms, usually gradient descent techniques, are used to determine the connection weights of the feed-forward neural network. However, gradient descent techniques often get trapped in local optima of the search landscape. To address this issue, an ant colony optimization (ACO) algorithm is applied to train feed-forward neural networks for pattern classification in this paper. In addition, the ACO training algorithm is hybridized with gradient descent training. Both standalone and hybrid ACO training algorithms are evaluated on several benchmark pattern classification problems, and compared with other swarm intelligence, evolutionary and traditional training algorithms. The experimental results show the efficiency of the proposed ACO training algorithms for feed-forward neural networks for pattern classification. Keywords Neural networks · Pattern classification · Ant colony optimization
1 Introduction Artificial neural networks are commonly used for pattern classification problems (Carpenter and Grossberg, 1988; Dayhoff, 1990; Mehrotra et al, 1997; Zhang, 2000). Feed-forward neural networks are typically used to perform the classification task (Bishop, 1995). However, for a feed-forward neural Michalis Mavrovouniotis · Shengxiang Yang Centre for Computational Intelligence (CCI) School of Computer Science and Informatics De Montfort University The Gateway, Leicester, LE1 9BH, U.K E-mail: {mmavrovouniotis, syang}@dmu.ac.uk
network to perform classification properly, a prior configuration is required: (a) the architecture of the network needs to be determined, and (b) the connection weights of the network need to be determined. In this paper, we focus on the latter configuration of a feed-forward neural network, where the optimal combination of numerical values for the connections weights is to be found. Typically, gradient descent techniques, such as the backpropagation algorithm (Rumelhart et al, 1986), are used to adjust the connection weights. A serious drawback of gradient descent training techniques is that they often get trapped in local optima since they perform trajectory searching (Sutton, 1986; Whitley et al, 1990). One way to overcome this drawback is to adopt non-trajectory searching methods that perform longer “jumps” in the search space than trajectory methods, e.g., global optimization algorithms. Such algorithms are less likely to get trapped in a local optima than gradient descent algorithms. Usually, evolutionary algorithms, e.g., genetic algorithms (GAs) (Alba and Chicano, 2004; Montana and Davis, 1989), evolution strategies (Mandischer, 2002), differential evolution (DE) (Ilonen et al, 2003) and estimation of distribution algorithms (Cotta et al, 2001), are used to train feed-forward neural networks. Recently, another class of global optimization algorithms, i.e., swarm intelligence (Bonabeau et al, 1997), has been used for training. Swarm intelligence algorithms are inspired from the natural behaviour of social insects, such as the ant foraging, bird flocking, fish schooling, and so on. The applications of swarm intelligence for pattern classification include particle swarm optimization (PSO) (Carvalho and Ludermir, 2006; Mendes et al, 2002), artificial bee colony (ABC) (Karaboga and Ozturk, 2009) and ant colony optimization (ACO) (Blum and Socha, 2005; Socha and Blum, 2007). Among these developments, ACO has attracted less attention than PSO and ABC since it was originally introduced to solve discrete optimization problems (Dorigo and
2
Gambardella, 1997; Dorigo and St¨utzle, 2004) rather than training neural networks, which is a numerical (continuous) optimization problem (Socha, 2004; Socha and Blum, 2007). ACO training includes two main developments. First, the hybridization of ACO with back-propagation (Liu et al, 2006) uses the traditional ACO framework, where a population of ants construct solutions (e.g., a combination of connection weights) and update the pheromone table (Dorigo et al, 1996). Recently, an improved variation has been proposed in (Mavrovouniotis and Yang, 2013), which is based on the pheromone update policy of the MAX -MIN ant system (St¨utzle and Hoos, 1997). Second, the ACO for continuous optimization, denoted as ACOR , which follows a different approach from the well-known ACO framework, was proposed in (Blum and Socha, 2005). ACOR utilizes the continuous probability density function. The key idea of the aforementioned hybrid ACO with back-propagation training (Mavrovouniotis and Yang, 2013; Liu et al, 2006) is to run ACO for several iterations to select the initial connection weights, and then perform back-propagation training. This paper extends the work in (Mavrovouniotis and Yang, 2013) and applies backpropagation, as a local search improvement, to each solution constructed at each ACO iteration. To fully investigate the performance of the proposed ACO training methods, they are further compared with several other swarm intelligence, evolutionary and traditional training methods on several real-world problem datasets. The rest of the paper is outlined as follows. Sect. 2 describes the training process in neural networks. Sect. 3 describes the proposed ACO framework for training feedforward neural networks. In Sect. 4, the experimental results and analysis are given. Finally, several concluding remarks and direction for future work are given in Sect. 5.
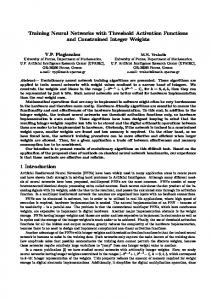
2 Training feed-forward neural networks 2.1 Description of artificial neural networks A feed-forward neural network consists of a number of units (neurons) that are allocated in different layers, i.e., input, hidden, or output layers, which are interconnected. Typically, directed graphs are used to represent the network, where nodes represent the units and arcs represent the connections between them. Each arc holds a value, which is the connection weight between a pair of units. Within the feedforward model, all connections of the network are strictly forwarded from the input units to the hidden units and finally to the output units. For example, Fig. 1a presents a feed-forward neural network with one input layer of three units, one hidden layer of five units and one output layer of two units.
(a)
(b) Fig. 1 a Feed-forward neural network with a single hidden layer. b Unit (from any layer) process of a feed-forward neural network
Each unit i performs a function, which is defined as: n X yi = fi wij xj − θi , (1) j=1
where fi represents the activation function (usually a sigmoid or Gaussian function) of unit i, yi is the output of unit i, wij represents the connection weight between units i and j, xj represents the j-th input of the unit and θi is the threshold (or bias) of unit i. An illustration of the processing of a unit, say unit i, is given in Fig. 1b.
2.2 Training artificial neural networks Once the network’s architecture is decided, then training needs to be performed to determine the weights of the connections before the network is used. Feed-forward neural networks are typically applied for pattern classification (Bishop, 1995) and supervised learning is a convenient way to train them. Supervised learning requires a training set that consists of several input parameters and corresponding target parameter that defines the correct classification. Each input parameter is associated with a single unit from the input layer and each different class is associated with a single unit from the output layer. The target parameter is used to calculate the network error, i.e., the difference between the actual and target outputs when training is performed. The squared error percentage (SEP) is used to measure the network error, which is defined as follows: omax − omin E, (2) SEP = 100 no np
3
where omax and omin are the maximum and minimum output values of the output unit, respectively, np and no represent the number of patterns and the number of output units, respectively, and E is the squared error, defined as follows: E=
np no X X
(tpi − opi )2 ,
(3)
p=1 i=1
where tpi and opi are the target and actual values of output unit i, respectively. Generally, the aim of training a neural network is to minimize the error, e.g., the SEP, of the network by adjusting the connection weights to generate a classifier that takes patterns as input and provides their correct classification as output. Traditional training algorithms, such as the back-propagation algorithm (Rumelhart et al, 1986) and the Levenberg-Marquardt algorithm (Levenberg, 1944; Marquardt, 1963; Hagan and Menhaj, 1994), have been successfully applied to train neural networks (Hinton, 1989; Lang et al, 1990; Fels and Hinton, 1993). The former algorithm is based on gradient descent and approximates the error of the network with a first-order expression, whereas the latter algorithm is based on the Newton method and approximates the error of the network with a second-order expression. Both back-propagation and Levenberg–Marquardt algorithms have a drawback because they often get trapped in local optima of the search landscape since they are local optimization algorithms (Sutton, 1986; Whitley et al, 1990). One way to avoid this drawback is to evolve the connection weights. Evolutionary algorithms, such as GAs (Alba and Chicano, 2004; Montana and Davis, 1989), evolution strategies (Mandischer, 2002), and estimation of distribution algorithms (Cotta et al, 2001), are typically used to perform the evolution process in the networks. Different from traditional training algorithms, evolutionary algorithms are global optimization methods, and thus, are less likely to get trapped in a local optimum. A comprehensive survey regarding evolutionary neural networks is available in (Yao, 1999). Recently, swarm intelligence techniques, including PSO (Mendes et al, 2002; Carvalho and Ludermir, 2006), ABC (Karaboga et al, 2007; Karaboga and Ozturk, 2009) and ACO (Socha and Blum, 2007), were also used to train neural networks. A review for other metaheuristics used for training neural networks is available in (Alba and Marti, 2006). There is a trade-off on whether training via metaheuristic is more efficient than training via gradient descent (Bullinaria, 2005). Some researchers have demonstrated that standalone evolutionary training is faster than gradient descent training (Montana and Davis, 1989), whereas other researchers have demonstrated that there is no any significant difference between the two types of training and the difference really depends on the problem (Socha and Blum, 2007). However, hybrid training with a GA (Alba and Chi-
cano, 2004) or ACO (Liu et al, 2006; Socha and Blum, 2007; Mavrovouniotis and Yang, 2013) usually performs better than standalone metaheuristics or gradient descent algorithms. This is due to the fact that metaheuristics are global optimization algorithms and they are less sensitive on the initial condition of training whereas local optimization algorithms find the local optimum in the neighbourhood of the initial weights given. For example, in many cases the initial weights selected for back-propagation may lead to a very poor local optimum. To address this issue, some hybrid training algorithms use the best values obtained from ACO training as the initial weights for back-propagation training (Liu et al, 2006; Mavrovouniotis and Yang, 2013). The idea is to select a promising neighbourhood by ACO training and then search for the optimum by gradient descent training. Furthermore, it was discussed that simple training algorithms usually perform better than complex ones (Cantu-Paz and Kamath, 2005). In fact, it was suggested that instead of using a single large network to solve large and complex problems, it is better to use a neural network ensemble that adopts the divide-and-conquer strategy (Yao and Liu, 1996, 1998). A neural network ensemble combines a set of simple networks that learn to decompose the problem into subproblems and then solve them efficiently (Yao and Islam, 2008).
3 The ant colony optimization training algorithm The ACO metaheuristic is inspired by the foraging behaviour of real ant colonies. ACO algorithms were initially proposed to solve combinatorial optimization problems (Dorigo and Gambardella, 1997; Bullnheimer et al, 1999; Dorigo et al, 1999). In general, an ACO algorithm consists of two modes, i.e., the forward and backward modes. In the forward mode, a population of ants construct solutions probabilistically based on existing pheromone trails. In the backward mode, the solution constructed, including the solution quality, is used to update pheromone trails. After several iterations, the ants will converge into a near-optimum or optimum solution. Recently, ACOR was proposed (Socha, 2004) and applied to train feed-forward neural networks since the training process can be considered as a continuous optimization process (Blum and Socha, 2005; Socha and Blum, 2007). ACOR utilizes the continuous probability density function. More precisely, a solution archive is maintained in which the worst solutions are replaced in every iteration. The solutions are constructed by sampling several probability density functions which are derived from the solution archive. The results of ACOR showed that a standalone ACO training algorithm is outperformed by gradient descent training, whereas a hybrid ACOR with back-propagation
4
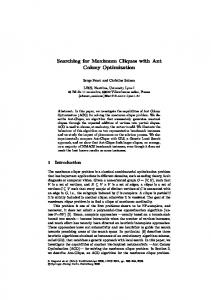
Fig. 3 Solution construction of an ant that has already selected values ai1h and ai2h for connection weights wi1 and wi2 , respectively, which are stored in the ant’s memory
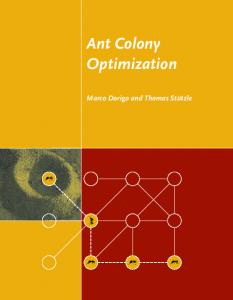
Fig. 2 Framework of the ACO training for feed-forward neural networks
or Levenberg–Marquardt training outperforms gradient descent training. A different ACO training was proposed in (Liu et al, 2006) that uses a framework that is close to the original ACO framework rather than the ACOR framework. The key idea is to apply ACO training to find good initial weights for the back-propagation which is applied when ACO training is terminated. Their results showed that the ACO with backpropagation hybrid training is more effective and efficient than the standalone back-propagation algorithm. Later on, the above ACO training was improved by imposing limits to the pheromone trails (Mavrovouniotis and Yang, 2013). In this paper, the ACO training based on the framework proposed in (Mavrovouniotis and Yang, 2013) is extended and furthermore investigated. The new framework is as shown in Fig. 2. The main extension is that backpropagation training is applied after each ACO iteration rather than when the ACO training terminates. In the following subsections, the proposed ACO training is described in more details. 3.1 Initialization For ACO training, the optimal combination of connection weight values needs to be found. Given a neural network, the number of connection weights l is calculated as: l = nh (ni + 1) + no (nh + 1),
(4)
where nh , ni and no are the number of hidden, input, and output units, respectively. The additional units represents the bias inputs of the units. Hence, ACO becomes a sufficient choice to select good combinations due to its good performance on different combinatorial optimization problems. The key idea is to split the value range of each connection weight wij from unit i to unit j into d discrete
points aijh (h = 1, 2, . . . , d), which are generated from a normal distribution. Each connection weight point aijh is assigned a pheromone value τijh in the pheromone table. The pheromone table is initialized with an equal amount of pheromone for all trails in the table as follows: τijh ← 1/(ni + nh + no ), ∀ aijh .
(5)
where ni , nh and no are as defined in Eq. 4.
3.2 Probabilistic solution construction In the probabilistic solution construction, each ant selects one and only one discrete point for each connection weight. All the selected points of the previously visited connection weights are stored in the ant’s (partial) memory. The dimension of an ant’s memory is determined by the number of connection weights in the network, i.e., l, as defined in Eq. 4. More precisely, with a probability 1 − q, where q (0 ≤ q ≤ 1) is a parameter of the decision rule, an ant chooses a value for wij from the set of discrete points probabilistically as follows: τijh , pijh = Pd k=1 τijk
(6)
where pijh is the probability of selecting aijh for wij , d represents the number of discrete points, and τijh represents the existing pheromone trail assigned with aijh . Figure 3 illustrates how an ant selects values for the connection weights of unit i. For example, the values ai1h and ai2h have been selected for connection weights wi1 and wi2 , respectively. Next, the ant needs to decide either with the probability 1 − q to select a value for wi3 according to the existing pheromone trails or with the probability q to choose the value with the maximum amount of pheromone. Note that the parameter q is used to tune the exploration and exploitation of the algorithm. The selection of discrete points is repeated until all ants have selected values for all l connection weights.
5
3.3 Pheromone update policy When all ants choose a value for each connection weight, including the bias weight, the pheromone update procedure starts. Only the best ant retraces its values selected for each weight in the construction phase and deposits pheromone as: best τijh ← τijh + ∆τijh , ∀ aijh ∈ T best ,
(7)
where T best is the combination of discrete points selected by best the best-so-far ant and ∆τijh is the amount of pheromone to be deposited, which is defined as follows: best ∆τijh = 1/E best , best
(8)
Problem
Structure
Dimension
Training
Testing
Cancer Diabetes Heart Thyroid Gene Horse Card Glass Soybean
9-6-2 8-6-2 35-6-2 21-6-3 120-6-3 58-6-3 51-6-2 9-6-6 82-6-19
74 68 230 153 747 375 326 102 631
525 576 690 5400 2382 273 518 161 513
174 192 230 1800 793 91 172 53 170
best
where E is the network error of the T combination, as defined in Eq. 2. Hence, the less network error, the more pheromone is deposited since the inverse of the network error is considered. Furthermore, pheromone evaporation is applied to reduce all pheromone trails as follows: τijh ← (1 − ρ)τijh , ∀ aijh ,
Table 1 Structure and dimension of feed-forward neural networks together with the set division of the different benchmark problems used in the experiments
(9)
where ρ ∈ (0, 1) is a constant that defines the pheromone evaporation rate. The pheromone evaporation helps to eliminate bad decisions made in the past. Within the proposed ACO training, the possible pheromone trail values are limited to the range [τmin , τmax ], where τmax = 1/(ρE best ) is the maximum pheromone trail limit, ρ is defined in Eq. 9, E best is the network error of the best combination, τmin = τmax /(2l) is the minimum pheromone trail limit, and l is as defined in Eq. 4. The differences between the proposed ACO training and the one described in (Liu et al, 2006) are (a) only the best-sofar ant is allowed to deposit pheromone and (b) pheromone trail limits are imposed. It is very important to keep the maximum and minimum pheromone trail values at a closer range to eliminate the high intensity of pheromone trails that may bias ants to search at non-promising areas. In fact, the experiments in (Mavrovouniotis and Yang, 2013) support this claim.
3.4 Local search improvements Metaheuristics (such as ACO) which do not consider any gradient descent information when training a network, may not be as accurate as those methods that use this information. Therefore, when an ant constructs a solution, a gradient descent approach can be applied to improve the accuracy of ACO training. Gradient descent methods perform small step jumps to a neighbourhood of the search landscape and, thus, can locate the optimum nearby. However, the (local) optimum located may be far from the global optimum. In contrast, ACO performs large-step jumps and is more difficult to reach the
optimum in a neighbourhood. However, ACO is more likely to discover different neighbourhoods than a gradient descent method due to its stochastic components. Considering both aspects, a hybrid training method can be applied: the ACO training can be used to discover a promising neighbourhood, possibly containing the global optimum, in the search space, and the gradient descent training can be used to locate the optimum in that specific neighbourhood. 4 Experimental study 4.1 Experimental setup To evaluate the performance of the proposed ACO training algorithm, it is compared with other algorithms in training feed-forward neural networks for solving different benchmark classification problems (Prechelt, 1994). The details regarding the configuration of the networks and datasets used for different problems are shown in Table 1. The experimental study is divided into three parts. The algorithms implemented and compared in the first part of the experimental study (see Subsect. 4.2) include the following: 1. Back-propagation (BP) (Rumelhart et al, 1986): the basic back-propagation training without any acceleration or other tweaking techniques such as momentum and so on. 2. Levenberg–Marquardt (LM) (Hagan and Menhaj, 1994): the standard Levenberg-Marquardt training, which is another gradient descent algorithm. 3. ACO-BP: the proposed ACO training algorithm with the combination of back-propagation, where each solution constructed by ACO undergoes a local search improvement by back-propagation. 4. Random constructive heuristic (RCH): this algorithm constructs solutions at each iteration in the same way as ACO but without any pheromone trail reinforcement. Next, the second part of the experimental study (see Subsect. 4.3) is used to compare the proposed ACO training with
6
ACOR (Socha and Blum, 2007), an existing ACO training from the literature that does not follow the original ACO framework. The aim of these two experimental studies is to investigate the effect of pheromone trails on the training of feed-forward neural networks. Hence, a partial set containing the most commonly used benchmark instances is used. Finally, the third part of the experimental study (see Subsect. 4.4) is used to compare the proposed ACO training against other nature-inspired metaheuristics used for training feed-forward neural networks on the complete set of benchmark instances. All the algorithms perform 1, 000 function evaluations in order to have a fair comparison. A fourfold cross-validation is used, where a set of patterns is divided into four equal subsets. Then, four experiments are performed where one subset is used as the testing dataset (patterns that the network has never seen before) and the remaining subsets are used as the training dataset. The classification error percentage (CEP) for a single experiment from the four cross-validation experiments is computed as follows: CEP = 100
# of misclassif ied patterns # of testing patterns
–
–
(10)
and the result of the set division between the training and testing dataset is averaged over 50 independent runs on a set of different random seeds.
–
4.1.1 Benchmark problems – The aim of classification problems is to determine the class that a certain pattern belongs to. Each pattern within a problem instance consists of an input and an output vector formed by real numbers. To interpret the output of the classification problem, the winner-takes-all method is used. More precisely, an output unit is associated with each different class. Therefore, when an input vector is pushed in the neural network, the network’s classification result is pulled out from the output unit with the larger value. Different real-world benchmark datasets taken from the UCI repository (Bache and Lichman, 2013; Prechelt, 1994) are used in this study. The first six benchmark problems rise from the medical field whereas the remaining three from other scientific fields. They are described as follows: – Cancer: Taken from a database of diagnostics of breast cancer obtained by Dr. William H. Wolberg from the University of Wisconsin Hospitals, Madison (Bennett and Mangasarian, 1992; Mangasarian et al, 1990; Wolberg, 1990; Wolberg and Mangasarian, 1990). It consists of 699 patterns, each of which consists of 9 inputs and 2 outputs. – Diabetes: Based on personal data and medical examinations which decide whether a Pima Indian is diabetes
–
–
–
or not. The dataset contains a redundancy of senseless 0 values that most probably indicate missing or noisy data. It consists of 768 patterns, each of which consists of 8 inputs and 2 outputs. Heart: Based on medical examinations which predict heart disease obtained from four different sources: (1) Hungarian Institute of Cardiology, Budapest (Andras Janosi, M.D.); (2) University Hospital, Zurich, Switzerland (William Steinbrunn, M.D.); (3) University Hospital, Basel, Switzerland (Matthias Pfisterer, M.D.); and (4) V.A. Medical Center, Long Beach and Cleveland Clinic Foundation (Robert Detrano, M.D., Ph.D.) (Detrano et al, 1989; Gennari et al, 1989). More precisely, the dataset decides whether at least one of four major vessels is reduced in diameter by more than 50 %. It consists of 920 patterns, each of which consists of 35 inputs and 2 outputs. Thyroid: Based on patient query and patient examination data. This dataset is used to diagnose thyroid hyperor hypo-function. It consists of 7200 patterns, each of which has 21 inputs and 3 outputs representing whether the patient’s thyroid has overfunction, normal function, or underfunction. Gene: Contains data from a window of 60 DNA sequence elements and has two different classes, i.e., donor or acceptor. It is used to predict whether the middle of the sequence is a donor, an acceptor, or none of these. It consists of 3, 175 patterns, each of which consists of 120 input and 3 outputs. Horse: Based on the veterinary examination results of a horse having a colic. This dataset is used to predict whether the horse will survive, die, or be euthanized. The data contain 314 patterns, each of which consists of 58 inputs and 3 outputs. Card: Contains real credit card application (unexplained for confidence reasons) used to predict whether the bank granted the credit card or not. It contains 690 patterns, each of which consists of 51 inputs and 2 outputs. Glass: Based on the results of a chemical analysis of glass splinters which is used to classify different glass types, e.g., building windows, vehicle windows, and so on. It consists of 214 patterns, each of which consists of 9 inputs and 6 outputs. The number of patterns that represent different classes are not even, since the sizes of the six classes are 70, 76, 17, 13, 9 and 29, respectively. Soybean: Based on a description of the bean, the plant and the plant’s life. For example, whether the bean size and colour are normal or whether the seed of the plant was treated, and so on. It consists of 683 patterns, each of which consists of 35 inputs and 19 outputs.
Since cross-validation is used, the first 75 % patterns of a dataset is used as the training dataset and the remaining 25 % is used as the testing dataset. Table 1 indicates the division
7 Table 2 Parameter settings for the algorithms investigated on three datasets from the medical field used in the basic experiments Algorithm
m
q
Cancer ρ
η
β
m
q
Diabetes ρ
η
β
m
q
ACO ACO-BP BP LM RCH
2 2 2
0.05 0.05 0.0
0.3 0.3 -
0.01 0.002 -
50 -
2 2 2
0.05 0.05 0.0
0.3 0.3 -
0.01 0.01 -
5 -
2 2 2
0.05 0.05 0.0
of the training and testing dataset. For each experiment in cross-validation, the same sizes of the datasets are used. 4.1.2 Parameter settings The structure of the networks is inspired by the literature (Socha and Blum, 2007; Alba and Chicano, 2004; Karaboga and Ozturk, 2009; Mavrovouniotis and Yang, 2013) and they are given in Table 1. The network architecture for each benchmark problem consists of one input layer, one hidden layer, and one output layer. The number of sigmoid units for each layer is shown in the format input-hidden-output. The dimension defines the number of connection weights within a network calculated in Eq. 4. The reason that the specific structures are used is for the convenience to later on compare the results of the proposed algorithms with the results of another ACO training algorithm (Socha and Blum, 2007) and other bio-inspired training algorithms (Karaboga and Ozturk, 2009), which have used the same network architectures on the same cross-validation experiments. Therefore, a fair comparison between the results of the proposed ACO training algorithm with other existing results can be given. The parameters of the aforementioned algorithms used for the three benchmark problems, i.e., Cancer, Diabetes and Heart, were mainly inspired by the literature (Socha and Blum, 2007; Mavrovouniotis and Yang, 2013). They are presented in Table 2, where m is the ant population size, q defines the exploration of the solution construction and ρ is the evaporation rate for ACO-based algorithms, η is the learning rate for BP, and β is the factor for LM. Not included in the table is the parameter d for ACO, ACO-BP and RCH, which is set to d = 30 for all problems and defines the number of discrete points for connection weights. Note that RCH does not have an evaporation rate because pheromone trails are not considered during the solution construction.
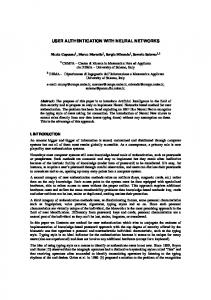
4.2 Analysis of the ACO training results The experimental results of the algorithms on three benchmark problems taken from the medical field regarding CEP are presented in box-plots in Fig. 4a–c, for the datasets Cancer, Diabetes, and Heart, respectively. Each figure illustrates
Heart ρ 0.3 0.3 -
η
β
0.01 0.001 -
1.5 -
the distribution of the CEP values, averaged for all fourfold cross-validation experiments, between the first and third quartiles. The corresponding Wilcoxon rank sum statistical results (with Bonferroni correction) of the algorithms on the testing datasets are presented in Table 3. Finally, the CEP results on both testing and training datasets, for each algorithm of all fourfold cross-validation experiments, are presented in Table 4. From the experimental results several observations can be drawn. The Cancer problem (see Fig. 4a and Table 3) appears to be an easy dataset to classify. All algorithms, including the RCH training method, have good performance. The fact that RCH has reasonably good CEP, even if it is the worst performing algorithm, supports the claim that the dataset is easy to classify. However, none of the algorithms was able to classify all the patterns from the testing dataset correctly, which is probably due to the limited size of the training set. The best performing algorithm is ACO-BP, which significantly outperforms standalone ACO and BP training algorithms. ACO significantly outperforms LM training, whereas is significantly outperformed by BP. The Diabetes problem (see Fig. 4b and Table 3) appears to be a noisy dataset, as described previously, and more difficult to classify than the Cancer dataset. All algorithms have a relatively poor performance in terms of CEP, which may indicate that the training dataset might not represent all the necessary patterns to better classify the patterns from the testing dataset. RCH is significantly outperformed by its competitors. The standalone BP is the best performing algorithm followed by ACO-BP. A standalone ACO is outperformed by both traditional training algorithms, i.e., BP and LM, and by the hybrid ACO-BP. The Heart problem (see Fig. 4c and Table 3) is a larger dataset than Cancer and Diabetes problems. All the algorithms are significantly different, whereas the best performing algorithm is the ACO-BP algorithm followed by LM, BP, ACO and RCH, respectively. More precisely, BP and LM outperform the standalone ACO algorithm, whereas the hybrid ACO-BP algorithm outperforms both gradient descent techniques. This may be due to the dimension of the Heart data, which is significantly larger than the other two datasets, and thus, the probability of an algorithm to get
8 Table 3 Statistical significance of the CEP experimental results. The values of “+” and “−” indicate that the two algorithms are significantly and insignificantly different, respectively
Cancer 40 35 30
CEP
25 20 15 10 5 0 ACO ACO-BP BP
LM
RCH
(a) Diabetes 45 40
Algorithm
ACO
Cancer ACO ACO-BP BP LM RCH
+ + + +
Diabetes ACO ACO-BP BP LM RCH
+ + + +
Heart ACO ACO-BP BP LM RCH
+ + + +
ACO-BP
BP
LM
RCH
+
+ +
+ + +
+ + + +
+ + + + + + + + + + +
+ + + + + + + + − +
+ + + +
+ + + +
+ + + −
+ + + +
+
CEP
35
Table 4 Experimental results regarding CEP for each algorithm over all runs for all cross-validation experiments on both testing and training sets
30 25
Algorithm Cancer Diabetes Heart Algorithm Testing Training Testing Training Testing Training
20 15 ACO ACO-BP BP
LM
RCH
(b)
ACO ACO-BP BP LM RCH
3.66 2.87 3.04 4.63 6.67
2.46 1.51 2.46 1.81 7.52
25.75 22.81 22.18 23.92 31.64
22.47 19.53 21.38 21.04 30.74
21.68 16.78 18.07 17.52 27.08
17.64 10.87 16.03 4.23 27.01
Heart 45 40
CEP
35 30 25 20 15 10 ACO ACO-BP BP
LM
RCH
(c) Fig. 4 Box plots of the CEP results on three datasets: a Cancer, b Diabetes, and c Cancer
stuck in a local optima of the search landscape increases significantly. Generally speaking, the standalone BP training technique is usually outperformed by the hybrid ACO-BP training, especially in the Heart dataset. This is probably be-
cause the selected initial weights of the BP may lead to a poor local optimum as it was observed previously in (Liu et al, 2006; Mavrovouniotis and Yang, 2013). It is interesting to observe that the pheromone trail mechanism is useful and improves the training process of the network. This can be supported from the fact that the ACO training (with pheromone trails) significantly outperforms the RCH training (without pheromone trails) in all problems. Furthermore, the standalone ACO training is outperformed by BP and LM training techniques since ACO does not perform trajectory searching. Therefore, it is difficult to locate the optimum in a specific neighbourhood accurately because it performs large-step jumps in the search landscape. In contrast, ACOBP outperforms both the standalone BP and ACO training techniques since it has less risk to get trapped in a local optima and improves the searching accuracy, simultaneously. Finally, if the CEP results of the testing over the training datasets are compared, it can be seen that all the algorithms do not suffer from strong over-fitting except LM in the Cancer and Heart datasets. ACO-BP suffers from slight over-fitting especially in the Heart dataset. Probably, a dif-
9 Table 5 Pairwise comparison of the CEP results of the proposed ACO and ACO-BP with the results of another existing ACO based training obtained from (Socha and Blum, 2007). The best value from each pair (i.e., ACO with ACOR and ACO-BP with ACOR -BP) for each problem is indicated in bold
Cancer Diabetes Heart
ACO
ACOR
ACO-BP
ACOR -BP
3.66 25.75 21.68
4.02 24.48 20.67
2.87 22.81 16.78
3.45 23.96 18.00
ferent number of cross-validation experiments or different divisions of the dataset into training and testing sets may be necessary to avoid over-fitting. In fact, the CEP results may be furthermore improved when over-fitting is avoided.
4.3 Comparison with other ACO training algorithms It is interesting to compare the performance of the standalone ACO and hybrid ACO-BP training algorithms for neural networks with the corresponding continuous ACO variations, denoted ACOR and ACOR -BP (Socha and Blum, 2007), respectively. The two existing training algorithms were applied with the same stopping criteria (i.e., 1000 function evaluations) and performed the same fourfold crossvalidation with the proposed training algorithms. Table 5 summarizes the results obtained from ACOR and ACOR -BP (Socha and Blum, 2007) and pair-wisely compares them with the proposed ACO and ACO-BP, respectively. The standalone ACO has better performance than the standalone ACOR in the Cancer problem instance, whereas the latter algorithm has better performance than the former algorithm in the Diabetes and Heart problem instances, either significantly or insignificantly. In contrast, the hybrid ACO-BP has better performance than the hybrid ACOR -BP in all problem instances.
ACO training for a fair comparison. Table 6 summarizes the results of the training algorithms obtained from (Karaboga and Ozturk, 2009) together with our ACO training results. All the algorithms are applied on a complete set of benchmark instances described previously in Sect. 4.1.1 and they use the same network’s architecture given in Table 1. ACO performs better than the other bio-inspired algorithms on the Diabetes, Thyroid, Horse, Card and Soybean datasets. ABC outperforms its competitors on Cancer, Heart and Gene datasets, whereas DE obtains the best result on Glass datasets. ACO performs better than the gradient descent algorithms on the Diabetes, Horse and Card datasets, whereas LM performs better on the Thyroid, Glass and Soybean datasets. On most problems, the results are relatively close in terms of CEP, expect on Gene, Horse, Glass and Soybean datasets. It is interesting to observe that most of these problem instances, e.g., Gene, Horse and Soybean, are among the largest problem instances according to the dimensions of the networks shown in Table 1. This further supports our observation above that large problem instances are often difficult to classify due to the many possible local optima they might contain. Generally speaking, among the bio-inspired training algorithms the proposed ACO training algorithm achieves the best result for more datasets than its competitors, closely followed by the ABC training algorithm. Although ACO has better performance than ABC, the latter has better robustness than ACO. This can be observed from the experimental results, where ABC maintains lower standard deviation but higher CEP, whereas ACO maintains higher standard deviation but lower CEP. Finally, LM and ACO training algorithms achieve the best results for three datasets among all training algorithms, whereas ABC achieves the best results for the remaining two datasets. 5 Conclusions
4.4 Comparison with other bio-inspired and gradient descent training algorithms The proposed ACO training is further compared with other training algorithms inspired from nature, such as the GA, PSO, ABC and DE algorithms and gradient descent training algorithms, such as BP and LM. The aforementioned algorithms used for network training were applied with a different stopping criterion in (Karaboga and Ozturk, 2009), i.e., maximum 2, 000 function evaluations or when SEP ≤ 0.01 for 50 runs1 . The same settings were applied to the proposed 1
The authors in (Karaboga and Ozturk, 2009) performed only the first cross-validation of our fourfold cross-validation experiments. Therefore, the results of the proposed ACO refer only to the first crossvalidation dataset division.
The connection weights in feed-forward neural networks are usually adjusted using gradient descent methods. Often such methods may get trapped to local optima of the search landscape. In this paper, an ACO training is proposed where a population of ants select different combinations for connection weight values. A standalone ACO and a hybrid ACO-BP training are applied to train feed-forward neural networks for pattern classification. Several real-world benchmark problems are selected as test problems in the experiments. The performance of ACO and ACO-BP training is compared against: two traditional training methods (i.e., BP and LM), an ACO training without pheromone consideration (i.e., RCH), a standalone ACO and a hybrid ACO from the literature (Socha and Blum, 2007) (i.e., ACOR and ACOR -BP), respectively, and four other training algorithms
10 Table 6 Comparison of the CEP results with their standard deviation of the proposed ACO training on a several benchmark datasets with the results of other bio-inspired training algorithms obtained from (Karaboga and Ozturk, 2009). The best value among all algorithms for each problem is indicated in bold Problem
ACO
GA
PSO
ABC
DE
BP
LM
Cancer Diabetes Heart Thyroid Gene Horse Card Glass Soybean
1.42 ± 1.05 24.43 ± 4.65 20.02 ± 1.60 6.31 ± 0.09 30.05 ± 1.89 27.56 ± 6.22 12.90 ± 3.01 45.77 ± 8.25 36.42 ± 6.84
1.35 ± 0.28 26.51 ± 1.21 20.60 ± 0.68 7.09 ± 0.03 31.02 ± 0.71 29.12 ± 2.84 13.56 ± 1.21 50.18 ± 3.15 40.39 ± 4.93
2.01 ± 0.86 27.50 ± 2.05 21.87 ± 1.45 7.27 ± 0.02 36.30 ± 2.10 31.14 ± 3.94 15.58 ± 1.59 52.49 ± 7.14 60.50 ± 8.50
1.14 ± 0.00 25.22 ± 0.97 19.48 ± 1.41 6.95 ± 0.01 29.50 ± 1.88 28.63 ± 2.61 13.53 ± 1.17 45.62 ± 3.11 38.63 ± 3.18
1.19 ± 0.28 24.84 ± 1.32 20.33 ± 1.29 7.08 ± 0.95 31.18 ± 2.18 29.29 ± 2.72 13.90 ± 1.26 44.90 ± 2.84 74.90 ± 2.10
1.89 ± 0.43 28.27 ± 6.30 21.44 ± 0.55 7.26 ± 0.00 11.37 ± 1.15 27.84 ± 2.12 13.86 ± 0.47 59.09 ± 9.52 61.16 ± 19.18
8.18 ± 10.29 29.80 ± 3.77 24.96 ± 7.40 2.61 ± 1.81 14.35 ± 2.48 33.79 ± 4.50 21.59 ±7.98 42.99 ± 11.55 25.51 ± 9.89
inspired from nature (i.e., GA, PSO, ABC and DE) from the literature (Karaboga and Ozturk, 2009). From the experimental results, several concluding remarks can be drawn. First, ACO is a good choice for selecting good values for the BP. The standalone ACO training is outperformed by the standalone ACOR training whereas the hybrid ACO-BP shows superior performance, especially on large problem instances. Second, the performance of gradient descent methods is degraded as the problem size increases when compared with the hybrid ACO-BP training algorithm. Third, gradient descent methods usually have better performance than a standalone metaheuristic training, including ACO training. This is because gradient descent methods are more accurate than metaheuristic methods in terms of searching. Finally, ACO has a relatively good performance when compared with other metaheuristics in network training for pattern classification. However, different metaheuristics perform better on different problem instances due to the problem dependency issue. In general, the ACO metaheuristic can be a useful technique in neural network training for pattern classification especially when it is hybridized with gradient descent training. For future work, it will be interesting to apply LM as a local search improvement with ACO, or even apply both BM and LM as local search improvements. Moreover, it will be interesting to investigate ACO’s training adaptability to a dynamic environment (Rakitianskaia and Engelbrecht, 2012). Acknowledgements The authors would like to thank the anonymous reviewers for their thoughtful suggestions and constructive comments. This work was supported by the Engineering and Physical Sciences Research Council (EPSRC) of UK under Grant EP/K001310/1.
References Alba E, Chicano J (2004) Training neural networks with ga hybrid algorithms. In: Deb K (ed) Proceedings of the 2004
Genetic and Evolutionary Computation Conference, vol 3102, LNCS, Springer, Berlin, pp 852–863 Alba E, Marti R (eds) (2006) Metaheuristic procedures for training neural networks. Springer, New York Bache K, Lichman M (2013) UCI machine learning repository. URL http://archive.ics.uci.edu/ml Bennett KP, Mangasarian OL (1992) Robust linear programming discrimination of two linearly inseparable sets. Optim Methods Softw 1(1):23–34 Bishop C (1995) Neural networks for pattern recognition. Ofxord University Press, Oxford Blum C, Socha K (2005) Training feed-forward neural networks with ant colony optimization: an application to pattern classification. In: 2005. HIS ’05. Fifth International Conference on Hybrid Intelligent Systems Bonabeau E, Dorigo M, Theraulaz G (eds) (1997) Swarm intelligence: from natural to artificial systems. Oxford University Press, New York Bullinaria J (2005) Evolving neural networks: is it really worth the effort? In: Proceedings of the European Symposium on Artificial Neural Networks, pp 267–272 Bullnheimer B, Hartl R, Strauss C (1999) A new rank-based version of the ant system: a computational study. Cent Eur J Oper Res Econ 7(1):25–38 Cantu-Paz E, Kamath C (2005) An empirical comparison of combinations of evolutionary algorithms and neural networks for classification problems. IEEE Trans Syst, Man, and Cybern-Part B: Cybern 35(5):915–927 Carpenter G, Grossberg S (1988) The art of adaptive pattern recognition by a self-organizing neural network. IEEE Comput 21:77–88 Carvalho M, Ludermir T (2006) Hybrid training of feedforward neural networks with particle swarm optimization. In: King I, Wang J, Chan LW, Wang D (eds) Neural information processing, vol 4233, LNCS, Springer, Berlin, pp 1061–1070 Cotta C, Alba E, Sagarna R, Larra˜naga P (2001) Adjusting weights in artificial neural networks using evolutionary algorithms. Estimation of distribution algorithms: a new
11
tool for evolutionary computation, pp 361–378 Dayhoff J (ed) (1990) Neural-network architectures: an introduction, 1st edn. Van Nostrand Reinhold, New York Detrano R, Janosi A, Steinbrunn W, Pfisterer M, Schmid JJ, Sandhu S, Guppy KH, Lee S, Froelicher V (1989) International application of a new probability algorithm for the diagnosis of coronary artery disease. Am J Cardiol 64(5):304–310 Dorigo M, Gambardella LM (1997) Ant colony system: a cooperative learning approach to the traveling salesman problem. IEEE Trans Evolut Comput 1(1):53–66 Dorigo M, St¨utzle T (eds) (2004) Ant colony optimization. MIT Press, London Dorigo M, Maniezzo V, Colorni A (1996) Ant system: optimization by a colony of cooperating agents. IEEE Trans Syst Man Cybern-Part B: Cybern 26(1):29–41 Dorigo M, Caro GD, Gambardella LM (1999) Ant algorithms for discrete optimization. Artif Life 5(2):137–172 Fels S, Hinton G (1993) Glove-talk: a neural network interface between a data-glove and a speech synthesizer. IEEE Trans in Neural Netw 4:2–8 Gennari JH, Langley P, Fisher D (1989) Models of incremental concept formation. Artifi Intell 40(13):11–61 Hagan M, Menhaj M (1994) Training feedforward networks with the marquardt algorithm. IEEE Trans on Neural Netw 5(6):989–993 Hinton G (1989) Connectionist learning approaches. Artif Intell 40(1-3):185–234 Ilonen J, Kamarainen JK, Lampinen J (2003) Differential evolution training algorithm for feed-forward neural networks. Neural Process Lett 17(1):93–105 Karaboga D, Ozturk C (2009) Neural networks training by artificial bee colony algorithm on pattern classification. Neural Netw World 3:279–292 Karaboga D, Akay B, Ozturk C (2007) Artificial bee colony (abc) optimization algorithm for training feed-forward neural networks. In: Torra V, Narukawa Y, Yoshida Y (eds) Modeling decisions for artificial intelligence, vol 4617, LNCS, Springer, Berlin, pp 318–329 Lang K, Waibel A, Hinton G (1990) A time-delay neural network architecture for isolated word recognition. Neural Netw 3(1):33–43 Levenberg K (1944) A method for solution of certain problems in least squares. Q Appl Math 2:164–168 Liu YP, Wu MG, Qian JX (2006) Evolving neural networks using the hybrid of ant colony optimization and bp algorithm. In: Advances in Neural Networks–3rd International Symposium on Neural Networks, Springer-Verlag, LNCS, vol 3971, pp 714–722 Mandischer M (2002) A comparison of evolution strategies and backpropagation for neural network training. Neurocomputing 42(1):87–117
Mangasarian O, Setiono R, Wolberg WH (1990) Pattern recognition via linear programming: Theory and application to medical diagnosis. In: Coleman T, Li Y (eds) Large-scale numerical optimization, SIAM Publications, Philadelphia, pp 22–31 Marquardt D (1963) An algorithm for least-squares estimation of nonlinear parameters. SIAM J Appl Math 11:431– 441 Mavrovouniotis M, Yang S (2013) Evolving neural networks using ant colony optimization with pheromone trail limits. In: Proceedings of the 2013 UK Workshop on Computational Intelligence, IEEE Press, pp 16–23 Mehrotra K, Mohan C, Ranka S (eds) (1997) Elements of artificial neural networks. MIT Press, Cambridge Mendes R, Cortez P, Rocha M, Neves J (2002) Particle swarms for feedforward neural network training. In: Neural Networks, 2002. IJCNN ’02. Proceedings of the 2002 International Joint Conference on, vol 2, pp 1895–1899 Montana D, Davis L (1989) Training feedforward neural network using genetic algorithms. In: Proceedings of the 11th International Joint Conference Artificial Intelligence, Morgan Kaufmann, pp 762–767 Prechelt L (1994) Proben1–a set of neural network benchmark problems and benchmarking rules. Tech. Rep. 21, University Karlsruhe, Germany Rakitianskaia A, Engelbrecht A (2012) Training feedforward neural networks with dynamic particle swarm optimisation. Swarm Intell 6(3):233–270 Rumelhart D, Hinton G, Williams R (1986) Learning representations by backpropagation errors. Nature 536:323– 533 Socha K (2004) Aco for continuous and mixed-variable optimization. In: Dorigo M, Birattari M, Blum C, Gambardella LM, Mondada F, St¨utzle T (eds) Proceedings of the 4th International Workshop on Ant Algorithms and Swarm Intelligence, Springer-Verlag, LNCS, vol 3172, pp 25–36 Socha K, Blum C (2007) An ant colony optimization algorithm for continuous optimization: application to feedforward neural network training. Neural Comput and Appl 16:235–247 St¨utzle T, Hoos H (1997) The max–min ant system and local search for the traveling salesman problem. In: Proceedings of the 1997 IEEE International Conference on Evolutionary Computation, IEEE Press, pp 309–314 Sutton R (1986) Two problems with backpropagation and other steepest-descent learning procedures for networks. In: Proceedings of the 8th Annual Conference Cognitive Science Socitey, pp 823–831 Whitley D, Starkweather T, Bogart C (1990) Genetic algorithms and neural networks: optimizing connections and connectivity. Parallel Comput 14(3):347–361
12
Wolberg W (1990) Cancer diagnosis via linear programming. SIAM News 23:1–18 Wolberg WH, Mangasarian OL (1990) Multisurface method of pattern separation for medical diagnosis applied to breast cytology. Proc Natl Acad Sci 87(23):9193–9196 Yao X (1999) Evolving artificial neural networks. Proc IEEE 89(9):1423–1447 Yao X, Islam MM (2008) Evolving artificial neural network ensembles. IEEE Computl Intell Mag 3(1):31–42 Yao X, Liu Y (1996) Ensemble structure of evolutionary artificial neural networks. In: Proceedings of 1996 International Conference on Evolutionary Computation, pp 659– 664 Yao X, Liu Y (1998) Making use of population information in evolutionary artificial neural networks. IEEE Trans Syst, Man, Cybern-Part B: Cybern 28(3):417–425 Zhang G (2000) Neural networks for classification: a survey. IEEE Trans Syst, Man, Cybern-Part C: Appl Rev 30(4):451–462