wρ’
1
t 2
3
4
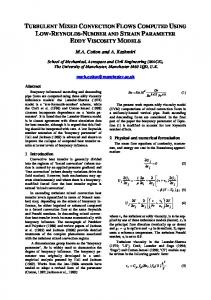
y x FIG. 5.ÈFour successive time samplings of six variables in a close-up horizontal planar view of the surface network in simulation R3, demonstrating a typical life cycle in the formation and destruction of a strong dynamically buoyant vortex at the junction of three downÑow lanes. Time advances down the Ðgure, with the samples spanning 2.35 time units [compared to q (z \ 0) D 3.44]. The variables shown are the vertical velocity, the vertical vorticity, and relative temperature, density, and pressure Ñuctuations (scaled by itheir horizontal mean values), and the rate of buoyancy work. The gray scale is such that positive values are light and negative values are dark, with w retaining its deÐned directionality (downÑow is light, in contrast to previous plots).
504
BRUMMELL, HURLBURT, & TOOMRE
roundings since it resulted from a downÑow, but the central core is warmed by Ñuid rising from below through the tube. The Ñow in the surrounding vortex sheath is still downward and is now marked by a region of negative buoyancy work since this downÑowing tube carries the relatively low density gas. The core exerts positive buoyancy work as the less dense gas is carried upward, although it is quickly Ñung outward by the rapid local rotation of the strong vertical vorticity. The action of the upÑowing core tends to destabilize the vortex since the surrounding sheath is pushed apart by the expansion of the upÑowing core (and its ultimate divergence at the surface). This mechanism o†ers one route by which the interstices are destroyed and new cells (as deÐned by a broad upÑow) are created. The destabilization of the junction vortices occurs through a compressible mechanism (dynamical buoyancy), suggesting that incompressible calculations may yield more stable examples of strongly spinning plumes. This mechanism is commonly witnessed in these simulations even when the rotational inÑuence is weak. Even without rotation, strong vorticity at lane junctions forms weakly evacuated vortices and some Ñow reversal but tends not to break up the structure. Greater local velocities would be required to initiate such e†ects when there is no background pool of vorticity to draw upon. The temporal dynamics of the laminarized surface cellular network are thus distinctly di†erent in the presence of rotation. There is a loss of temporal coherence of the network, a di†erent cellular topology, and enhanced cell creation (and network destruction) mechanisms. 3.3. V orticity Structure at Greater Depths Turbulence within incompressible simulations has been shown to involve intense vortex structures or ““ tubes ÏÏ (e.g., She, Jackson, & Orszag 1990 ; Vincent & Meneguzzi 1991). Compressible studies of homogeneous and convective turbulence with the nearly inviscid Piecewise Parabolic Method (PPM) (e.g., Pouquet, Porter, & Woodward 1994 ; Porter & Woodward 1996) also exhibit vortex tube formation. The convective turbulence in this study is no exception to this now common structural characterization. Figure 6 (see Plate 16) shows volume rendering of snapshots of enstrophy (magnitude of vorticity squared) for nonrotating (R0) and rotating (T2) turbulent simulations at comparable degrees of supercriticality. Here color and opacity values have been ascribed to each point according to the amplitude of the enstrophy. Brighter, more opaque patches are associated with strong vortex structures whereas dark, translucent regions are areas of weak or vanishing enstrophy. Di†erences between nonrotating and rotating turbulent convection may be noted in their vortex characteristics exhibited in Figure 6. With no rotation, the domain is populated sparsely by a few very straight and coherent large vertical vortex tubes or ““ chimneys.ÏÏ These are associated with the strong, vertically, and temporally coherent downÑows which are generated at the interstices of the surface network. These tubes penetrate a turbulent interior that is composed of many small-scale vortices. The latter are especially prevalent around the strong downÑowing structures, which suggests a generation of vorticity by instabilities of those coherent structures. However, for this nonrotating case, the small-scale vortex tubes are not very distinct and are preferentially vertically aligned, with few horizontally orientated structures in existence. The rotating case reveals
Vol. 473
a much busier and more random structuring in the enstrophy Ðeld. This is rather remarkable since the nonrotating solution actually has a higher degree of supercriticality and a higher measured R . With rotation, the enstrophy Ðeld ej coherent, large vortices penetrating again involves vertically much of the domain, co-existing with small-scale vortex tubes in the deeper interior. The number of large, coherent tubes has increased, reÑecting a reduction of the preferred wavelength with the increase in Taylor number (cf. Chandrasekhar 1961). Likewise, the width of such structures has also decreased. Most noticeably, the tubes in the interior have become more intense and thus more distinct in structure. Figure 7 (see Plate 17) shows details of the enstrophy structure extracted from a full domain of the rotating simulation T1. The increase in the number of large-scale coherent vortices and their inertial motions engendered by the rotation leads to strong interactions between the structures, which are evident in the close-up view in Figure 7a, which focuses in on a unit cube subsection in which a number of strong chimneys are interacting. These intense quasi-twodimensional vortices are mutually advected by each others Ñow Ðelds and by the inertial Ñows. The vortices may then interact in a manner resembling two-dimensional vortex dynamics. Since the vortices are all associated with strong downÑow sites and therefore with velocity convergence (enhanced by the stratiÐcation as the Ñuid descends), they must all spin cyclonically (i.e., in the same sense as the rotation) due to the action of Coriolis forces. Like-signed vortices can merge whereas oppositely signed vortices repel each other, and thus the coherent structures present here will preferentially combine. Coherent downÑow sites become a tangle of interwoven strong vortex tubes with subsequent increase in complexity of small-scale vorticity generation in the interior. Turbulent f-plane rotating Boussinesq convection with a vertical rotation vector exhibits similar vortex dynamics (Julien et al. 1996) in the absence of compressible e†ects. Figure 7b shows a view from above of the enstrophy Ðeld, encompassing the full horizontal extent but only the upper quarter of the domain in the vertical. The strong vortex chimneys at the interstices of the upper network are connected by twin vortex sheets or horizontally orientated vortex tube pairs. These vortex sheets or tubes (of opposite sense) are formed at the edges of the downÑow lanes within the upper thermal boundary layer. The tubes exhibit vortex stretching instabilities, the presence of which is accentuated when the Prandtl number P is r very small, as in PPM simulations (Porter & Woodward 1996). The vortex stretching leads to complex structures that are advected by the larger scale Ñows, which, along with the entwining of tubes in the interactions between imperfectly balanced large-scale tubes, leaves tubes at various orientations at greater depths shown in Figure 7c. Comparison of Figures 7b and 7c emphasizes that the appearance of the enstrophy Ðeld changes dramatically with depth. The small-scale vortex tubes ubiquitous in turbulence dominate the scene in the lower portion of the layer. The tubes are twisted, curved, and scattered with very little apparent preferential alignment, evidently existing with both horizontal and vertical orientation with equal likelihood. Contrast this with the strong vertical bias of the nonrotating case. The Coriolis terms in the momentum equation provide a linear mechanism for transferring momentum (and consequently vorticity) between the verti-
No. 1, 1996
TURBULENT COMPRESSIBLE CONVECTION WITH ROTATION. I.
505
cal and horizontal components and thus enhance mixing. In the absence of rotation, only nonlinear mechanisms can achieve this transfer. Some degree of large-scale intermittency is exhibited in this enstrophy Ðeld associated with the generation of these tubes from the more discrete sites at the upper boundary. Note that the chimneys at the upper surface and smaller scale vortex tubes near the lower surface are preferentially vertically aligned by the nature of the boundary conditions. Stress-free bounding surfaces allow only vorticity perpendicular to that surface, and hence tubes must emanate vertically from the horizontal boundaries. A rigid boundary condition (u \ 0 at z \ 0, 1) su†ers similarly by disallowing vertical vorticity in favor of horizontal vorticity. Only a ““ soft ÏÏ or penetrative boundary condition, where the layer is surrounded by otherwise stable Ñuid, would allow vortex tubes of all orientations at the interface. An unanswered question is whether the small-scale, intense turbulence in the interior is created as an instability of the large-scale Ñow, or whether it is driven directly by thermal instability at the lower boundary. If the latter mechanism were responsible, then the turbulence would result from plumes breaking o† from the lower boundary layer. With rotation, since these are converging Ñows, such plumes are spun up cyclonically. However, as these plumes leave the boundary layer and travel vertically they should expand by virtue of the stratiÐcation (although not dramatically since the scale height is large deep in the domain). An anticyclonic retardation would be applied to the cyclonic plumes by Coriolis forces acting on the expanding structures. The competition of these two mechanisms suggests that if the interior turbulence were to be created by plume formation at the lower boundary, then it would be suppressed somewhat in the rotational cases. Judging from the current simulations, the opposite appears to be true. The interior turbulence appears more intense in the rotating case, possibly due to the rotational spin-up of converging Ñuid elements in the background vorticity. This, along with the spatial intermittency of the turbulence, then seems to imply that instabilities of the strong, coherent downÑowing regions are the more likely culprits for generation of this internal turbulence, with the large-scale Ñow itself being driven thermally. Indeed, two-dimensional compressible
3.4. Mixing in the Interior The vortex interactions enhanced by e†ects of rotation create interesting consequences for the mixing properties of the convection. This can be seen in Figure 8a, which presents the mean entropy proÐles with depth for simulations with varying rotational inÑuence R at Ðxed but highly 0 supercritical R . All the convection solutions involve a entropy (and thermal) boundary layers at the top and bottom of the layer, with the upper ones much broader due to the greater thermal di†usivity (D1/o) there. Without the e†ects of rotation, the two boundary layers are joined by an isentropic interior since efficient convection serves to yield an adiabatic mean stratiÐcation, as seen for the R0 case in Figure 8a (and in Fig. 1 of Cattaneo et al. 1991). Surprisingly, as the rotational inÑuence is intensiÐed (cases R1ÈR4), the entropy proÐle in the interior increasingly departs from an adiabatic stratiÐcation. This e†ect was previously noticed by Julien et al. (1996) for the equivalent rotating Boussinesq dynamics. It appears that the horizontal mixing of thermodynamic properties is enhanced by the interaction of the coherent plume-like structures, leading to a decrease in correlation between temperature Ñuctuations and vertical velocities. The enthalpy transport, F \ e [c/(c [ 1)]owT @ (where T @ is the Ñuctuation of temperature away from its mean T1 ; an overbar denotes a horizontal average), is therefore reduced, retarding the vertical homogenization of entropy and requiring the mean thermal Ðeld T1 to carry a greater radiative Ñux, F \ c [c/(c [ 1)]L T1 , by r k Figure 8b demonz becoming superadiabatic in its gradient. strates this increasing role of the radiative Ñux F with r the respect to the enthalpy Ñux F number by exhibiting e decreasing ratio of these two quantities with decreasing Rossby number. Here the increasing T for Ðxed R and P a all solutions a implies a decrease in supercriticality, but arer sufficiently nonlinear that the interior would be well mixed (isentropic) but for the e†ects of rotation. The resultant entropy gradients seen in Figure 8a for decreasing R are 0 the intriguing since they imply that the convective Ñows in
FIG. 8a
FIG. 8b
simulations of localized buoyantly driven plumes (Rast 1996) show that such structures go shear unstable very quickly even in a quiescent background.
FIG. 8.È(a) Mean entropy proÐles with depth, obtained by horizontal and time averaging, within the four simulations R0, R1, R2, and R4 of increasing rotational inÑuence. All possess entropy boundary layers near the top and bottom, with the former more prominent since the thermal di†usivity is greater there. The interior is nearly adiabatically stratiÐed when rotation e†ects are weak but becomes superadiabatic with decreasing Rossby number R due to lateral mixing achieved by vortex interactions. (b) Associated proÐles of the ratio of the mean enthalpy Ñux F to radiative Ñux F within three 0of those e r simulations.
506
BRUMMELL, HURLBURT, & TOOMRE
interior can be buoyantly driven rather than adiabatically neutral. A further interesting issue arises. Does rotation introduce a degree of anisotropy to the motions (i.e., a preferred direction), or is mixing of momentum toward isotropy enhanced ? Curiously, both occur, with rotation enforcing an orientation on the large scales and yet tending to homogenize the smaller scales. To address the latter, two quantities discussed in Cattaneo et al. (1991) are useful, namely,
Vol. 473
These measures conÐrm the visual impression of a more random orientation of the small-scale enstrophy structures in Figure 6b. In rotating convection where a tilted rotation vector exists, the horizontal component of rotation provides a linear mechanism which can convert buoyancy-driven vertical momentum into horizontal momentum via the Coriolis terms. Without tilted rotation, this conversion can be achieved only by nonlinear mechanisms. The Coriolis forces thus tend to enhance mixing and the trend toward isotropy. Enstrophy spectrum functions clarify at which scales this trend occurs. These functions ) and ) (from Cattaneo et H V al. 1991) are related to the vorticity components by
(21a) r (z) \ w2/(u2 ] v2) , e (21b) r (z) \ (u2 ] u2)/u . x y z u The measure r describes the ratio of the kinetic energy e (neglecting density variations) in the vertical motions to that in the horizontal motions. Similarly, r is the ratio of u vorticity to the enstrophy associated with the horizontal that associated with the vertical component. If the Ñow were completely isotropic, then r and r would assume equie respectively. u partition values of 0.5 and 2.0, Figure 9 shows the dependence of r and r with depth (averaged over time) e u for four di†erent simulations (R0ÈR4) with varying R . 0 Increasing the inÑuence of the rotation reduces the peak kinetic energy ratio r in the interior and boosts r near the e toward that of equipartition e (dotted boundaries (in general) lines in Fig. 9). The rotationally inÑuenced Ñows also possess enstrophy ratios r which are distributed more u value. closely around the equipartition
and exhibit the relative power residing in the vertical and horizontal components of enstrophy by wavenumber. Cattaneo et al. (1991) showed that nonrotating turbulent convection tended toward isotropy on the small scales, at least for the highest degrees of turbulence they could attain (Re D 20 ; see their Fig. 10). Figure 10 here presents the j functions evaluated at midlayer and time-averaged for same R0, the (higher resolution) equivalent of case 3 of Cattaneo et al. (1991), and for the moderately rotationally inÑuenced case T1. Despite the lower supercriticality of T1 (by virtue
FIG. 9.È(a) Variation with depth of the ratio r of the kinetic energy in e vertical motions to that in horizontal motions, horizontally and time averaged for the four simulations R0, R1, R2, and R4. (b) Companion ratio r u of the horizontal enstrophy to that in the vertical. With increasing rotational inÑuence both ratios tend toward their isotropic values (dotted lines) of 0.5 and 2.0, respectively, in the interior of the layer.
FIG. 10.ÈVariation with wavenumber of the enstrophy spectrum functions ) and ) , measuring relative power in the horizontal and vertical H V components of enstrophy. Time-averaged spectra as evaluated at midlayer in (a) the nonrotating simulation R0 and (b) the moderately rotationally inÑuenced simulation T1. The wavenumbers are normalized by the maximum resolved (i.e., dealiased) wavenumber. The overlapping curves at moderate to high wavenumbers in b indicates the isotropy at those scales, enhanced by the e†ects of rotation.
(u2 ] u2)(z) \ x y u2(z) \ z
P P
2) (k, z)dk , H
(22a)
) (k, z)dk , V
(22b)
No. 1, 1996
TURBULENT COMPRESSIBLE CONVECTION WITH ROTATION. I.
of the stabilizing rotation), the two curves ) and ) for T1 H V lie together for more than half the resolved wavenumbers whereas the R0 curves coincide only at the smallest scales. This indicates that, although the largest scales must still be dominated by the convective forcing, the e†ects of rotation enhance the isotropy on a wide range of scales from medium to small. Despite the increased presence of anisotropic coherent structures in tilted rotating convection, average measures such as these indicate that Coriolis forces mix the smaller scale components of momentum in the Ñow efficiently. 3.5. Rotational Alignment of Coherent Structures Although e†ects of rotation due to vortex interactions tend to isotropize the interior turbulence on the smaller scales, the presence of rotation can simultaneously introduce anisotropy on the larger scales of motion, since coherent Ñuid trajectories may prefer a direction other than that dictated solely by buoyancy. If Coriolis forces are sufficiently strong and the rotation vector is not aligned with gravity, then buoyancy-driven Ñuid motions may be deÑected during their vertical transit. The current simulations exhibit a distinct di†erence in the perturbation of Ñuid trajectories by Coriolis forces depending on whether the motions are laminar or turbulent. Laminar Ñows operate in cellular structures whose boundaries can tilt away from the vertical under the rotational inÑuence. The smooth velocity trajectories within the cellular Ñow may also be perturbed by both components of the rotation. The strong e†ect of ) on y the vertical motions often dominates to leave streamlines which in general are not parallel to the rotation vector. Turbulent Ñows no longer exhibit smooth streamlines and distinct cellular boundaries but rather consist of small-scale motions punctuated by coherent structures. The e†ect of a rotational inÑuence is then to align the large-scale vortical structures with the rotation vector. Laminar and turbulent Ñows thus exhibit streamline ““ tilting ÏÏ or vortex structure ““ alignment,ÏÏ respectively. Any consistent perturbation of trajectories in the Ñow is of interest since a correlation between horizontal and vertical motions is thus generated. Such correlations provide Reynolds stresses, which are the only source terms for the generation of mean horizontal shear Ñows, and may also signiÐcantly a†ect the vertical heat Ñux since they reÑect less direct communication between the horizontal boundaries. The presence of mean Ñows and the rotational inÑuence on energy transport in the current context are discussed in subsequent papers in this series. In this paper, the structure of the convective Ñows that leads to such e†ects is addressed. A clear expose of the tilting of laminar Ñuid trajectories appears in linear stability calculations of f-plane Boussinesq convection by Hathaway, Gilman, & Toomre (1979) and Hathaway, Toomre, & Gilman (1980). Similar treatments of compressible convection are more complex since the onset is unsteady (Jones, Roberts, & Galloway 1990). The Boussinesq paper showed that, even in the absence of a thermal wind, the cellular boundaries of zonal (i.e., aligned along x) rolls tilt poleward, and upward (downward) motions veer to the west (east). In this linear stability analysis, the equivalent tilting of meridional rolls (aligned along y, the preferred mode at onset) in the zonal direction is suppressed by the pressure gradient in that direction. In later threedimensional fully nonlinear but still laminar numerical simulations of the same type of rotating convection
507
(Hathaway & Somerville 1983), it was observed that the smooth Ñow trajectories and cellular structural boundaries could be signiÐcantly tilted both zonally and meridionally when mixed modes (zonal and meridional rolls) exist. This can be demonstrated by measuring a normalized global degree of correlation between velocity components u , u , 1 2 u (\u, v, w), 3 Su u T i j , (23) SR T \ i,j t (Su2TSu2T)1@2 t i j where unsubscripted angle brackets indicate an rms average over all space, and a t subscript indicates that this quantity is also time-averaged over many turnover times. Hathaway & Somerville (1983) reported a signiÐcant correlation (R \ [0.3) between upward and westward moving ele1,3 ments (uw correlations) for a case corresponding to R \ 1 0 at / \ 15¡ in their Boussinesq calculations. This correlation manifested itself as an obvious drift of the particle trajectories toward the west as they move upward and toward the east as they move downward. A correlation existed between upward and southward motions (vw correlation) as well but was a factor of 2 smaller (R \ [0.13). In that case, the 2,3 of meridional rolls but the cellular Ñow is composed mainly small zonal component tilts weakly poleward and generates particle paths which are strongly slanted in the zonal direction. A lower Rossby number solution exhibited much less correlation in both R and R since the conservation of 2,3signiÐcant pressure e†ects angular momentum is1,3 lost due to (Cowling 1951) in the now completely dominant meridional rolls. Measures of the velocity correlations (23) for the cases under study here are included in Table 2. The laminar solutions L1ÈL3 exhibit lower values of the correlation than those from Hathaway & Somerville (1983), probably due to the larger R (\2.29) and the lower P . However, as before 0 r the uw correlations are signiÐcantly larger than vw except when meridional rolls are prevalent (L3). Of greater importance, for turbulent solutions such as cases R3ÈR6 the velocity correlations are all reduced by at least a factor of 2. For moderately rotating turbulent cases (R1, R2, T1, T2), u correlates with w signiÐcantly better than v does. For a stronger rotational inÑuence (such as simulations R4ÈR6), the values are either comparable or the uw correlations are smaller than those of vw, with the latter more dominant with increasing latitude. The general trends are toward a decorrelation of the Ñows with increasing turbulence as may be expected, with a decrease in the role of zonal-vertical (uw) correlations (and subsequent increase in the importance of meridional-vertical vw correlations) both with increasing rotational inÑuence and with latitude. Figure 11 elucidates the reason for these changes in correlation in a typical turbulent case. It shows a volume rendering of a snapshot of enstrophy for case R4 which has strong rotational inÑuence (R \ 0.71) with the rotation vector lying at 45¡ to the hori0 zontal in the y [ z plane. The only obvious correlation is a clear alignment of strong enstrophy structures along this direction. Laminar tilting of cellular boundaries and smooth streamlines has been replaced by rotational alignment of the coherent vortex structures in the Ñow. This di†erence between the rotational inÑuence on laminar and turbulent convective motions is clariÐed in the sketches of Figure 12. For laminar cases, where streamlines are smooth and the Ñow is cellular, tilting of cellular struc-
T
U
508
BRUMMELL, HURLBURT, & TOOMRE
Vol. 473
TABLE 2 TIME-AVERAGED GLOBAL VELOCITY CORRELATIONS R Case
T
U T
SuwT [Su2TSw2T]1@2
t
i, j
AND VORTICITY ALIGNMENT
U T
SvwT [Sv2TSw2T]1@2
t
U T U
SuvT [Su2TSv2T]1@2
t
uÆX ouo
L1 . . . . . . L2 . . . . . . L3 . . . . . .
0.160 0.026 0.040
0.052 0.008 0.116
[0.112 0.041 [0.140
0.592 0.611 0.635
R0 . . . . . . R1 . . . . . . R2 . . . . . . R3 . . . . . .
0.006 0.045 0.105 0.083
0.015 0.031 0.040 [0.048
0.209 0.080 [0.013 [0.069
[ 0.575 0.586 0.590
R4 . . . . . . R5 . . . . . . R6 . . . . . .
[0.032 [0.111 0.004
[0.041 0.097 [0.061
[0.041 [0.092 0.012
0.636 0.668 0.645
T1 . . . . . . T2 . . . . . .
0.105 0.131
[0.029 0.011
[0.081 [0.075
0.583 0.583
tures and Ñuid trajectories is forced by the action of the horizontal component of the rotation vector, ) , on the space-Ðlling, coherent vertical velocity Ðeld. yLaminar motions which are not purely meridional rolls will have cellular boundaries tilted poleward with the rotation vector. However, an upward (downward) motion under the inÑuence of ) will be turned westward (eastward) providing a y between u and w. The Ñuid parcel paths are thus correlation not parallel to the rotation vector. We term this e†ect laminar tilting of velocity trajectories and cellular structures. The vertical component of rotation, ) , cannot a†ect vertical motions and serves only to transferz energy between the horizontal components of momentum, altering the horizontal particle trajectories somewhat within the cellular structure but not the geometry of the cell itself (Veronis 1959 ; Chandrasekhar 1961). On the other hand, when the solution is turbulent the small-scale isotropic motions of the interior turn over too quickly to sense the Coriolis force. The rotation acts solely on the structures within the Ñow
t
which have a signiÐcant coherence, aligning them in the direction of the rotation vector. We label this as turbulent structural alignment. Such alignment provides correlations between vertical and meridional motions since motions are parallel to the rotation vector on average along trajectories within the structure. Laminar and turbulent convective Ñows thus engender di†erent correlations : laminar motions provide stronger uw correlations from the zonal tilting of trajectories, whereas turbulence creates vw coupling via particle paths within rotationally aligned structures. Figure 13 isolates one typical tilted coherent structure in a turbulent Ñow. This Ðgure shows particle streamlines where particles are advected by one snapshot of the velocity Ðeld as though it were a steady Ñow. The actual particle trajectories followed in time (streaklines) are somewhat more complicated due to inertial oscillations of the largescale Ñows but are similar. A section 4 : 4 : 1 is extracted from the 4 : 4 : 1 domain of the Ñow shown3in3Figure 11 that contains a coherent structure in enstrophy. Particle paths in the
FIG. 11.ÈVolume rendering of enstrophy as viewed at one instant in time from the side of the layer in simulation R4. In such a strongly rotationally inÑuenced case (with R \ 0.71), coherent vortex structures align with the rotation vector X over much of the layer. 0
No. 1, 1996
TURBULENT COMPRESSIBLE CONVECTION WITH ROTATION. I.
FIG. 12a
509
FIG. 12b
FIG. 12.ÈSketches of the rotational inÑuence on laminar and turbulent convective Ñuid trajectories. (a) In laminar cases, the horizontal component ) of y w the rotation vector acting on the dominant buoyancy-driven vertical motions leads to tilting of the trajectories, yielding correlations between the u and components of motion. These could serve to drive zonal mean Ñows. (b) In turbulent cases, coherent chimneys of strong vortical downÑow become aligned with the tilted rotation vector, whereas the smaller scale motions are little inÑuenced by Coriolis forces. The aligned structures possess correlations between the v and w components of motion which are sources for meridional mean Ñows.
structure clearly spiral parallel to the rotation axis. Such complexity here may be contrasted with the simple linear streamlines of the laminar Boussinesq Ñows in Hathaway & Somerville (1983). Laminar trajectories are not parallel to the rotation vector (although cell boundaries may be, for example in pure zonal rolls), whereas particle paths within structures in a turbulent Ñow are aligned with ) (when averaged over the trajectory to remove the spiraling oscillations). The new turbulent alignment of coherent structures appears to arise more as a natural consequence of the presence of a rotational direction among isotropic turbulent motions than as an action or instability of pre-existing vortex tubes in a rotating Ñow. Further work to clarify this is in progress (Brummell, Julien, & Rast 1996b). Figure 14 outlines a mechanism for the rotational alignment of Ñuid
parcels. The Ñow in general is driven by low entropy Ñuid leaving the upper boundary due to the e†ects of buoyancy. If the rotation vector is not aligned with gravity, then a vertical motion may be considered as the superposition of two orthogonal motions, one parallel to X and one perpendicular, say w and w , respectively. The former will experiA M due to Coriolis forces, whereas the ence no acceleration latter will feel a force which will tend to move a particle in an inertial circle in the plane perpendicular to the rotation vector. If R \ 1 then more than one inertial oscillation can 0 during the vertical transit and the sum of be performed these two motions would be a spiral parallel to X. Since this mechanism works on particle or parcel trajectories, the question is then to determine what distinguishes laminar Ñows from turbulent Ñows such that this mechanism is more obvious in the latter than the former. The answer to this is explored in detail in Brummell, Julien, &
z=0
Ω
z
z=1 x y
FIG. 13.ÈThe helical winding of Ñuid trajectories is evident in a closeup view of a typical strong downÑowing plume in a strongly rotating simulation R4. Shown are particle streamlines determined by advecting tracers with one snapshot of the velocity Ðeld as if it were a steady Ñow. The view encompasses the full depth of the layer, but only one-third of the extent in each of the horizontal directions.
FIG. 14.ÈSketch of the elements that contribute to the rotational alignment of turbulent convective motions with the rotation vector X. A buoyancy-driven vertical motion can be considered as the superposition of a component w parallel to the rotation vector and another w perpenA former experiences no Coriolis forces, whereasMthe latter dicular to it. The is forced to move in inertial circles, the composite of which is a spiraling Ñow parallel to the rotation vector.
510
BRUMMELL, HURLBURT, & TOOMRE
Rast (1996) and is explained only brieÑy here. Consider solely the e†ect of Coriolis forces in the momentum equations (3b), L ou D ov) [ ow) , (24a) t z y L ov D [ou) , (24b) t z L ow D ou) . (24c) t y These equations represent inertial oscillations about each of the rotation vector components, which transfer momentum between ou and ow via ) and between ou and ov through y ) . If ) and ) are of the same order of magnitude, then z y z the balance of these terms depends upon the magnitude of the momentum components themselves. If the vertical component ow is originally the dominant entity, then the Coriolis force produces ou via the horizontal component of the rotation, ) . The zonal momentum produced feeds back y momentum via the inertial oscillation and into the vertical only produces meridional momentum ov at this secondary stage. If pressure e†ects are not signiÐcant, the transfer between u and w will probably be the strongest, corresponding to zonal tilting. On the other hand, if the horizontal components of momentum are initially of the same order of magnitude as the vertical component, then there is strong interaction with both components of the rotation vector leading to dual inertial oscillations. This creates an oscillation in the plane perpendicular to X, equivalent to an alignment of vorticity in that direction. Laminar Ñows are driven vertically by buoyancy and dominantly producing horizontal vorticity, with little transfer to vertical vorticity since the nonlinear advection terms are weak. In turbulent Ñows, however, there is a strong nonlinear production of vertical vorticity from the buoyant horizontal vorticity leading to an equipartition in strength between all three components of momentum. Thus the vertically dominated motions of laminar convection will most likely engender tilting of the smooth trajectories, whereas turbulent Ñows will tend to produce aligned vortical Ñuid from motions that have coherence on the order of the rotation time. If the components of the rotation vector are not of the same order of magnitude, as is the case for a tilted rotation vector near the pole or the equator, then one of the two mechanisms becomes enhanced. Near the pole, ) becomes y unimportant, inertial oscillations about ) dominate, and z turbulent alignment and buoyancy act together. Near the equator, the turbulent alignment is in competition with buoyancy and ) is dominant, so that tilting of coherent y Ñows may be more likely. Since turbulent motions still possess large-scale overturnings with the small-scale turbulent motions superimposed, the resulting correlations for turbulent solutions stem from a balance of the two mechanisms. 3.6. Measures of T urbulent Structural Alignment Inertial helical oscillations interfere with any instantaneous measurement or visualization of the velocity correlations. Only averaging over a full Ñuid trajectory will reveal the underlying correlation. This suggests that for turbulent alignment the velocity correlations may not be the optimal quantities to examine. Since the enstrophy data reveals such alignment more clearly, an attempt to quantify the correlation in terms of vorticity might be more fruitful. A measure of the degree of vorticity alignment with the unit
Vol. 473
rotation vector XŒ is deÐned as u Æ XŒ . u \ ) ouo
(25)
If the vorticity at a point is aligned along the rotational axis, then this quantity yields unity if the vorticity is cyclonic (and [1 if it is aligned but anticyclonic). If the vorticity is normal to the rotational vector at a point, then the value of u there is zero. Note that a random vector Ðeld will regis) ter an average value of 1 1/3 \ ^ 0.577 , Su T \ ) [(1/3)2 ] (1/3)2 ] (1/3)2]1@2 J3
(26)
since all directions are equally likely. Table 2 includes a listing of the rms spatial average of this quantity also averaged over many turnover times in each simulation, Su T . ) t Although there is a trend toward more alignment with increasing inÑuence of rotation, the variations from the value for a randomly orientated vector Ðeld are remarkably small. For cases R1ÈR4 where R is decreasing, the value of 0 Su T increases from 0.575 to 0.636. Cases that are highly ) t turbulent but moderately rotationally inÑuenced, such as T1, remain marginally above the random value. Less turbulent cases with moderate rotation can have a reasonably high value of vorticity alignment, especially where the latitude is low, as in case L3. This reÑects an alignment of laminar rolls along the dominant component of the rotation, ) . y the strong visual alignment for cases such as R4 Despite (Fig. 11), Su T is still close to the random value, varying by ) tso. This reÑects the weak inÑuence of the only 10% or rotation for turbulent cases. Overall, the Ñow becomes largely decorrelated with only small regions of high correlation whose Ðlling factor are not signiÐcant enough to inÑuence a global measure signiÐcantly. Despite the small degree of alignment indicated in such measures, they at least appear to exhibit the expected direction. Figure 15a presents a plot of u (/ ) (rms-averaged over space) which is a ) i of alignment with an arbitrary unit measure of the degree vector deÐned in the plane y [ z pointed at angle / . The i 90¡ Ðgure shows this measure for various / between 0¡ and i for two cases, one with strong rotation (R4) and the other with moderate (T1), both positioned at latitude / \ 45¡ on the sphere. If the Ñow were to be aligned with the true rotation vector, then this measure should peak at the latitudinal inclination of that actual rotation vector, shown as the dotted line. A typical time from the less rotationally constrained case T1 can be seen to have a peak alignment with a horizontal unit vector (/ \ 0¡). This indicates little i the directionality being alignment with the rotation, with mainly inÑuenced by the horizontally orientated vorticity generated by the convective overturning. On the other hand, a typical snapshot from the strongly rotationally constrained case R4 shows a peak alignment with a direction slightly more vertical than the actual rotation vector. This is an indication of considerable rotational alignment, with the error being forced by two mechanisms. First, convective overturning tends to align structures vertically by the action of buoyancy parallel to gravity. Second, the boundary conditions inÑuence the Ñows. Since the boundaries are stress free, only vertical vorticity can exist there, and thus vortex structures are forced to be aligned vertically near the
No. 1, 1996
TURBULENT COMPRESSIBLE CONVECTION WITH ROTATION. I.
511
depth and then stacked, for the two cases previously considered. At any depth, a peak in the histogram at any value of u indicates that a large number of points are aligned to ) that degree. For example, in both cases, the histograms at the boundaries show a strong peak at u \ sin (n/4). This ) corresponds once again to the forced vertical alignment mismatch with the 45¡ rotation vector. However, away from the boundaries, the histograms in Figure 15c for case T1 show a Ñat proÐle indicating that there are as many points aligned in one direction as in any other. Figure 15d for the strong rotation case R4, however, reveals that away from the boundaries the histogram peaks at the value of u \ 1. ) at More points are indeed aligned with the rotational vector each depth than any other direction. However, this is not a sharp peak, and thus there are still a large number of points aligned in other directions which will mask any average statistics. To calculate the Ðlling factor of aligned structures explicitly, the fraction of the area at any depth that is covered by points with greater than a certain degree of alignment may be measured by the quantity
FIG. 15.ÈAverage and pointwise measures of vorticity alignment within the strongly rotationally constrained case R4 and the moderately constrained case T1. (a) A measure u (/ ) of the alignment of vorticity ) the i angle / in the y[z plane, along an arbitrary direction speciÐed by i full domain at a shown as / is varied. Values are rms averaged over the typical time.i Panel (b) shows u , the alignment of vorticity with the actual )xy horizontal planes, plotted against depth rotation vector u averaged over ) for one typical snapshot in time. Panels (c) and (d) show histograms of the pointwise measure u at each depth, averaged over many turnover times in simulations T1 and)R4, respectively.
boundaries, an inÑuence which will show up in the global measure Su T. ) the alignment more clearly, the remaining To isolate panels of Figure 15 exhibit plane-average and pointwise statistics. Figure 15b shows the breakdown of the global rms measure Su T into rms values calculated at each depth, u \ Su T ) (z), for the same two typical cases from R4 )xyT1. The ) higher xy,rms R case T1 shows the measure to hover and 0 value (0.577, shown as the dashed around the equipartition line) for the majority of the interior, with a jump to the value representing vertical alignment at the boundaries (equal to sin /, shown as the dotted line). The lower R case 0 but R4 is also forced to have the same boundary values shows a considerably higher degree of alignment throughout the box at each depth, with the measure only dropping toward the equipartition value near the lower boundary. However, this horizontally averaged measure never exhibits a stronger alignment anywhere in the Ñow than that at the boundaries where structures are forced to be completely misaligned. This is again a reÑection of the small Ðlling factor of the aligned structures in a sizable average, a problem which can only be resolved by examining pointwise measures. Figures 15cÈ15d show (time-averaged) histograms of the earlier measure u evaluated over horizontal planes at each )
N p(u0) \ ; , (27) ) N tot where N is the number of points with u [ u0 and N is ) plane. ) Fortotthe the total;number of points in any horizontal higher R case, T1, p(0.9) attains a maximum value of 0.11 at depth 0z \ 0.59 (although this fraction is relatively constant throughout the interior). For the lower R case R4 this 0 throughmaximum value is 0.2 at z \ 0.12 (and decreases out the interior). This implies that the most strongly aligned Fluid (top 10%) is contained in 11% of the area in case T1 and in 20% in case R4. The value of z \ 0.12 for R4 corresponds roughly to the edge of the thermal boundary layer. This depth may be that at which the vertically aligning inÑuence of the boundary is no longer felt, and yet the coherence of the strong downÑowing structures is still evident so that the rotation may act easily on such tubes. Once in the interior, although such structures remain somewhat coherent across the entire layer depth, they are eroded by the shear and bu†eted by the turbulent motions, so that their alignment is diminished. The Ðlling factor for these structures, however, is always small even when strong rotation is present. However, these changes in the nature of the turbulent rotating solutions have profound consequences for the mean Ñows that coexist with the convection, as shall be seen in Paper II. Although it is quite difficult to quantify the properties of such multiscale rotating turbulence, the general impressions are quite clear. The convection involves small-scale turbulent motions that are isotropic, decorrelated, and inÑuenced only indirectly by rotation. Punctuating and coexisting with these motions are distinctly anisotropic, extended (but volumetrically small) structures of considerable coherence that sense and align with strong rotation signiÐcantly. 4.
CONCLUSIONS
Compressible convection in a simple rectilinear domain inÑuenced by a constant magnitude rotation has been studied. The angle between the rotation vector and gravity is not necessarily zero mimicking the placement of the domain at various latitudes on a sphere. The thermal forcing extends to regimes where motions are turbulent.
512
BRUMMELL, HURLBURT, & TOOMRE
This paper addresses the changes in structure and evolution of the convective Ñow associated with the variation of the rotational inÑuence, as measured by the convective Rossby number R . 0 The underlying structure of the turbulent rotating convection remains similar to that of nonrotating simulations (e.g., Cattaneo et al. 1991). The Ñows are divided into an upper thermal boundary layer consisting of a laminar, cellular network, atop a fully turbulent interior punctuated by vertically coherent structures emanating from the upper surface. However, the inclusion of rotation changes the characteristics of both the surface network and the turbulent interior. The surface network becomes more curvaceous, less connected, and more time dependent under the rotational inÑuence. The overall mobility of the cellular pattern is due to inertial motions of the surface Ñows induced by the Coriolis forces. Rotational enhancement of a dynamical buoyancy mechanism operating at the junctions of the network leads to self-destruction of these interstices and thus a new method of cell creation. The turbulent interior of the Ñow is also subtly altered in nature. The components of the rotation vector provide a linear mechanism for transferring momentum between vertical and horizontal motions. In contrast, for nonrotating convection, the only method of exchange is through the nonlinear advective terms of the equations. Hence it is not surprising that with rotation the isotropy of energy and enstrophy is enhanced. This manifests itself as the concentration of vorticity into more distinct tube-like structures with a very random orientation in the interior of the Ñow. The interactions of vortex tubes on various scales provide a horizontal mixing mechanism for the thermodynamic properties. Vertical velocity and thermal Ñuctuations become less correlated in the interactions, retarding the efficiency of the vertical convective transport and consequently leaving a superadiabatic mean stratiÐcation in the interior. Motions in the turbulence may now be thermally driven at any depth, not just in the thermal boundary layers. While increasing the mixing of momentum toward isotropy on the small scales of motion in the turbulent cases, strong rotation can also induce an anisotropy on the large scales by introducing a preferred direction. The coherent structures of the turbulent Ñows have a tendency to align with the rotation vector under the action of the Coriolis force. This mechanism is distinctly di†erent from that found in laminar Ñows, where the Ñuid trajectories of the largescale overturning are subject to a zonal tilting provided by
Vol. 473
the horizontal component of the rotation. The enhanced role of ) in the laminar Ñows results from the dominance y of buoyancy-driven horizontal vorticity over vertical. Turbulent cases have sufficient nonlinearity to equipartition energy between all of the three directions, and thus the motions sense all components of rotation. When all components of momentum are equally strong, the natural form of motion is helical and parallel to the rotation. These laminar and turbulent mechanisms provide disparate velocity correlations. The former provides a coupling between zonal and vertical motions, whereas turbulent convection generally becomes decorrelated but with a bias toward the coupling of meridional Ñows with vertical motions in the coherent structures. For turbulent rotating convection, the global degree of correlation is reduced compared to the laminar cases (a signature of the turbulence) and is difficult to measure because of the low Ðlling factor and time dependence of the coherent structures. However, much attention has been paid here to these laminar tilting and turbulent alignment mechanisms within the Ñows examined because they can lead to the generation of speciÐc Reynolds stresses in the Ñow, which in turn are sources for large-scale (mean) Ñows. Indeed, in these simulations, such horizontally averaged Ñows are stable and signiÐcant and exhibit many interesting properties which may provide insight into the nature of the di†erential rotation of stars like the Sun. The mechanism for such inverse cascades to large-scale mean shearing Ñows is the subject of Paper II. The authors acknowledge helpful discussions with Gary Glatzmaier, John Hart, Keith Julien, Mark Rast, and Joseph Werne. We also thank Fausto Cattaneo for his part in originating the numerical code and for many useful conversations. Computations were carried out on the Cray C-90 at the Pittsburgh Supercomputing Center (PSC) under grant MCA93S005P, and on the Kendall Square Research KSR-1 at the University of Colorado. We thank Paul Puglielli and Raghurama Reddy at PSC, and Clive Baillie and Xin Xie for help in porting the code to the KSR. This work was partially supported by the National Science Foundation through grant ESC-9217394, and by the National Aeronautics and Space Administration through grants NAG 5-2218, NAG 5-2256, NAS 8-39747 and NAS 5-30386 and through Lockheed Independent Research Funds.
REFERENCES Arendt, S. 1993, ApJ, 412, 664 Baker, L., & Spiegel, E. A. 1975, J. Atmos. Sci., 32, 1909 Bogdan, T. J., Cattaneo, F., & Malagoli, A. 1994, ApJ, 407, 316 Brandenburg, A., Jennings, R. L., Nordlund, A., Rieutord, R., Stein, R. F., & Tuominen I. 1995, J. Fluid Mech., submitted Brown, T. M., Christensen-Dalsgaard, J., Dziembowski, W. A., Goode, P. R., Gough, D. O., & Morrow, C. A. 1989, ApJ, 242, 526 Brown, T. M., & Morrow, C. A. 1987, ApJ, 314, L21 Brummell, N. H., Cattaneo, F., Malagoli, A., Toomre, J., & Hurlburt, N. E. 1991, in Lecture Notes in Physics, 88, Challenges to Theories of the Structure of Moderate-Mass Stars, ed. D. O. Gough & J. Toomre (Berlin : Springer), 189 Brummell, N. H., Cattaneo, F., & Toomre, J. 1995, Science, 269, 1313 Brummell, N. H., Hurlburt, N. E., & Toomre, J. 1996, in preparation (Paper II) Brummell, N. H., Julien, K. A., & Rast, M. P. 1996, in preparation Busse, F. H. 1970, ApJ, 159, 629 Busse F. H., & Cuong P. G. 1977, Geophys. Astrophys. Fluid Dyn., 8, 17 Canuto, C., Hussaini, M. Y., Quarteroni, A., & Zang, T. A. 1988, Spectral Methods in Fluid Dynamics (New York : Springer)
Castaing, B., et al. 1989, J. Fluid Mech., 204, 1 Cattaneo, F., Brummell, N. H., Toomre, J., Malagoli, A., & Hurlburt, N. E. 1991, ApJ 370, 282 Cattaneo, F., Hurlburt, N. E., & Toomre, J. 1989, in Stellar and Solar Granulation, ed. R. J. Rutten & G. Severino (Dordrecht : Kluwer), 415 ÈÈÈ. 1990, ApJ, 349, L63 Chan, K. L., & SoÐa, S. 1986, ApJ, 307, 222 ÈÈÈ. 1987, Science, 235, 465 Chandrasekhar, S. 1961, Hydrodnamic and Hydromagnetic Stability (Oxford : Clarendon) Cowling, T. G. 1951 ApJ, 114, 272. DeLuca, E. E., Werne, J., Rosner, R., & Cattaneo, F. 1990, Phys. Rev. Lett., 64, 2370 Durney, B. R. 1987, in The Internal Solar Angular Velocity, ed. B. R. Durney & S. SoÐa (Dordrecht : Reidel), 235 Edwards, J. M. 1990, MNRAS, 242, 224 Gilman P. A. 1975, J. Atmos. Sci., 32, 1331 ÈÈÈ. 1977, Geophys. Astrophys. Fluid Dyn., 8, 93 Gilman, P. A., & Glatzmaier, G. A. 1981, ApJS, 45, 351 Gilman, P. A., & Miller, J. 1986, ApJS, 61, 585
No. 1, 1996
TURBULENT COMPRESSIBLE CONVECTION WITH ROTATION. I.
Glatzmaier, G. A. 1984, J. Comput. Phys., 55, 461 ÈÈÈ. 1985, ApJ, 291, 300 ÈÈÈ. 1987, in The Internal Solar Angular Velocity, ed. B. R. Durney & S. SoÐa (Dordrecht : Reidel), 263 Glatzmaier, G. A., & Gilman, P. A. 1981, ApJS, 45, 335 Glatzmaier, G. A., & Toomre, J. 1995, in ASP Conf. Ser., Vol. 76, GONG Ï94 : Helio- and Astero-Seismology from the Earth and Space, ed. R. K. Ulrich, E. J. Rhodes, Jr., & W. Dappen (San Francisco : ASP), 200 Gough, D. O., Moore, D. R., Spiegel, E. A., & Weiss, N. O. 1976, ApJ, 206, 536 Gough D. O., & Toomre J. 1991, ARA&A, 29, 627 Gough, D. O., & Weiss, N. O. 1976, MNRAS, 176, 589 Graham, E. 1975, J. Fluid Mech., 70, 689 ÈÈÈ. 1977, in IAU Colloq. 38, Problems of Stellar Convection, ed. E. A. Spiegel & J.-P. Zahn (Berlin : Springer), 151 Harvey, J., & The GONG Instrument Team. 1995, in ASP Conf. Ser.,Vol. 76, GONG Ï94 : Helio- and Astero-Seismology from the Earth and Space, ed. R. K. Ulrich, E. J. Rhodes, Jr., & W. Dappen (San Francisco : ASP), 432 Hathaway, D. H. 1984, ApJ, 276, 316 Hathaway, D. H., Gilman P. A., & Toomre J. 1979, Geophys. Astrophys. Fluid Dyn., 13, 289. Hathaway, D. H., & Somerville, R. C. J. 1983, J. Fluid Mech., 126, 75 ÈÈÈ. 1986, J. Fluid Mech., 164, 91 ÈÈÈ. 1987, Geophys. Astrophys. Fluid Dyn., 38, 43 Hathaway, D. H., Toomre, J., & Gilman P. A. 1980, Geophys. Astrophys. Fluid Dyn., 15, 7 Heslot, F., Castaing, B., & Libchaber, A. 1987, Phys. Rev. A, 36, 5870 Hossain, M., & Mullan, D. J. 1990, ApJ, 354, L33 Hurlburt, N. E., Brummell, N. H., & Toomre, J. 1995, in Proc. 4th SOHO Workshop Helioseismology, ed. J. T. Hoeksema et al. (Noorwijk : ESA), ESA SP-376, 2, 245 Hurlburt, N. E., Toomre, J., & Massaguer, J. M. 1984, ApJ, 282, 557 Hurlburt, N. E., Toomre, J., & Massaguer, J. M. 1986, ApJ, 311, 563 Hurlburt, N. E., Toomre, J., Massaguer, J. M., & Zahn, J.-P. 1994, ApJ, 421, 245 Jones, C. A., Roberts, P. H., & Galloway, D. J. 1990, Geophys. Astrophys. Fluid Dyn., 53, 145 Julien, K., Legg, S., McWilliams, J., & Werne, J. 1996, J. Fluid Mech., 322, 243 Korzennik, S. G., Rhodes, E. J., Jr., Johnson, N. M., Rose, P., & Cacciani, A. 1995, in ASP Conf. Ser., 76, GONG Ï94 : Helio- and AsteroSeismology from the Earth and Space, ed. R. K. Ulrich, E. J. Rhodes, Jr., & W. Dappen (San Francisco : ASP), 12 Latour, J., Toomre, J., & Zahn, J.-P. 1981, ApJ, 248, 1081 Libbrecht, K. G. 1989, ApJ, 336, 1092 Malagoli, A., Cattaneo, F., & Brummell, N. H. 1990, ApJ, 361, L33 Massaguer, J. M., Latour, J., Toomre, J., & Zahn, J.-P. 1984, A&A, 140, 1 Nordlund, A . 1982, A&A, 107, 1 ÈÈÈ. 1983, in IAU Symp., 102, Solar and Stellar Magnetic Fields : Origins and Coronal E†ects, ed. J. O. StenÑo (Dordrecht : Reidel), 79 Nordlund, A . 1984, in The Hydromagnetics of the Sun, ed. G. A. Guyenne (Noordwijk : ESA), ESA SP-220, 37 Nordlund, A . 1985, in Theoretical Problems in High Resolution Solar Physics, ed. H. U. Schmitt (Munich : Max-Plank-Institute fur Astrophysik), 1
513
Nordlund, A ., & Stein, R. F. 1990, Comput. Phys. Comm., 59, 119 ÈÈÈ. 1991, in Lecture Notes Phys., Vol. 388, Challenges to Theories of Moderate-Mass Stars, ed. D. O. Gough & J. Toomre (Berlin : Springer), 141 Parker, E. N. 1991, ApJ, 380, 251 Pedlosky, J. 1979, Geophysical Fluid Dynamics (Berlin : Springer) Porter, D. H., & Woodward, P. R. 1994, ApJS, 93, 309 ÈÈÈ. 1996, in preparation Porter, D. H., Woodward, P. R., Yang, W., & Mei, Q. 1990, in Ann. NY Acad. Sci., Vol. 617, Nonlinear Astrophysical Fluid Dynamics, ed. R. Buchler (New York : New York Acad. Sci.), 234 Pouquet, A., Porter, D. H., & Woodward, P. 1994, Phys. Fluids, 6, 2133 Proudman, J. 1916, Proc. R. Soc. Lond. A, 92, 408 Pulkinnen, P. Tuominen, I., Brandenburg, A., Nordlund, A ., & Stein, R. F. 1993, A&A, 267, 265 Rast, M. P. 1996, in preparation Rast, M. P., Nordlund, A ., Stein, R. F., & Toomre, J. 1993, ApJ, 408, L53 Rast, M. P., & Toomre, J. 1993a, ApJ, 419, 224 ÈÈÈ. 1993b, ApJ, 419, 240 Richtmyer, R. D., & Morton, K. W. 1967, Di†erence Methods for Initial Value Problems (New York : Interscience) Rosner, R., & Weiss, N. O. 1985, Nature, 317, 790 Rudiger, G. 1989, Di†erential Rotation and Stellar Convection : Sun and Solar-type Stars (New York : Gordon & Breach) Scherrer, P. H., et al. 1995, Sol. Phys., 162, 129 She, Z.-S., Jackson E., & Orszag S. 1990, Nature, 344, 226 SoÐa, S., & Chan, K. L. 1984, ApJ, 282, 550 Somerville, R. C. J., & Lipps, F. R. 1973, J. Atmos. Sci., 30, 590. Stein, R., & Nordlund, A . 1989, ApJ, 342, L95 Stein, R. F., & Nordlund, A. 1991, in Lecture Notes Phys.,388, Challenges to Theories of Moderate-Mass Stars, ed. D. O. Gough & J. Toomre (Berlin : Springer), 195 ÈÈÈ. 1994, in IAU Symp. 154, Infrared Solar Physics, ed. D. Rabin, J. Je†ries & C. Lindsey (Dordrecht : Kluwer), 225 Stein, R., Nordlund, A ., & Kuhn, J. R. 1989, in Stellar and Solar Granulation, ed. R. J. Rutten, & G. Severino (Dordrecht : Kluwer), 381 Taylor, G. I. 1921, Proc. R. Soc. Lond. A, 100, 114 Tomczyk, S., Schou, J., & Thompson, M. J. 1995, ApJ, 448, L57 Toomre, J., & Brummell, N. H. 1995, in Proc. 4th SOHO Workshop Helioseismology, ed. J. T. Hoeksema et al. (Noorwijk : ESA), ESA SP-376, 1, 47 Toomre, J., Brummell, N. H., Cattaneo, F., & Hurlburt, N. E. 1990, Comput. Phys. Comm., 59, 105 Veronis, G. 1959, J. Fluid Mech., 5, 401 Vincent, A., & Meneguzzi, M. 1991, J. Fluid Mech., 225, 1 Werne, J. 1993, Phys. Rev. E., 48, 1020 Werne, J., DeLuca, E. E., Rosner, R., & Cattaneo, F. 1991, Phys. Rev. Lett., 67, 3519 Woodward, P. R., Porter, D. H., Winkler, K.-H., Chalmers, J. W. Hodson, S. W., & Zabusky, N. J. 1987, in Science and Engineering on Cray Supercomputers (Minneapolis : Cray Res.), 557