Two-Steps Graph-Based Collaborative Filtering Using User and Item Similarities: Case Study of e-Commerce Recommender Systems Aghny Arisya Putra, Rahmad Mahendra, Indra Budi, and Qorib Munajat Faculty of Computer Science, Universitas Indonesia
[email protected], {rahmad.mahendra, indra, qorib.munajat}@cs.ui.ac.id Abstract—Collaborative filtering has been used extensively in the commercial recommender system because of its effectiveness and ease of implementation. Collaborative filtering predicts a user‘s preference based on preferences of similar users or from similar items to items that are purchased by this user. The use of either user-based or item-based similarity is not sufficient. For that particular issues, hybridization of user-based and itembased in one collaborative filtering recommender system can be used to sort relevant item out of a set of candidates. This method applies similarity measures using link prediction to predict target item by combining user similarity with item similarity. The experiment results show that the combination of user and item similarities in two-steps collaborative filtering setting improves accuracy compared to the algorithm applying only user or item similarity.
I. I NTRODUCTION Internet has become a medium for various forms of economic activities, one of which is virtual market for commercial transactions. Internet commerce, known as e-commerce, can be defined as a concept that includes any form of business transaction or exchange of information carried out using ICT [1]. An e-commerce platform can cover the entire transactional process from the product introduction stage to the sales stage [2]. E-commerce offers benefits of ease of use, efficiency, and effectiveness for its users. In addition to reduce operational costs, e-commerces also make the services more reachable. Despite its advantages, the practice of e-commerce has the consequence of information overload. Using e-commerce, customers are exposed to huge variation of products with varieties of information as well. For example, there are number of items with similar functionalities, but they belong to different brands, names, and other attributes. An effective way to maintain and enhance customer satisfaction is to help the consumers to identify the items that they are looking for based on their preferences and interests [3]. A recommender system can be implemented on top of an ecommerce site to recommend specific products to customers. The list of recommendation may be produced based on varieties of methods. For example, products are recommended based on highest sales amount, customer demographics, or past purchasing history [4]. The recommender system predicts the interest of a user (individual or business) to items (goods or services) based on information related to users, items, or
interactions between both of them [5]. The system is designed to select the most relevant items from a range of options. A key feature of the recommender system is its ability to predict user preferences through behavioral analysis. Therefore, the recommender system for e-commerce needs to capture information what products are preferred by certain customers. The preferences reflected by the history of customer activity can serve as basis of prediction. In the context of e-commerce domain, several kinds of data can be collected to infer customer preferences, such as purchases record, reviews or rating provided by customers for a particular product, and log history stored when customer using e-commerce platform. The log data include, but not limited to, amount of time that a customer spends when paying attention to a product in web page, set of keywords that a customer types into the search box when searching a product, and frequency of customers viewing specific page about product. Those transaction data can be represented in formal form using notation. For example, an item α by the user i is denoted in notation riα . The value can be a number within scale (e.g. five-stars rating system a la Amazon) or binary state corresponding to interaction between the user and the item (e.g. a purchase transaction or a Facebook like button). When the user i provides an assessment on the item α using rating or does an action indicating when he/she likes or dislikes the item, the evaluation of the item α by the user i is called as an explicit rating. On the other hand, there exists another type of evaluation, named implicit rating, for example: a purchase transaction. The value of riα in both like / dislike action and purchase activity is either 0 or 1. The interpretation of riα = 1 shares almost similar semantics in both cases (the user i ‘likes’ or purchase the item α), while riα = 0 has different meaning in each other case. In case of purchase activity, riα = 0 indicates no evaluation. We do not know yet whether the user likes or dislikes the item. To differentiate with binary evaluation (e.g like / dislike action), type of evaluation like purchase activity is called as unary rating. Collaborative filtering approach in recommender systems makes use of rating from users as reference to provide recommendation to other users. Our study aims to examine use of unary rating to construct user-similarity and item-similarity, and then to incorporate both types of similarity to improves
the accuracy of prediction. The similarities are calculated using link prediction in graph representation. II. G RAPH -BASED C OLLABORATIVE F ILTERING
1) Common Neighbors: This measurement calculates how many overlapping neighbors that two nodes have as the similarity score of those nodes. A positive correlation between the number of neighbors of nodes x and y at time t means considerably high probability to have a new common neighbor(s) at time t + k. Formally, common neighbors similarity between node x and y is written as
Graph analysis is the method that can be used to study the structure and composition of various complex systems. A graph consists of a set of elements called nodes or vertices and connections called edges or links. Research on transitive associations in the context of recommender systems is generally implemented using a graph-based model for two reasons. First, a graph or network-based model is easily interpreted and provides a more natural and intuitive framework for different types of applications. Second, many of the graphbased algorithms can be directly implemented to various domain including recommendation problem for e-commerce data.
2) Jaccard Coefficient: This coefficient measures the probabilities of x and y having the same feature of f [8]. If f is considered a neighbor, then this metric intuitively measures the proportion of neighbors of x which also correlates with y, so that this metric can be seen as a similarity measure between x and y. The equation of the Jaccard coefficient is
A. Graph Modelling
J(x, y) =
The transaction data of purchasing items by user can be expressed in graph form by representing user and item as node and transaction as relationship. This form is a bipartite graph consisting of two disjoint sets and has no relationship connecting between nodes in the same set. In social-network literature, these types of graphs are called affiliation networks. Since most of the theoretical researches focus on unipartite graph topology, the empirical studies of graph-based recommender systems represent bipartite graphs into two unipartite graphs. Each of graph has only one node type which is then being analyzed regarding with the topological properties. Zhou et.al. provides guidance on how to project bipartite graphs into unipartite graphs using one-mode projection method [6]. In this study, users and items are projected into two separate graphs. The relationship between two user nodes in a user graph infers that the consumer has purchased at least one common item (common purchase relationship). With the same approach, a relationship between two items in a item graph infers that the item has been purchased by at least one (common buyer relationship). A metric that can be directly used to measure how close a node is to another node is graph distance. Given the absence of continuous data that represents a user’s preference for an item; therefore, in this study, the most essential data for compiling a list of recommendation is the similarity score between users and items based on the degree of common purchases and common buyers. B. Similarity Measures To compute similarity score between users and items, we examined four similarity measurements from Huang et.al. experiment [7], namely common neighbors, Jaccard’s coefficient, Adamic-Adar, and preferential attachment. Each measurement is composed by concept of neighbor, denoted in notation Γ(x). If x is a user node, then Γ(x) is set containing all item nodes purchased by x. If x is an item node, then Γ(x) is set containing all user nodes purchasing x.
CN (x, y) = |Γ(x) ∩ Γ(y)|
|Γ(x) ∩ Γ(y)| |Γ(x) ∩ Γ(y)| = |Γ(x) ∪ Γ(y)| |Γ(x)| + |Γ(y)| − |Γ(x) ∩ Γ(y)|
where 0 ≤ J(x, y) ≤ 1. If both x and y are empty sets, then the value of Jaccard coefficient J(x, y) = 1. 3) Adamic-Adar: This metric improves simple computation on common neighbors by adding greater weight to the fewer neighbor’s relations [9]. Adamic-Adar similarity formalizes the idea that an item with fewer relationships has more representative information. The purpose of this metric is to reduce the bias caused by popular nodes. For example: x and y having common neighbors a and b, where a has fewer relations than b. Then, the similarity values of x and y based on common neighbors a is higher than those of b. The formula for Adamic-Adar is as follows. AA(x, y) =
X z∈Γ(x)∩Γ(y)
1 log |Γ(z)|
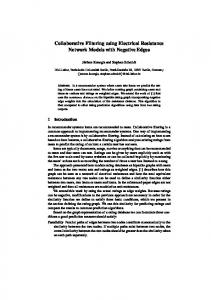
4) Preferential Attachment: A concept that is often used in social networks states that nodes with many neighbors tend to create more relationships. In the case of financial capability, this is illustrated by the phenomenon in which a rich person tends to be easier to become rich or the rich will be richer. Preferential attachment similarity measure tries to estimate how ‘rich’ nodes x and y are by calculating the multiplication between the number of neighbors of x (|Γ(x)|) and y (|Γ(y)|). Note that this similarity does not require any neighbor information, so it can be said that this index has relatively low computation complexity. P A(x, y) = |Γ(x)| · |Γ(y)| C. User Similarity and Item Similarity Computation of user and item similarity is illustrated in an example in Fig. 1. Given three users: M 1, M 2, and M 3, and four items: P 1, P 2, P 4, and P 6. M 1 purchased P 1 and P 2; M 2 purchased P 1, P 2, and P 4; and M 3 purchased P 6.
Fig. 1. User Similarity and Item Similarity
1) User Similarity: Neighbors of each user are listed in the following sets.
Γ(P 1) = {M 1, M 2}
Γ(M 1) = {P 1, P 2}
Γ(P 2) = {M 1, M 2}
Γ(M 2) = {P 1, P 2, P 4}
Γ(P 4) = {M 2}
Γ(M 3) = {P 6}
Γ(P 6) = {M 3}
The calculation of similarity between users using common neighbor is as follows.
The calculation of similarity between items using preferential attachment is as follows. P A(P 1, P 2) = |Γ(P 1)| · |Γ(P 2)|
CN (M 1, M 2) = |Γ(M 1) ∩ Γ(M 2)| = |{P 1, P 2} ∩ {P 1, P 2, P 4}|
=2·2 =4
= |{P 1, P 2}| =2
P A(P 2, P 4) = |Γ(P 2)| · |Γ(P 4)| =2·1 =2
CN (M 2, M 3) = |Γ(M 2) ∩ Γ(M 3)| = |{P 1, P 2, P 4} ∩ {P 6}| = |{}| =0 2) Item Similarity: Neighbors of each item are listed in the following sets.
D. Collaborative Filtering Algorithms Collaborative filtering takes advantages on the ratings of user u as well as those of other users in the system to return a ranked list of items based on rating predictions. The key idea is that the rating of u for a new item i is likely to be similar to that of another user v, if u and v have rated other items in a similar way. Likewise, u is likely to rate two items
i and j in a similar fashion, if other users have given similar ratings to these two items [10]. Collaborative filtering make assumption that users with similar tastes in the past will have similar tastes in the future. User preferences are supposed to remain stable and consistent over time. ‘Pure’ collaborative filtering is neighbor-based. Two methods are user-based and item-based collaborative filtering. 1) User-based Collaborative Filtering: This method makes recommendations by looking at the rating of an item given by a user who has a certain level of similarity to the target user, then the assessment is used as a reference to recommend the item to target user. 2) Item-based Collaborative Filtering: This method analyzes the inter-item similarity rather than predicting preferences based on similarity between users. If two items have a tendency to be liked by the same user, then the item is considered to be similar. Users are also considered to have the same preference for items that are similar to items they have ever purchased. In practice, a large number of ratings from similar users or similar items are not available, due to the sparsity inherent to rating data. Consequently, prediction quality using either user-based or item-based collaborative filtering only can be poor. In this study, we propose two steps to incorporate information about user similarity and item similarities in graph-based collaborative filtering. First, filter a number of N users who have the highest similarity score (top-N similar users) with user u. Instead relying on user similarity only to give recommendation, we consider the items purchased by topN similar users as shortlisted candidate to be processed in next step. Second, rank the candidate based on item similarity. We call our approach as two-steps combined user and item similarities in graph-based collaborative filtering (TSUISIMCF). We provide the detail of TSUISIMCF in Algorithm 1. III. E XPERIMENTAL D ESIGN Our study used experimental approach with data collected from an e-commerce company in Indonesia. The data are preprocessed by transforming them into the required form and then stored in graph database. Implementation of recommender systems is then applied to the data. The last step is evaluating the performance of methods. The data include list of (anonymous) customers and transactions within a period of 18 months from January 2014 to June 2015. There are 3 groups of data, namely customer, product, and purchasing data. The graph database is used to store and retrieve information stored in the network topology. This type of database is optimized to store data as nodes and relationships. Attributes can be added in nodes or relationships. Each node can be given one or more labels as an optional identification. However, a relationship must be given a name / type that will simultaneously act as a label. The graph database is suitable for storing information that has the characteristics of connectedness to each other. In addition, the graph database is also possible to store real-world information in the form of relationships with
Algorithm 1: TSUISIMCF Algorithm M is a set containing all user nodes P is a set containing all item nodes Transaction Graph Bipartite Graph G = (V, E) V =M ∪P E = {(m, p) : m ∈ M, p ∈ P } User Similarity Graph Weighted graph GUSIM = (M, (mi , mj ), sim(mi , mj )) where mi , mj ∈ M Item Similarity Graph Weighted graph GISIM = (P, (pi , pj ), sim(pi , pj )) where pi , pj ∈ P Task: Recommend n items from P to target user mtarget foreach (mtarget , p) ∈ E in graph G do Select p, store to set ‘BoughtItem’ end Select User Neighborhood Create a sorted list containing all users, except mtarget The order based on user similarity in graph GUSIM Select k first users in the sorted list (which means k users who are most similar to user mtarget ) Store to set ‘SelectedUser’ Select Candidate Items for x : 1 to cardinality of set ‘SelectedUser’ do mx in set ‘SelectedUser’ foreach (mx , p) ∈ E in graph G do if p ∈ / set ‘BoughtItem’ then Select p, store to set ‘CandidateItem’ end end end Rank Candidate Item foreach py in set ‘CandidateItem’ do Score for py = max sim(py , pk ) where 0 pk ∈‘BoughtItem
similarity between item is from graph GISIM end Create a sorted list containing all items in set ‘CandidateItem’ based on score Select n first items in the sorted list (to offer as list of recommendation to user mtarget )
TABLE I E VALUATION R ESULT OF TSUISIM A LGORITHM Precision ISIM
Jaccard Coefficient Adamic Adar Common Neighbor Preferential Attachment
Jaccard Coefficient 1.19% 5.57% 3.19% 9.45%
Adamic Adar 0.11% 5.15% 1.70% 9.63%
TABLE II E VALUATION R ESULT OF U SER -BASED C OLLABORATIVE F ILTERING Similarity Jaccard coefficient Adamic Adar Common Neighbor Preferential Attachment
Precision 7.13% 4.57% 5.30% 1.43%
TABLE III E VALUATION R ESULT OF I TEM -BASED C OLLABORATIVE F ILTERING Similarity Jaccard coefficient Adamic Adar Common Neighbor Preferential Attachment
Precision 0.38% 4.06% 3.46% 8.28%
small risk of inconsistency in impedance and relatively small information reduction. We use Neo4j for the database platform. Neo4j is an open source NoSQL database that stores data in a graph structure, consisting of a set of nodes connected by a set of relationships. Neo4j graph structure can provide excellent performance in terms of storage and retrieval of complex data, and still able to maintain an intuitive and simple representation. The Neo4j database has been commercially developed and has a community that actively contributes to the development and socialization of this software. There are 50,000 users recorded, but only 26,665 users have ever made transactions at least once. In the test scheme, users who have no transaction are not included in the bipartite graph (relationship between the user and the product). The data for each user is divided into two groups which are 70% training data and 30% testing data. Because the experiment will evaluate 10 items of recommendation results, only users who have transactions more than 30 are selected to be the target user being evaluated. Among the total of 95,468, only 40,081 products have been purchased by user. Because this study did not consider the cold-start condition, only the products that have history of purchases are included in the test. From the filtering process, we obtained data as follows: 1,235 users, 40,081 items, and 63,823 transactions. IV. R ESULT AND E VALUATION To find the best method, we evaluate three approaches of collaborative filtering which are user-based collaborative filtering, item-based collaborative filtering, and a combination of both (as described in algorithm TSUISIMCF). Four similarity
USIM Common Neighbor 0.34% 4.45% 2.26% 9.38%
Preferential Attachment 0.11% 1.32% 0.29% 8.54%
metrics, Jaccard coefficient, Adamic-Adar, common neighbors and preferential attachments, are used to measure the similarity level between two nodes (user with user and item with item). Table II and III respectively show the experimental result for user-based and item-based collaborative filtering, while Table I provides the testing result of algorithm TSUISIMCF. Using common neighbors, the result of combinations is similar to when using only user similarity. Therefore, it can be observed that the using of item similarity did not affect the result combination scheme in common neighbors. While using Jaccard coefficient metrics, the results of userbased collaborative filtering is much better than the result in which user similarity and item similarity are incorporated in TSUISIMCF. Generating recommendations using a combination of user similarity and item similarity calculated using Adamic-Adar and preferential attachments yields insignificant improvement. Common neighbors and preferential attachment contribute well if one of them is chosen as item similarity measurement. On the other hand, Jaccard coefficient is a good choice for user similarity. The best result is achieved by TSUISIMCF setting using preferential attachment as item similarity and Jaccard coefficient as user similarity, with F-1 score 9.63%. Common neighbors and Jaccard coefficient metrics have a calculation that depends on the number of neighbor of two nodes. In Jaccard coefficient, the number of overlapping neighbors is then divided by the total number of neighbors of two nodes being measured. The experimental result in our study indicate that calculations number of overlapping neighbors in Jaccard have been shown to be more effective than simply counting total neighbor node in common neighbors. The combination of Jaccard coefficient as the user similarity and preferential attachment metric as the item similarity metric gives better results almost 9 times compared to Jaccard coefficient as the item similarity and 3 times better than common neighbors as the item similarity. V. R ELATED W ORK Previous works that are related to our study are works on recommender systems for e-commerce data, graph-based model for collaborative filtering, and unification of user and item similarites in collaborative filtering algorithm. Aprilianti et.al. [11] studied the recommender systems for ecommerce data with the approach of weighted hybrid collaborative filtering and content based filtering. Pearson Correlation is used to calculate user similarity. The study showed that there is an increase in precision and recall in hybrid scenarios
compared to the performance of a single filtering and contentbased filtering recommender systems. Huang [12] studied the modeling of recommender systems in e-commerce using graph analysis. The use of link prediction algorithms on recommendation systems is becoming increasingly popular. Cukierski [13] employed supervised link prediction to solve the problem of anonymity data for graphbased feature. Huang [14] conducted a comprehensive exploration of the use of link prediction in collaborative filtering with a focus on user generated content system domains. Huang constructed a recommendation algorithm which locates a neighborhood user through identification of overlapping interactions or the same rating of common items. The task of finding unobserved links for each user node can be seen as a link prediction problem. User-item interactions are depicted in bipartite graphs and links that connect the nodes are not weighted. That study found that link prediction and network analysis can be used to improve the existing collaborative filtering algorithm. Wang et al. [15] worked a unification of user and item-based algorithms on data possessing binary rating. User and item similarities are calculated using Pearson correlation and/or cosine similarity. Verstrepen [16] proposed reformulation that unifies user and item-based nearest neighbors algorithms for one-class collaborative filtering in which there exists for every user a set of items about which the user has given positive-only feedback (kind of unary rating). VI. S UMMARY Our study implements collaborative filtering recommender systems using combination of user similarity and item similarity on e-commerce data. We experiment with several similarity metrics, such as common neighbors, Adamic-Adar, Jaccard coefficient, and preferential attachment, to predict links between nodes which are used to generate recommendation. We found that, by only taking into account the user similarity, the best result is obtained by Jaccard coefficient metric with precision value of 7.1%. While the best result recommendation system that only consider user similarity is obtained by preferential attachment metric with precision value of 8.3%. The results show that item similarity has tendency to be more dominant compared to user similarity. For several experimental settings, the combination of user and item similarities can increase the precision of the recommendations. The best precision result from a combination of user similarity and item similarity is 9.6%. The combination approach increased the precision by 2.5% compared to the approach that relies only on user similarity and by 1.3% compared to item similarity only. ACKNOWLEDGEMENT The authors gratefully acknowledge the support of the “Hibah Publikasi Internasional Terindeks untuk Tugas Akhir Mahasiswa tahun anggaran 2017” (PITTA UI Grant 2017) Contract No. 406/UN2.R3.1/HKP.05.00/2017
R EFERENCES [1] K. Laudon and C. Traver, E-commerce 2015. Pearson Higher Ed, 2015. [2] J. L. Joines, C. W. Scherer, and D. A. Scheufele, “Exploring motivations for consumer web use and their implications for e-commerce,” Journal of consumer marketing, vol. 20, no. 2, pp. 90–108, 2003. [3] Z. Liao and M. T. Cheung, “Internet-based e-shopping and consumer attitudes: an empirical study,” Information & Management, vol. 38, no. 5, pp. 299–306, 2001. [4] J. B. Schafer, J. Konstan, and J. Riedl, “Recommender systems in ecommerce,” in Proceedings of the 1st ACM conference on Electronic commerce. ACM, 1999, pp. 158–166. [5] J. Lu, D. Wu, M. Mao, W. Wang, and G. Zhang, “Recommender system application developments: a survey,” Decision Support Systems, vol. 74, pp. 12–32, 2015. [6] T. Zhou, J. Ren, M. Medo, and Y.-C. Zhang, “Bipartite network projection and personal recommendation,” Physical Review E, vol. 76, no. 4, p. 046115, 2007. [7] Z. Huang, X. Li, and H. Chen, “Link prediction approach to collaborative filtering,” in Proceedings of the 5th ACM/IEEE-CS Joint Conference on Digital Libraries, ser. JCDL ’05. New York, NY, USA: ACM, 2005, pp. 141–142. [Online]. Available: http://doi.acm.org/10.1145/1065385.1065415 [8] P. Jaccard, Etude comparative de la distribution florale dans une portion des Alpes et du Jura. Impr. Corbaz, 1901. [9] L. A. Adamic and E. Adar, “Friends and neighbors on the web,” Social networks, vol. 25, no. 3, pp. 211–230, 2003. [10] F. Ricci, L. Rokach, and B. Shapira, “Recommender systems: introduction and challenges,” in Recommender Systems Handbook. Springer, 2015. [11] M. Aprilianti, R. Mahendra, and I. Budi, “Implementation of weighted parallel hybrid recommender systems for e-commerce in indonesia,” in Proceedings of the 2016 International Conference on Advanced Computer Science and Information Systems (ICACSIS). IEEE, 2016, pp. 321–326. [12] Z. Huang, W. Chung, and H. Chen, “A graph model for e-commerce recommender systems,” Journal of the American Society for information science and technology, vol. 55, no. 3, pp. 259–274, 2004. [13] W. Cukierski, B. Hamner, and B. Yang, “Graph-based features for supervised link prediction,” in Neural Networks (IJCNN), The 2011 International Joint Conference on. IEEE, 2011, pp. 1237–1244. [14] Z. Huang, X. Li, and H. Chen, “Link prediction approach to collaborative filtering,” in Proceedings of the 5th ACM/IEEE-CS joint conference on Digital libraries. ACM, 2005, pp. 141–142. [15] J. Wang, A. P. de Vries, and M. J. T. Reinders, “Unifying user-based and item-based collaborative filtering approaches by similarity fusion,” in Proceedings of the 29th Annual International ACM SIGIR Conference on Research and Development in Information Retrieval, ser. SIGIR ’06. New York, NY, USA: ACM, 2006, pp. 501–508. [16] K. Verstrepen and B. Goethals, “Unifying nearest neighbors collaborative filtering,” in Proceedings of the 8th ACM Conference on Recommender Systems, ser. RecSys ’14. New York, NY, USA: ACM, 2014, pp. 177–184.