Universal Asset Assessment System Based on Excel™ George Markowsky Department of Computer Science University of Maine Orono, ME, USA
[email protected] Abstract— At the 2009 IEEE International Conference on Technologies for Homeland Security the author presented a paper entitled “Comparing Apples to Oranges” which showed the fundamental problem of ranking assets on multiple-factors. In particular, the talk showed that programs like Carver2 cannot consistently order targets. In particular, the author contends that using a spreadsheet such as Excel™ permits users to do as good a job of assessing targets as more dedicated systems. To improve the usefulness of Excel™ for target selection, the author has written a module that permits the spreadsheet to identify Condorcet cycles so that users will get a more realistic understanding of the vulnerability of their various assets. This paper describes the theoretical basis for this module and illustrates its operation. This module is available from the author.
Keywords-component; target selection; risk assessment; multiple factors; consistent decisions; Condorcet cycles; Excel™; target ranking; CARVER2™.
1. A ≤ A for all elements 2. If A ≤ B and B ≤ A, then A = B. 3 If A ≤ B and B ≤ C, then A ≤ C. Partial orders get their name because it is not necessary that any two elements can be compared. Ideally people would love to have a total or liner order. A total or linear order is a partial order such that for any two elements A and B, either A ≤ B or B ≤ A. Generally, people want a total or linear order on their assets as well since for any two assets people would want to put one ahead of the other. Of course, we want to avoid ties as much as possible so we can have real priorities. In particular, we want to avoid the trivial linear order, which treats any two assets as equal. I pointed out in [3] that analysis based on linear orders is not likely to produce answers without inconsistencies. In particular, these problems are a consequence of Arrow’s Theorem, which is described in [1] and [2]. Essentially, Arrow’s Theorem states that under very general conditions the only consistent decision making system is to rank items by a single factor. It is important to note that even though there are difficulties in producing a non-controversial order, it is still important to do target assessment because it makes you think about your targets and the various linkages between them. In trying to assess targets, you must try to think about all sorts of possibilities. Target assessment suggests a military or terrorism perspective. It is important to note that target assessment should be done for natural disasters and accidents. The value of such exercises should not be underestimated. In [3], I illustrated this problem with an example taken from [4]. [4] describes the CARVER2™ software package which helps people assess targets without any specialized training. This paper describes how Excel™ can be used to perform this type of analysis. With the addition of the Condorcet module, Excel™ can also find Condorcet cycles, which gives another perspective on target assessment. In the next section we give a brief description of CARVER2™ after which we examine the example and illustrate how our Condorcet module handles this example. II. CARVER2™ CARVER2™ is a critical infrastructure analysis tool that was produced by the National Infrastructure Institute's Center for Infrastructure Expertise. CARVER2™ is described [4] as being a "simple, non-technical, PC-based tool that ranks critical infrastructure in order of importance." It is provided free-of-charge to government agencies, but not generally distributed to the public. A number of claims are made for the product:
I. TARGET ASSESSMENT There are always tradeoffs. This is especially true in the arena of target assessment. One can’t protect all possible targets and so one must prioritize targets and allocate resources accordingly. A common way to do this is consider a multitude of factors and somehow create a list from consideration of these factors. Since we are seeking to order targets, all the factors 1. It is the only tool that provides for "cross-sector" scoring we consider are also ordered. Ordering permits us to talk and ranking. about “more” or “less”, as in “more probable” or “less probable.” Any time people use the words "more" or 2. It is based on recognized methodology used by the Secret Service and the U.S. military. "less" they are talking about partial orders. A partial order is a set with a relation on it, generally denoted by ≤, such 3. It is used in 35 states and in over 100 local jurisdictions. that the relation ≤ satisfies three properties:
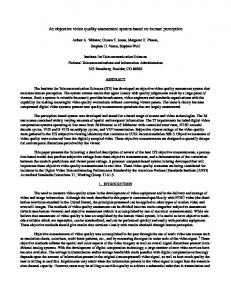
Figure 1. The Main Screen For CARVER2™ The acronym CARVER comes from the terms Criticality, Accessibility, Recoverability, Vulnerability, Espyability (Notoriety), and Redundancy, which are the 6 categories used to rank targets. Figure 1 shows the main screen of CARVER2™. Criticality is addressed by the three drop-down boxes shown in Figure 2. Figure 3 shows some of the possible values that are in each box.
Figure 3. Some Criticality Values
Figure 2. Input Area for Criticality Note that each of the three criteria considered in criticality is presented as a linear order. In other words, it seems clear that some object whose loss would lead to 100,000+ deaths should merit more serious protection than something that would result in 20 deaths, assuming all deaths are being treated as equal. You can look at [3] and [4] for more details on CARVER2™ and the various factors that it considers.
III. COMPARING APPLES AND ORANGES It is clear that the factors considered by CARVER2™ are quite different from one another. Some involve lives, some involve dollars, etc. The question that an analyst faces is how to tradeoff lives for money. Certainly, there is no one answer that would satisfy everyone. Figure 4 shows an example taken from [4].
We now want to look through the example shown in Figure 4 and see whether we can find Condorcet cycles. Our method is to think of each column in Figure 4 as an individual, in particular, each column can be an expert. The rankings that each column has are based on the numerical score in that column. For the first five columns a higher score is better, but the reverse is true for the last column. To make it easier to follow the discussion, we have modified Figure 4 to give Figure 5 in which the last column is adjusted so that higher scores are better. This allows us to treat the columns uniformly. The modification of the last column is done by replacing value n by 100 - n. Figure 4. Sample Output of CARVER2™ Figure 4 shows the eight top-scoring objects in the sample demo neatly arranged by total score. This arrangement would suggest to people that the Monument would be the target having the greatest need for protection. Note, however, that the Monument’s Criticality score is just 56, and that this score is exceeded by two of the bridges, one of the tunnels and the Chemical Plant. Note that the total score is computed by the formula: Total = Crit + Access + Recov + Vuln + Espy – Redun We use abbreviations for the six categories so the formula fits on one line. Notice that the Redundancy score is subtracted from the others because a higher redundancy makes the target less essential. A bit of analysis suggests that this formula is not a good way to combine factors. In particular, consider two objects in particular – the Small Monument and the Chemical Plant. It is probably a fair assumption that losing a small monument would probably result if fewer lives lost than might happen if a chemical plant were destroyed (e.g., Bhopal ). And appropriately, we note that the Criticality score for the Small Monument is 20 while for the Chemical Plant it is 70. Nevertheless, regardless of how many lives might be lost through the destruction of the Chemical Plant (the possibility of more than 100,000 lives being lost is shown in Figure 3), the Criticality score cannot exceed 100. Even if we raised the Criticality score of the Chemical Plant to 100, it would still rank below the Small Monument in importance. This is aberration, but an artifact of trying to compare apples and oranges.
Figure 5. Figure 4 With The Last Column Redone Let's look at Figure 5 and see if we can find Condorcet cycles using majority voting where each column gets one vote. Consider a two-way race between the Small Monument and the RR Station. Note that the Small Monument beats the RR Station in 4 of the 6 columns (2, 3, 4, 6). Now consider a two-way race between the RR Station and Tunnel 1. Here we get a tie. The RR Station wins in columns 2 and 4. Tunnel 1 wins in columns 1 and 3. The two objects have identical scores in columns 5 and 6. Now consider a two-way race between Tunnel 1 and the Small Monument. This also is a tie. The Small Monument wins in columns 2, 4 and 6, and loses in columns 1, 3 and 5. Thus we have a Condorcet cycle.
IV. CONDORCET CYCLES Arrow's Theorem [1, 2, 3] implies that for every method of combining preferences that satisfies some reasonable assumptions, there are circumstances in which inconsistencies will show up. These inconsistencies will show up in the form of a series of choices that form a cycle. In general, we have the following definition. Definition: Given a decision method that can choose between two alternatives. A Condorcet cycle of length k is a series of alternatives A1, A2, …, Ak such that A1 is preferred to A2, A2 is preferred to A3, …, Ak-1 is preferred to Ak, and Ak is preferred to A1.
Figure 6. A Complete Analysis of the Sample Output To analyze the situation more completely we produced the table shown in Figure 6. 1 in an entry with row label A
and column label B means that A is preferred over or ties B. 0 means that A loses to B. For example, the entry in row CP and column B3 is 1, which means that the Chemical Plant (CP) is preferred over or ties Bridge 3 (B3). If we now look for Condorcet cycles we get the results shown in Figure 7. Here 1 in an entry with row label A and column label B means that we can find a chain of preferences such that A is preferred over or ties C, and C is preferred over or ties D, and so on until we get to B. Of special interest is the shaded block in the table. The elements in the shaded block are actually tied using these chains of preference.
V.
USING EXCEL™ FOR TARGET ASSESSMENT
Figure 9 shows the same targets listed in an Excel™ worksheet. You will note that the first row contains some -1’s and 1’s, the cell containing the word “Criticality” has a red mark in the top right corner, the Criticality column contains the numbers 1-6, and the Accessibility Column contains the letters A through F. This was all done to illustrate the flexibility of Excel™. Note, in this paper Excel™ refers to Excel 2003™.
Figure 9. Showing Off Excel’s Capabilities
Figure 7. The Complete Analysis of Preferences The analysis in Figure 7 shows that five of the objects should be considered as being roughly equivalent. In particular, if we give each criterion one vote, then we should consider the Small Monument, the RR Station, Bridge 1, Tunnel 1 and the Chemical Plant as being equivalent. The ordering that follows from Figure 7 is shown in Figure 8.
First, the numbers in the first row tell us how the ordering is to be interpreted. A 1 means that larger numbers are more significant small numbers and letters later in the alphabet are more significant than letters that come earlier in the alphabet. A -1 means the opposite. For example, a -1 in the Criticality column means that a score of 1 indicates greater criticality than a score of 2, etc. Similarly, in the Accessibility column a -1 indicates that A is a more significant mark than F. On the other hand, the next three columns use numbers from 0 to 100 and contain a 1 which means that higher scores are more significant than lower scores. Because we are using Excel™, we are not limited to how many factors we can consider. Of course, there are always practical limits, but we can make up our own factors and include as many of them as we wish. The red mark in the upper right corner of the Criticality cell indicates that there is a comment associated with that cell. If you put your mouse over the cell, you get the result shown in Figure 10.
Figure 8. The Order Derived from Figure 7 The analysis necessary to establish the results in Figures 7 and 7 is tedious when there are a large number of objects to consider. Even for small sets of objects as we have in Figure 7, the work needs to be done carefully. We will now consider how we can use Excel™ to do this analysis.
Figure 10. Illustrating Cell Comments Comments can be inserted and edited by using the Insert menu in Excel™. The beauty of using Excel™ is that we can assign values in any reasonable way as long as
Excel™ knows how to compare them. We can insert currency, letters, words, and even dates and everything will work as long as we can compare values. Having the data in Excel™ permits us to use the powerful tools that Excel™ has. We can sort the data by a variety of combinations of columns, we can graph values and even apply many of the statistical tools. We can import data from and export data to many other programs including word processors and databases. You can also produce reports using the formatting capabilities of Excel™. You can also perform other types of security analysis using tools that can be embedded into a worksheet. For example, Bruce Schneier [5] has written a very interesting article about attack trees. A sample attack tree from [5] is shown in Figure 11.
Figure 13. Running the Condorcet Macro Figure 14 shows the results of the Condorcet cycle analysis. Note that the output makes clear what the blocks consist of and uses whatever was used in the original scale.
Figure 11. A Sample Attack Tree Excel™ permits the embedding of organization charts which can be used to represent attach trees. It also permits embedding images and many other objects. To get at the Condorcet analysis, we use the Tools >> Macro >> Macro selection in Excel™ as shown in Figure 12. Once we make that selection we get the screen shown in Figure 13. We select Condorcet and the analysis runs.
Figure 12. Running The Condorcet Analysis in Excel™
Figure 14. Output of the Condorcet Cycle Analysis VI. FUTURE WORK The Condorcet cycle analysis module for Excel™ can be refined in a number of ways. It can provide a more obvious interface. Perhaps it can also help users create the initial database. The first version assumes that the data is in Worksheet(1) and always outputs the analysis in Worksheet(2). Additional flexibility would be helpful. Finally, while Excel™ is pretty ubiquitous, the OpenOffice™ spreadsheet also has an extensive programming language built-in. Adding a Condorcet module to this spreadsheet would extend the range of users who could benefit from Condorcet cycle analysis. VII. CONCLUSIONS It is worth repeating some of the conclusions from [3] and fitting them into the context of this paper. The first conclusion is that if you want to make consistent choices you should pick one criterion and stick with it. Because of Excel’s data sorting capabilities you can look at the data arranged by a variety of factors. In general, organizations should have multiple crisis response plans and should be prepared for a wide variety of disasters as Hurricane Katrina and the recent Gulf Oil Spill illustrate. Focusing all your attention on possible terrorism leaves the door open for too many unpleasant situations. Excel™ permits
the user to create categories that best fit the problem and to assess the situation from many perspectives.
A second conclusion is to not take the numbers produced by target selection programs too seriously. They can be useful, but the results should be checked for Condorcet cycles and the final results should take this analysis into account. One might question the usefulness of going through target assessment, but there is no doubt that this is a useful exercise. Just trying to come up with factors and comparing possible targets can give you great insight into your vulnerabilities and strengths. Experience shows that even small amounts of planning can reduce casualties and damage substantially. Security is a process and any tool that helps people examine situations in a flexible manner should be embraced. I have asked students to do a CARVER2™ analysis on their own home towns as an exercise. They have turned up some interesting potential problems. One student realized that an elementary school was located rather close to some fuel storage tanks. The main conclusion of this paper is that Excel™ and other contemporary spreadsheet programs can serve as a wonderful tool for anyone seeking to improve security. The immense functionality of these powerful programs can be significantly enhanced by creating modules that can carry out more detailed analysis. REFERENCES [1]
[2]
[3]
[4] [5]
Kenneth J. Arrow, “A Difficulty in the Concept of Social Welfare", The Journal of Political Economy, Vol. 58, No. 4. (Aug., 1950), pp. 328-346. G. Th. Guilbaud, "Theories of the General Interest, and the Logical Problem of Aggregation," pp. 262-307, in Readings in Mathematical Social Science, ed. by Paul F. Lazarsfeld and Neil W. Henry, MIT Press, 1966. George Markowsky, “Comparing Apples and Oranges: How to Select the Most Probable Targets”, 2009 IEEE International Conference on Technologies for Homeland Security, Waltham, MA, May 11-12, 2009. National Infrastructure Institute Center for Infrastructure Expertise, www.ni2cie.org. CARVER2demo.pdf. Bruce Schneier, “Attack Trees”, Dr. Dobb's Journal December 1999. Also available at http://www.schneier.com/paperattacktrees-ddj-ft.html