Nov 11, 2013 - Component Analysis is going to be applied to the difference image obtained. To determine the .... measured data, cj is the d-dimension center of the cluster. As a rule, for ... We can call the first approach as âIndependent Data.
International Archives of the Photogrammetry, Remote Sensing and Spatial Information Sciences, Volume XL-7/W2, 2013 ISPRS2013-SSG, 11 – 17 November 2013, Antalya, Turkey
UNSUPERVISED CHANGE DETECTION IN SATELLITE IMAGES USING FUZZY C-MEANS CLUSTERING AND PRINCIPAL COMPONENT ANALYSIS M. H. Kesikoglu a, *, U. H. Atasever a, C. Ozkan a a
Dept. of Geomatic Engineering, Erciyes University, Kayseri, Turkey(hayrikesikoglu, uhatasever, cozkan)@erciyes.edu.tr
Commission VII, WG VII/5
KEY WORDS: Change Detection, principal component analysis, fuzzy c-means clustering, image differencing, remote sensing, bi-temporal satellite images.
ABSTRACT: Change detection analyze means that according to observations made in different times, the process of defining the change detection occurring in nature or in the state of any objects or the ability of defining the quantity of temporal effects by using multitemporal data sets. There are lots of change detection techniques met in literature. It is possible to group these techniques under two main topics as supervised and unsupervised change detection. In this study, the aim is to define the land cover changes occurring in specific area of Kayseri with unsupervised change detection techniques by using Landsat satellite images belonging to different years which are obtained by the technique of remote sensing. While that process is being made, image differencing method is going to be applied to the images by following the procedure of image enhancement. After that, the method of Principal Component Analysis is going to be applied to the difference image obtained. To determine the areas that have and don’t have changes, the image is grouped as two parts by Fuzzy C-Means Clustering method. For achieving these processes, firstly the process of image to image registration is completed. As a result of this, the images are being referred to each other. After that, gray scale difference image obtained is partitioned into 3x3 nonoverlapping blocks. With the method of principal component analysis, eigenvector space is gained and from here, principal components are reached. Finally, feature vector space consisting principal component is partitioned into two clusters using Fuzzy C-Means Clustering and after that change detection process has been done. 1. INTRODUCTION Change detection analyze is one of the most important analyzes which is done by using remote sensing data sets with the result of the observations done in different times. It is the ability to identify the differences in the situation of any object or nature or by using data sets belonging to different times to identify the occurring quantity of temporal effect (Singh, 1989). The basic logic under change detection is to find the places in the same geographical region and to identify the areas which are not similar in two or more satellite images (Firouzabadi and Ghanavati, 2007). In literature (Singh, 1989; Coppin and etc., 2004 ), there are a lot of change detection techniques. These change detection techniques can be gathered in two main topics as supervised and unsupervised change detection techniques. In unsupervised change detection, land cover and land use are identified by transforming multi-spectral multitemporal satellite images into gray scale or multi-band image. Supervised change detection technique runs in the same logic of supervised classification technique. In this technique, it is necessary to identify the suitable training classes for classification training. Although one of the advantages of supervised approach is to define the changes occurring in the land cover and land use type exactly in which classes, to produce suitable training sets is generally difficult and expensive (Bruzzone and Pireto, 2000; Pacifici, 2007). Post
classification comparison, direct multi-date data classification can be example for the techniques used in supervised approach (Frate and etc., 2004 and 2005; Schiavon and etc., 2003). In unsupervised change detection approach, to identify automatically the changes occurring in the images in different periods is preferable. The change data can be obtained using the techniques such as Change Vector Analyse (CVA), Normalized Difference Vegetation Index (NDVI), Image Differencing (ID), Image Rationing (IR) and Principal Component Analyse (PCA) (Celik, 2009). In most of unsupervised change detection approach, ID method is developed basically. In the methods whose underlying method is ID, while the value of gray pixel is high if there is change, the value is low if there is no change (Pacifici, 2007; Celik, 2009). The NDVI method performs the comparison in the same style but it uses vegetation index, linear or not linear band combinations instead of direct use of spectral bands. CVA is a change detection method (Pacifici, 2007). In this method, differences between the feature vectors belonging to every pixel in the images in different dates are found occurring new feature vectors are obtained. The direction and size of the new feature vectors show the change (Herold, 2013). The change detection with the technique of IR is performed by rationing the data pixel by pixel. This method is not so fast as ID technique but it is easier to understand. After rationing, if the values are exactly equal, it means there is no change, if the
* Corresponding author. Tel: +90 (352) 2076666-32658 Fax: +90 (352) 4375784
This contribution has been peer-reviewed. doi:10.5194/isprsarchives-XL-7-W2-129-2013
129
International Archives of the Photogrammetry, Remote Sensing and Spatial Information Sciences, Volume XL-7/W2, 2013 ISPRS2013-SSG, 11 – 17 November 2013, Antalya, Turkey
value is different from 1, we can understand there is change (Coppin and etc., 2004). Bruzzone and Prieto, 2000 suggest two automatically change analyse approach in their study. One lets an automatic selection of the decision threshold for maximizing the overall change detection error under the suggestion that the pixels of difference image are spatially independent (ExpectationMaximization (EM)-based thresholding). The other analyzes the difference image by considering the spatial contextual information included in the neighborhood of each pixel. This approach is known as Markov Random Field (MRF) technique (Celik, 2009). In this study, with the aim of identifying land cover changes occurring in north of Kayseri, Landsat 5 TM images belonging to two different dates for the same region are used in the change areas are identified automatically. While performing this process, firstly ID technique and then PCA and C-Means Clustering techniques are used in the places that have and have not got change are identified.
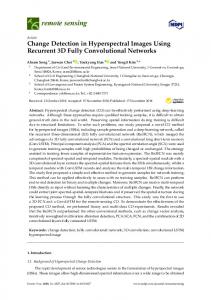
Image 2: Landsat 5 satellite image (2011) 3. THE METHODS USED
2. STUDY AREA 3.1 Principal Component Analyse Kayseri is located in Mid Kızılırmak Region where the south of Central Anatolia and Toros Mountains get near each other. Its east and north-east is Sivas, its north is Yozgat, its west is Nevsehir, its north-west is Nigde, its south is Adana and Kahramanmaras. Its surface area is about 16917 km2. Agricultural lands form about %40 of the surface area of country. The lowest land rate is forest and heath land area (URL-1).The Landsat satellite images, which belong to 2007 and 2011 years and have 30 m resolution, are selected covering Kayseri city center and north area. The satellite images of study area in 2007 and 2011 are shown in Image 1 and 2.
It is one of the principal statistical techniques. This technique is used for the aims of decreasing the noice occurring in the images, removing the relationships between multi-spectral bands or compressing the data in bands (James, 2007). PCA removes the relationships between the image bands having correlation with each other and transforms them into uncorrelated variance in linear. Generally, the number of PC is less than the number of variance in the original image. PC transformation identifies that the first component has the biggest variance as much as possible. Every component following each other is orthogonal to the next component and takes the maximum variance value. If image data set has a normal rage, the, PCs can be uncorrelated (URL-2). First, second and third bands of image have the most information. The first PC has the highest variance when it is compared to others and then the second one. When all PC variance values are added to each other, it should be equal to total variance of original data set (Ricotta, 1999). While the first PC shows albedo, second one shows the change occurring in land cover and the other ones can identify the radiometric errors such as noise (Eastman, 2006; James, 2007). 3.2 C-Means Clustering Analysis
Image 1: Landsat 5 satellite image (2007)
Fuzzy C-Means Clustering is one of the most widely used methods for unsupervised classification in remote sensing discipline. This method is developed by Dunn in 1973 and improved by Bezdek in 1981(Dunn, 1973; Bezdek, 1981). It is based on minimization of the following function: N
Jm
C
u
m ij
xi c j
2
,1 m
(1 )
i 1 j 1
where m is any real number greater than 1, uij is the degree of membership of xi in the cluster j, xi is the i th of d-dimensional measured data, cj is the d-dimension center of the cluster. As a rule, for each pixel, sum of all membership value belonging to all classes must be 1 (Bezdek, 1981). In this study FCM is used to determine changed and unchanged area from feature vector space which is created by PCA.
This contribution has been peer-reviewed. doi:10.5194/isprsarchives-XL-7-W2-129-2013
130
International Archives of the Photogrammetry, Remote Sensing and Spatial Information Sciences, Volume XL-7/W2, 2013 ISPRS2013-SSG, 11 – 17 November 2013, Antalya, Turkey
We meet two different usage of PCA in change detection studies (Muchoney and Haack, 1994; Munyati, 2004).
decreasing order and three largest Evals are selected. Then, eigen vectors (Evec) corresponding to three largest Evals are obtained. PCs including most of the information are some of the first components. Therefore, the three largest components are selected.
We can call the first approach as “Independent Data Transformation”. According to it, PCA is applied to every multi-temporal image data and components are obtained. Then every image are classified independently from each other and then post-classification change detection process is performed.
In the sixth step, PCs are obtained and feature vector space (K) is composed. This process is shown in the equation below:
4. MODEL AND APPLICATION
We can call the second approach as “Unified Data Transformation”. According to this approach, after multi-temporal satellite images are registered to each other, they are transformed into a single image data with the techniques of IR, ID, etc. Then PCA is applied to this data (Munyati, 2004).
In our study, the second approach mentioned above is used for the aim of identifying the change in north of Kayseri. The first step of process is that in ENVI software, the registration process has been done by being used I 1and I 2 Landsat satellite images in 2007 and 2010 in
K T * EVec
(6)
In the seventh step, with the help of the technique of CMeans, feature space formed by PCs has been divided into two classes and identifying the place where there is change and there is no change has been accomplished. Consequently, the areas which have change and don’t have change are identified. According to the results in C_Means technique, we have seen that %22 part of our study area has change; %78 part of our study area has no change. While the areas having change is white, the areas having no change is black in Image 5 (Gong, 1993; Celik, 2009).
the same geographical region. In second step, I1 image has been subtracted from I 2 image and image differencing (D) is obtained. D
I I 2
1
(2)
In the third step, ID has been divided into 3*3 nonoverlapping blocks. Thus, a new vector set (V) is obtained from pixel values in blocks belonging to ID.
In order to shift the data to the center, with the average of the pixel values in 3*3 nonoverlapping blocks, obtained in the previous step, average vector set are obtained. The mathematical notation of the process is shown in the equation with number 3. (μ) is average vector set, Q is the data shifted to the center. 1 M * V . (3) M i 1
V
(4)
In the fourth step, covariance matrix is calculated as shown in the equation 5. It provides to obtain eigen values and eigen vectors. The term Q T shown in equation means transposing of the data shifted to the center.
Cov
1 N * * T N i 1
(5)
In the fifth step, eigen values (Eval) are obtained by using covariance matrix. After that, Evals are sorted in
Image 5: Change Image
5. CONCLUSION It is difficult to select the suitable method for change detection because there are a lot of complex methods in literature. The developed approach in the study is important for unsupervised change detection because it is both quite easy to calculate and useful to apply. It also helps to identify meaningful changes. It takes the k*k neighborhood into account in order to subtract feature vector space for each pixel. Thus, it pays attention to related information automatically. After that, by using CMeans technique, the change information is identified from feature vector space. In the study, unsupervised change detection is performed by using C-Means Clustering on feature vectors obtained from 3*3 nonoverlapping blocks on difference image with the use of PCA. The areas where there is change and no change are divided into two classes with C-Means Technique. While identifying changing, Landsat 5 TM images belonging to 2007 and 2011 years have been used. As a result, it is observed that %22 of the area have change and %78 of the area have no change.
This contribution has been peer-reviewed. doi:10.5194/isprsarchives-XL-7-W2-129-2013
131
International Archives of the Photogrammetry, Remote Sensing and Spatial Information Sciences, Volume XL-7/W2, 2013 ISPRS2013-SSG, 11 – 17 November 2013, Antalya, Turkey
REFERENCES Atasever Ü., Özkan, C., Sunar, F., (2010), Using differential evolution algorithm in unsupervised classification, III.Remote Sensing and GIS Symposium, Kocaeli, Turkey, pp.182-189. Bruzzone L., Prieto D., (2000), Automatic analysis of the difference image for unsupervised change detection, IEEE Trans. Geoscience and Remote Sensing Letters, 38(3), 17711182. Celik T., (2009), Unsupervised change detection in satellite ımages using principal component analysis and k-means clustering, IEEE Geoscience and Remote Sensing Letters, 6(4), 772-776. Coppin P., Jonckheere I., Nackaerts K., Muys B., (2004), Digital change detection methods in ecosystem monitoring, Int. J. Remote Sensing, 25(9), 1565-1596. Eastman J.R. (2006), Idrisi Andes Tutorial. Education Tutorial, Worcester, USA: Cletc Labs, 284 ss. Firouzabadi P.Z. and Ghanavati E., (2007), Digital approaches for change detection in urban environment, Geographical Research, 22(1(84)), 133-146. Frate F.D., Schiavon G., Solimini C., (2004), Application of neural networks algorithms to Quickbird imagery for classification and change detection of urban areas, Proceedings of International Geoscience And Remote Sensing Symposium, Anchorage, Alaska, USA, pp. 1091-1094. F. Del Frate, G. Schiavon, C. Solimini, (2005), Use of high resolution satellite data for change detection in urban areas, Proceedings of ESA EUSC 2005 Conference, ESA/ESRIN, Frascati, Italy. Han, J., and Kamber, M., (2006), Data Mining: Concepts and Techniques, Morgan Kauffmann Publishers, San Francisco, USA. Herold M., (2007), Change detection and time series analysis, http://www.geoinformatie.nl/courses/grs20306/course/Schedule/lecture_herold _changedetection_time_series.pdf, (03 Jan 2013)
Muchoney, D.M., Haack, B.N., (1994), Change detection for monitoring forest defoliation, Photogrammetric Engineering and Remote Sensing, 60(10), 1243-1251. Munyati, C., (2004), Use of principal component analysis (pca) of remote sensing images in wetland change detection on the kafue flats, Zambia, Geocarto International, 19(3), 11-22. Pacifici F., Frate F.D., Solimini C., and Emery W., (2007), An innovative neural-net method to detect temporal changes in high-resolution optical satellite imagery, IEEE Trans. Geosci. Remote Sens., 45(9), 2940–2952. Ricotta C., Avena G. C. F. Volpe, (1999), The influence of principal component analysis on the spatial structure of multispectral dataset, International Journal for Remote Sensing Volume, 20(17), 3367-3376. Schiavon G., Frate F. Del, Solimini C., (2003), High resolution multi-spectral analysis of urban areas with QuickBird imagery and synergy with ERS data, Proceedings of the International Geoscience And Remote Sensing Symposium, Toulouse, France, 2003. Singh A., (1989), Digital change detection techniques using remotely-sensed data, Int. J. Remote Sensing, 10(6), 989-1003. Smith, L., (2002), A tutorial on Principal Components Analysis, Education Tutorial, Yıldız Technical University, 27pp. Sunar F., Çabuk A., Küpçü R., Tekgül A., Gazel S., Bektöre E., (2010), Remote Sensing, Anadolu University Press, Eskisehir, Turkey, pp. 250. URL-1: Official site of the governor of Kayseri, Geographic Structure of Kayseri, http://www.kayseri.gov.tr/default_b0.aspx?content=1024, (28 Aug. 2013). URL-2: Wikipedia web site, Principal component analysis, https://en.wikipedia.org/wiki/Principal_component_analysis, (10 July 2013).
James: Principal Component Analysis, (2007), http://freecourseware.uwc.ac.za/freecourseware/biodiversityconservation-biology/conservation-biology/james-principalcomponent-analysis, (04 May 2013) J. C. Dunn (1973): "A Fuzzy Relative of the ISODATA Process and Its Use in Detecting Compact Well-Separated Clusters", Journal of Cybernetics 3: 32-57 J. C. Bezdek (1981): "Pattern Recognition with Fuzzy Objective Function Algoritms", Plenum Press, New York, USA. Koç A., Çoban H.O., Yener H., (2005), Image differencing and image rationing methods in change detection, Istanbul University Journal of Forest Faculty - Series B, 56(1), 25-32.
This contribution has been peer-reviewed. doi:10.5194/isprsarchives-XL-7-W2-129-2013
132