Hindawi Mathematical Problems in Engineering Volume 2018, Article ID 7274141, 16 pages https://doi.org/10.1155/2018/7274141
Research Article Unsupervised Change Detection in Landsat Images with Atmospheric Artifacts: A Fuzzy Multiobjective Approach Huseyin Kusetogullari 1
1
and Amir Yavariabdi
2
Department of Computer Science and Engineering, Blekinge Institute of Technology, 371 41 Karlskrona, Sweden Department of Mechatronics Engineering, KTO Karatay University, Konya, Turkey
2
Correspondence should be addressed to Huseyin Kusetogullari;
[email protected] Received 18 November 2017; Revised 25 March 2018; Accepted 16 April 2018; Published 15 May 2018 Academic Editor: Konstantinos Karamanos Copyright © 2018 Huseyin Kusetogullari and Amir Yavariabdi. This is an open access article distributed under the Creative Commons Attribution License, which permits unrestricted use, distribution, and reproduction in any medium, provided the original work is properly cited. A new unsupervised approach based on a hybrid wavelet transform and Fuzzy Clustering Method (FCM) with Multiobjective Particle Swarm Optimization (MO-PSO) is proposed to obtain a binary change mask in Landsat images acquired with different atmospheric conditions. The proposed method uses the following steps: (1) preprocessing, (2) classification of preprocessed image, and (3) binary masks fusion. Firstly, a photometric invariant technique is used to transform the Landsat images from RGB to HSV colour space. A hybrid wavelet transform based on Stationary (SWT) and Discrete Wavelet (DWT) Transforms is applied to the hue channel of two Landsat satellite images to create subbands. After that, mean shift clustering method is applied to the subband difference images, computed using the absolute-valued difference technique, to smooth the difference images. Then, the proposed method optimizes iteratively two different fuzzy based objective functions using MO-PSO to evaluate changed and unchanged regions of the smoothed difference images separately. Finally, a fusion approach based on connected component with union technique is proposed to fuse two binary masks to estimate the final solution. Experimental results show the robustness of the proposed method to existence of haze and thin clouds as well as Gaussian noise in Landsat images.
1. Introduction Change detection is the process of identifying differences between multitemporal satellite images over time and it has been used in many important applications such as agriculture [1], geology [2], forestry [3], regional mapping and planning [4, 5], oil pollution monitoring [6], and surveillance [7]. In remote sensing context, many automatic change detection algorithms have been proposed to obtain changed and unchanged pixels between images. Amongst these methods, unsupervised approach has been widely and effectively used in change detection problem as it does not need any training data set and prior knowledge of images [8]. Comprehensive surveys of unsupervised change detection methods can be found in [9–11]. Landsat imagery is one of the most frequently used remote sensing techniques to observe and monitor Earth’s surface change due to its medium spatial resolution and frequency of data collections. In Landsat satellites, the images
are acquired using passive optical and multispectral sensors, so that this remote sensing technique is very sensitive to any meteorology conditions [12, 13]. Due to this drawback, atmospheric artifacts can be depicted in the Landsat images which makes the change detection problem very challenging. Generally, in the literature, to find changed and unchanged pixels in medium resolution Landsat images, pixel-based change detection approach has been used and it mostly consists of two phases [14, 15]: (1) Difference image estimation, where it is computed by comparing two images through a similarity metric method such as: image subtraction [14, 16], Change Vector Analysis (CVA) [15, 17], Correlation Coefficient (CC) [18], and Erreur Relative Globale Adimensionnelle de Synthese (ERGAS) [19]. (2) Image analysis, which aims at obtaining binary change mask using clustering [14, 20, 21], Level set [17], population-based optimization [16, 18, 22], OTSU and Bayesian thresholding [19, 23], and many others [6, 24–26]. Pixel-based unsupervised change detection methods have been applied into two different satellite image domains which
2 are spatial domain and frequency domain. In Landsat change detection context, most of the existing methods are based on the spatial domain. For instance, Celik [14] proposes an unsupervised change detection technique for grayscale Landsat images. In this method, firstly, image subtraction is used to estimate similarity between two images. However, this technique is sensitive to noise and atmospheric condition changes so that it cannot be used on the raw images without any adjustment or modification. In [14], to improve the robustness of the change detection method against noise, Principle Component Analysis (PCA) is used to find the statistical properties of the difference image. Finally, 𝑘-means clustering approach is applied to the PCA feature vectors to obtain change detection mask. Hao et al. [17] propose a change detection approach based on Expectation Maximization (EM) and level set methods. In this method, a difference image is initially generated using the CVA and is modeled using Gaussian Mixture Models (GMMs). The EM algorithm is employed to estimate the parameters of the statistical model. Then, an energy functional based on changed and unchanged areas in the difference image is defined and optimized using a level set method. However, in Landsat change detection problem, this method may provide high error detection rates as the CVA is highly dependent on a radiometric correction technique [29]. Moreover, other unsupervised methods such as fuzzy 𝑐-means [21], normalised cut clustering [20], and fuzzy active contour model [24] have also been applied to Landsat images to find binary change mask. However, these methods only find the significant changes between two input images and have lack of adaptability and flexibility to obtain weak changes. Therefore, optimizationbased change detection methods are proposed to find optimal binary change mask by obtaining both weak and strong changes on the difference image. For instance, Celik [22] uses Genetic Algorithm (GA) to cluster changed and unchanged pixels between two grayscale satellite images by minimizing a cost function based on the difference image computed using the image subtraction technique. Kusetogullari et al. [16] propose a parallel processing unsupervised change detection approach which simultaneously employed several Particle Swarm Optimizations (PSOs). This method is applied to the difference of three channels of RGB colour intensities to determine the optimal change detection mask. Most of the existing optimization-based change detection methods have two main drawbacks. (1) Optimization is performed on the raw difference images which increases computational cost to converge to the solution. (2) A cost function based on a weighted sum of the changed and unchanged objectives is used which may not provide optimal trade-off between changed and unchanged objective functions. In other words, these methods can easily get stuck in a local minimum due to those two issues. Yavariabdi and Kusetogullari [30] proposed a multiobjective change detection method to obtain changed and unchanged pixels between two multitemporal multispectral Landsat images using multiobjective evolutionary algorithm (MOEA). The method minimizes two different objective functions which are not fuzzy using NSGA-II (Nondominated Sorting Genetic Algorithm II) and provides trade-off
Mathematical Problems in Engineering between the objective functions. Besides this, SSIM technique has been used to obtain the difference image which is optimized by creating and evolving binary change detection maps or possible solutions using NSGA-II. The results show the effectiveness of the NSGA-II over the existing change detection methods. However, the method has been performed in the spatial domain which is not robust to the noise on the satellite images. In this paper, a novel change detection method using Multiobjective Particle Swarm Optimization (MO-PSO) has been proposed which has been applied to the high and low frequency levels (subbands) of the two satellite images obtained using hybrid wavelet transform. Thus, the proposed approach is more robust to the noise. Another issue in [30] is that NSGA-II uses evolutionary techniques (crossover, mutation, selection, etc.) to find the most optimum result. Using a number of evolutionary techniques increases the computational time to achieve the best result but the proposed method MO-PSO is a computational based approach which achieves the results quicker and more efficiently. Furthermore, we develop fuzzy based objective functions in this paper. Although unsupervised change detection methods are mostly performed in the spatial domain, it can also be carried out using the frequency representation of the Landsat images [23, 25, 31]. For instance, Chen and Cao [25] propose an unsupervised change detection method based on the SWT and active contours algorithms which are robust to noise. Celik and Ma [23] propose a frequency-based change detection method for noisy grayscale Landsat images using the dual-tree complex wavelet transform and Bayesian thresholding approach. In this method, image subtraction is used to estimate similarity between corresponding highpass subbands. Next, the Bayesian thresholding method is used to find binary masks. Finally, a fusion based approach, which is the union of all the binary masks, is used to obtain the final result. However, this method suffers from two main problems: (1) neglecting the low-pass subband images which causes the removal of many details from images and (2) using simple fusion technique which can easily lead to high false alarm rate. In most of the state-of-the-art methods, the effects of atmospheric artifacts on change detection problem are neglected as they assume that the Landsat images are radiometrically corrected. However, this is an important issue as variations of atmospheric conditions (i.e., existence of haze, fog, smoke, or thin cloud) in images can change the contrast and fade the colours in the image. Therefore, most of the existing change detection methods cannot be applied into the Landsat images which are captured with various atmospheric conditions as they can wrongly detect those artifacts as changed area(s). In this paper, we propose a new unsupervised change detection method which is robust to the varying atmospheric conditions in Landsat images. To achieve this, the proposed method uses a photometric invariant technique along with a hybrid wavelet transform and a density-based clustering (mean shift algorithm) to decrease the effect of atmospheric artifacts in the input images and then two cost functions based on image subtraction are generated and simultaneously minimized using
Mathematical Problems in Engineering
(a)
3
(b)
(c)
(d)
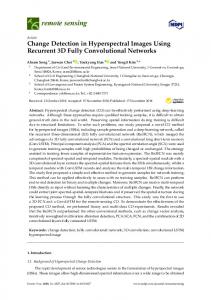
Figure 1: Influence of an atmospheric correction technique on change detection. (a) The first image with existence of haze and clouds. (b) The result of the atmospheric correction method [28]. (c) The second Landsat image. (d) The result of PCA-𝑘-means method [14].
a multiobjective population-based optimization. The method first uses a photometric invariant technique to convert RGB satellite images into the HSV colour space. Note that, only hue channel of Landsat images are used as they are invariant under both shadow and shading (i.e., illumination intensity changes) as well as highlights and specularities. Next, a hybrid wavelet method based on the SWT and the DWT is applied to the hue channel of the images, separately. Thus, for each satellite image, there will be eight subband images, four of which are obtained using the DWT and the rest using the SWT. Here, the LL (Low-Low subband) and HH (HighHigh subband) subbands of the DWT and the SWT of each Landsat image are only used for further processing. After that the mean shift clustering method is applied to the difference subband images obtained using the image subtraction technique to decrease the intensity variations in the images and preserve the high frequencies. This simply decreases the computational cost and improves the convergence rate of the population-based optimization algorithm which are the two main issues of the most conventional optimizationbased change detection methods (e.g., [16, 18, 22]). In the next step, for each smoothed difference subband image, two cost functions based on FCM are generated and optimized using MO-PSO. Here, two sets of change detection masks with different trade-off relationships between the costs are obtained and the median of each set is selected to obtain two binary change masks. Finally, in order to obtain the final binary change detection mask, a fusion method based on a connected component with union technique is used. The main contributions of the paper are summarized as follows: (i) Proposing a new frequency-based unsupervised change detection method for Landsat images which are captured with various atmospheric conditions. (ii) Combining a photometric invariant technique with wavelet transforms to decrease the influence of atmospheric conditions on the change detection results. (iii) Presenting two fitness cost functions based on FCM which are robust to noise, haze, and thin cloud(s) and being used in the MO-PSO. (iv) Presenting a new procedure that focuses on decreasing the computational cost of the population-based optimization algorithms and improving their convergence rate.
The rest of the paper is organized as follows. Section 2 proposes our new change detection approach. Section 3 provides the results of our experiments and a discussion related to the quantitative and qualitative change detection results. Lastly, in Section 4, the paper is concluded.
2. Proposed Method Generally, unsupervised change detection methods have been applied to the Landsat change detection problem with the following assumptions: (1) the data must be captured at anniversary dates, which greatly minimizes the effects of seasonal changes (i.e., leads to illumination variations) and (2) the data must be clear from clouds, haze, smoke, and extreme humidity as they introduce erroneous results to the change detection process. Therefore, in Landsat change detection problem, existence of such artifacts continues to be a major challenge. Note that, in this paper, we assume that the data sets are not captured at anniversary dates and may include thin cloud(s). One way to remove the effects of those artifacts is to use atmospheric correction and cloud removal algorithms [28, 32]. However, this strategy does not seem to remarkably benefit the change detection methods, and in some cases it even degraded accuracies. For instance, Figure 1 shows the influence of an atmospheric correction algorithm [28] on a change detection method. It is clear that this strategy partially removes the cloud from the image (Figure 1(a)), but it fades the colours in the image (Figure 1(b)). Figure 1(d) demonstrates that the change detection method [14] using Figures 1(b) and 1(c) incorrectly detects many unchanged pixels as changed pixels (red pixels). In order to solve this problem, we propose a new change detection method which is robust to variations of atmospheric conditions. 2.1. Preprocessing. In the proposed method, three preprocessing approaches as shown in the first part of the block diagram in Figure 2 are applied to the coregistered Landsat images acquired from the same geographical area, but at two different time instances. In order to obtain the best change detection mask for the various atmospheric conditions, the following procedure has been used. Firstly, a photometric invariants technique is applied. Here, the strategy for using the photometric invariants is to convert RGB colour space into HSV colour space, which is obtained via conical transform. In this space, each colour represents as hue, saturation, and value.
4
Mathematical Problems in Engineering
Note that, most of the existing change detection methods use the grayscale or RGB colour images to find the change detection mask so that they cannot overcome the typical atmospheric artifacts occurring during Landsat acquisitions. Secondly, the hue channels of two images are transformed into the frequency domain using the SWT and the DWT, which makes the proposed method (1) robust to noise; (2) robust to global illumination variations; and (3) insensitive to existence of haze and thin clouds and (4) increase the accuracy of detection near boundaries as it is not based on spatially local image luminance differences. Finally, absolutevalued difference technique is used to find the differences between LL and HH subbands. 2.1.1. Colour Space Transformation. Many photometric invariants such as normalised RGB, HSI, HSV, 𝑟𝜙𝜃, and derivatives of the logarithmized colour channels have been proposed in literature [33]. In general, the HSV colour
transformation proves to be insensitive to shadow, shading, and specular edges [33] and has been used in different applications such as object segmentation [34], detection [35], tracking [36], and recognition in the images [37]. More details about HSV colour transformation can be found in [38]. In this colour space, the hue (𝐻) resembles the pure colour, the saturation (𝑆) shows the amount of gray in the colour, and the value (𝑉) describes the brightness. In other words, the hue channel allows coping with shadow, shading, highlights, and specularities, the saturation channel is only invariant under shadow and shading, and the value channel cannot cope with any of these artifacts. Therefore, the hue channel is used in the proposed method. Let 𝑋1𝑛 and 𝑋2𝑛 be two Landsat images with size of ℎ × 𝑤 pixels, where ℎ and 𝑤 are height and width of images, respectively. They consist of three spectral bands (𝑛), i.e., 𝑅, 𝐺, and 𝐵, which are used to obtain the hue channel (𝐻) as follows:
𝑋𝑖2 − 𝑋𝑖3 { × 60∘ { { { max (𝑋𝑖1 , 𝑋𝑖2 , 𝑋𝑖3 ) − min (𝑋𝑖1 , 𝑋𝑖2 , 𝑋𝑖3 ) { { { { 𝑋𝑖3 − 𝑋𝑖1 𝐻𝑖 = {2 + × 60∘ 3 1 2 1 , 𝑋2 , 𝑋3 ) { max (𝑋 , 𝑋 , 𝑋 ) − min (𝑋 { 𝑖 𝑖 𝑖 𝑖 𝑖 𝑖 { { { 𝑋𝑖1 − 𝑋𝑖2 { {4 + × 60∘ max (𝑋𝑖1 , 𝑋𝑖2 , 𝑋𝑖3 ) − min (𝑋𝑖1 , 𝑋𝑖2 , 𝑋𝑖3 ) {
where 𝑖 = {1, 2} denotes the corresponding Landsat image. 2.1.2. Hybrid Wavelet Transform. A wavelet transform method decomposes an image into images or subbands which cover the frequency components or coefficients of the original image. Besides this, each obtained subband contains different details of information of the original image. For instance, the subband HH holds the detailed information (e.g., edges) and LL holds the most of the information of the image. In the change detection problem, unsupervised change detection methods can find the changed and unchanged pixels as well as undesired artifacts using the LL subband since it covers the most of the information of the image. In the corresponding problem, the challenging tasks are to detect the changed and unchanged pixels in the subbands and ignore both the noise and effect of the atmospheric variations (e.g., haze or thin cloud) on Landsat images. In order to find a better change detection result, a hybrid wavelet transform based on the DWT and the SWT is applied to the hue channel 𝐻𝑖 of input images 𝑋𝑖 . Let the DWT and SWT decompose an image 𝐻𝑖 into low and high frequency subband images, respectively. In this case, four subbands are obtained using the DWT (𝐷LL,𝑖 , 𝐷HL,𝑖 , 𝐷LH,𝑖 , and 𝐷HH,𝑖 ) and four subbands are computed using the SWT (𝑆LL,𝑖 , 𝑆HL,𝑖 , 𝑆LH,𝑖 , and 𝑆HH,𝑖 ). Note that, in the proposed method, only the LL and HH subbands (𝐷LL,𝑖 , 𝐷HH,𝑖 , 𝑆LL,𝑖 , and 𝑆HH,𝑖 ) are used. Besides this, we empirically found out that the binary masks of LH and HL intersect with the binary mask of LL subband and they include many isolated pixels (noise) in
𝑋𝑖1 ≥ 𝑋𝑖2 , 𝑋𝑖3 𝑋𝑖2 ≥ 𝑋𝑖1 , 𝑋𝑖3
(1)
𝑋𝑖3 ≥ 𝑋𝑖1 , 𝑋𝑖2 ,
nonintersection areas so that these subbands have not been used for further processing. Unlike the SWT, the DWT uses downsampling to create the subband images; thus it is necessary to make the size of the selected subbands equal. To this end, the 𝐷LL,𝑖 and 𝐷HH,𝑖 subband images are interpolated using bicubic interpolation. Then, in order to strengthen the coefficients in the subband images which results in improving the image details, the 𝑗 mean of the subband coefficients (𝑍𝑖 ), where 𝑗 denotes LL and HH, is used. Finally, the absolute-valued subtraction method is used to find two difference images. 𝑗 𝑗 (2) 𝑌𝑗 = 𝑍2 − 𝑍1 2.2. Mean Shift Clustering. Generally, conventional unsupervised change detection methods use the natural difference image, which contains trivial details, to cluster pixels as changed and unchanged. The clustering techniques such as 𝑘-means [14], EM-GMM [17], and fuzzy 𝑐-means [21] used in change detection problem suffer from the following limitations, especially when the difference image contains trivial details: (1) the spatial structure and edge information of the difference image cannot be preserved and (2) pixels from disconnected regions of the difference image are grouped together if their feature space overlap. These limitations simply lead to low correct detection rates. To avoid these difficulties in the change detection problem, an edge preserving smoothing technique which aims to remove the trivial details while preserving major difference image
Mathematical Problems in Engineering
5 X1
X2
Photometric invariant technique
Photometric invariant technique
Preprocessing
X1(O? DWT decomposition 1 1 1 1 DLL DHL DLH D((
X2(O? DWT decomposition
SWT decomposition 1 1 1 1 SLL SLH S(L S((
Image resizing (upsampling by 2)
2 2 2 2 DLL DLH DHL D((
SWT decomposition 2 2 2 2 SLH SLL S(L S((
Image resizing (upsampling by 2)
Combining sub-bands
Combining sub-bands
Absolute-valued subband difference Y(( Y,, Postprocessing
Mean Shift Clustering B,,
B((
Fuzzy MO-PSO b,, b(( Fusion Method
Binary Mask Estimation
Final Change Detection Mask
Figure 2: Block diagram of the proposed method.
structures must be used. To achieve this, mean shift algorithm is used as discontinuity preserving filtering on the difference subband images (see the second part of the block diagram in Figure 2). Mean shift is a nonparametric clustering algorithm, which is based on maxima of densities functions and has been applied to edge preserving smoothing, image segmentation, and tracking problems [39]. In contrast to the other clustering techniques, mean shift clustering does not have embedded assumptions on the shape of the distribution and does not require the number of clusters. In this algorithm, a fixed size Parzen window is iteratively shifted to the closest stationary point along the gradient direction of the estimated density function. In the change detection process, each difference image pixel is changed by the mode of its intensity neighbours’ values computed in the natural difference image. Consequently, this approach can significantly reduce the intensity variations while preserving salient features of overall difference image. For ℓ1 × ℓ2 sample pixels 𝑌𝑗 (𝑥, 𝑦), 𝑦 = 1, . . . , ℓ1 , and 𝑥 = 1, . . . , ℓ2 , the mean shift vector is estimated as follows: ℓ
𝑗
𝑀ℏ (𝑐 ) =
ℓ
1 2 𝑌𝑗 (𝑥, 𝑦) 𝐺 ((𝑐𝑗 − 𝑌𝑗 (𝑥, 𝑦)) /ℏ) ∑𝑥=1 ∑𝑦=1
ℓ
ℓ
1 2 𝐺 ((𝑐𝑗 − 𝑌𝑗 (𝑥, 𝑦)) /ℏ) ∑𝑦=1 ∑𝑥=1 ⏟⏟⏟⏟⏟⏟⏟⏟⏟⏟⏟⏟⏟⏟⏟⏟⏟⏟⏟⏟⏟⏟⏟⏟⏟⏟⏟⏟⏟⏟⏟⏟⏟⏟⏟⏟⏟⏟⏟⏟⏟⏟⏟⏟⏟⏟⏟⏟⏟⏟⏟⏟⏟⏟⏟⏟⏟⏟⏟⏟⏟⏟⏟⏟⏟⏟⏟⏟⏟⏟⏟⏟⏟⏟⏟⏟⏟⏟⏟⏟⏟⏟⏟ (3)
𝑚(𝑐𝑗 )
− 𝑐𝑗 ,
where 𝑐𝑗 is the center of the kernel for each subband and starts at an arbitrary value, 𝑚(𝑐𝑗 ) is the densities estimation of sample pixels in the neighbourhood of 𝑐𝑗 , ℓ1 = 5 and ℓ2 = 5 are the height and width of the kernel, respectively, ℏ > 0 is the bandwidth parameter, and 𝐺(𝑟) = exp(−(1/2)𝑟) denotes Gaussian kernel function. More specifically, the weighted function 𝐺(𝑟) adjusts the influence of each intensity value inside Parzen window according to its distance from 𝑐𝑗 . Note that (3) is optimized using gradient ascent technique, so that at each iteration 𝑐𝑗 is updated to 𝑚(𝑐𝑗 ) until ‖𝑀ℏ (𝑐𝑗 )‖ < 𝜖, where 𝜖 is a prespecified convergence threshold set to 𝜖 = 10−5 in our experiments. Note that the stationary points obtained via gradient ascent represent the modes of the density functions. All the pixel values associated with the same stationary point (𝑀ℏ ) belong to the same cluster which leads to a filtered image denoted as 𝑀. In the proposed method, the mean shift approach has been applied to two different subband images and, thus, two smooth difference subband images are obtained. Unlike the other conventional change detection methods, the generation of binary change mask is not based on the pixels of the original difference image but on the results of mean shift algorithm. Combining mean shift algorithm with fuzzy-𝐶 means clustering and Multiobjective Particle Swarm Optimization may bring several advantages. One advantage is that the mean shift algorithm significantly reduces the noise and the amount
6
Mathematical Problems in Engineering
of smoothing for the abrupt changes in the edges as well as preservingthe salient features of the overall image. A second advantage is that since the number of basic image entities is much smaller than the original image, the computational complexity is considerably reduced. The next stage of the proposed approach is the generation of two clusters by clustering the feature vector space using the Multiobjective Particle Swarm Optimization algorithm. 2.3. Fuzzy Based Multiobjective Particle Swarm Optimization. Change detection problem is an optimization problem and it has more than one objective function such as changed objective function and unchanged objective function. A multiobjective optimization problem can be formulated as follows: min 𝐹 (𝑥) = [𝑓1 (𝑥) 𝑓2 (𝑥) ⋅ ⋅ ⋅ 𝑓𝑛 (𝑥)] ,
(4)
where 𝑥 = (𝑥1 , 𝑥2 , 𝑥3 , . . . , 𝑥𝑚 ) is the vector of decision variables and 𝑓𝑖 (𝑥) (𝑖 = 1, . . . , 𝑛) denotes the 𝑖th objective to be minimized in the multiobjective optimization problem. In most of the existing change detection algorithms, these objective functions are combined to be used as a single optimization function. Thus, the single-objective function can be used in Genetic Algorithm or Particle Swarm Optimization methods. This solution strategy may bring several issues: (1) improvement of one objective since it may cause deterioration for the other objective when the optimization method performs obtaining the global optimum result; (2) getting stuck with a local optimum result easily; (3) only one optimum result (e.g., local or global) being obtained at the end of the iteration. Therefore, using weighted sum of the objective functions is not an efficient approach to solve an optimization problem. Unlike the single-objective optimization solution approach, multioptimization solution approach provides nondominated solutions known as Pareto optimal solutions [27, 40, 41]. Therefore, multiobjective optimization algorithms are used to (1) discover solutions as approximated to the optimal solutions as possible; (2) find solutions as uniform as possible in the obtained nondominated front; (3) determine solutions to cover the true Pareto Front (PF) as broad as possible. In order to achieve these three challenges, it is necessary to provide the best trade-off solutions or Pareto optimal solutions between the objectives. Pareto solution is defined as follows [27, 41]: 𝑛
Definition 1. Given two vectors 𝑎, 𝑏 ∈ R , we say that 𝑎 dominates 𝑏 (denoted by 𝑎 ≺ 𝑏) if 𝑎𝑖 ≤ 𝑏𝑖 for 𝑖 = 1, . . . , 𝑛. Definition 2. We say that two vectors 𝑎 and 𝑏 are nondominated if the value at position 𝑗 in the vector 𝑎 is greater than the value at position 𝑗 of vector 𝑏 𝑎𝑗 ≥ 𝑏𝑗 for 𝑗 = 1, . . . , 𝑛. Definition 3. Vector 𝑎 is Pareto optimal solution if it is nondominated. Multiobjective algorithms have been used and developed to resolve different optimization problems and they perform superiorly to resolve the multiobjective problems compared to the single optimization algorithms [27, 40, 41]. In this
paper, a new unsupervised Fuzzy Multiobjective Particle Swarm Optimization (Fuzzy MO-PSO) has been used to resolve the change detection problem. The pseudocode of Fuzzy MO-PSO is given in Algorithm 1. First, the positions of particles, 𝑝𝑘 , are initialized with binary values with the size of Landsat images 𝐻 × W, where 𝐻 is the height and 𝑊 is the width of the image. In the algorithm, 𝑝𝑘 is the position of 𝑘th particle, and velocities of particles, V𝑘 , are set as 0s, where V𝑘 is the velocity of 𝑘th particle. It is important to note that particles move or change positions to obtain the global optimum result based on the 𝑘 𝑘 and 𝑓2,𝑙𝑏𝑒𝑠𝑡 , and the overall particle’s own best results, 𝑓1,𝑙𝑏𝑒𝑠𝑡 𝑘 𝑘 and 𝑓2,𝑔𝑏𝑒𝑠𝑡 , so far. The best results of all particles, 𝑓1,𝑔𝑏𝑒𝑠𝑡 particle’s own best results and the overall best results of all particles are updated in each iteration using the step numbers from (8) to (22) in Algorithm 1. Unlike the traditional PSO approach which is used in a single optimization problem [42], two different fitness values are obtained in the multiobjective problem. Therefore, there will be two best results for each 𝑘 𝑘 and 𝑓2,𝑙𝑏𝑒𝑠𝑡 , and two overall best results of all particle, 𝑓1,𝑙𝑏𝑒𝑠𝑡 𝑘 𝑘 , with respect to fitness functions particles, 𝑓1,𝑔𝑏𝑒𝑠𝑡 and 𝑓2,𝑔𝑏𝑒𝑠𝑡 1 and 2. The algorithm works by updating the positions of particles after applying (5) and (6), respectively. Then, the position values are used in (7) to create the binary change detection masks. Obtained updated particles are added in the new population 𝑄. Then, both the current 𝑃 and the new population 𝑄 are joined; the resulting population, 𝑅, is ordered according to Pareto solutions of particles by using ranking operator and a density estimator known as crowding distance [27]. Thus, nondominated and dominated solutions are evaluated and the nondominated set of solutions are inserted into the population 𝑃. These steps are repeated until the termination condition is fulfilled. The position and velocity of 𝑘th particle are estimated as follows: 1 2 V𝑘 (𝑡 + 1) = 𝜔V𝑘 (𝑡) + ∑ (𝑐1 𝑟1 (𝑝𝑖,𝑙𝑏𝑒𝑠𝑡 (𝑡)𝑘 − 𝑝𝑖𝑘 (𝑡)) 2 𝑖=1 + 𝑐2 𝑟2 (𝑝𝑔𝑏𝑒𝑠𝑡 (𝑡) −
𝑝𝑖𝑘
(5)
(𝑡)))
𝑝𝑘 (𝑡 + 1) = 𝑝𝑘 (𝑡) + V𝑘 (𝑡 + 1) ,
(6)
where 𝜔 is an inertia coefficient; 𝑐1 and 𝑐2 are the weights of learning rate of a local optimum and learning rate of a global optimum, respectively; 𝑟1 and 𝑟2 are random parameters ranging from [0, 1]. The position values are used in the following equation to create the binary change detection masks. {0, 𝑏 ={ {1, 𝑘
1 < 0.5. 1 − exp (−𝑝𝑘 ) otherwise.
if
(7)
The purpose of the proposed method is to determine the set of Pareto optimal solutions. Each particle in each iteration contains two different fitness values. To solve the multiobjective change detection problem using the Fuzzy MO-PSO, it is necessary to estimate fitness values of each
Mathematical Problems in Engineering
7
(1) Initialize the positions of particles with randomly generated binary values, and set velocities of particles to 0, the generation number 𝑔 = 0, population size 𝐾. (2) 𝑃 ← initialized Binary Population Set (3) 𝑄 ← 0 (4) while Stopping criteria is not reached do (5) For each particle 𝑘 in 𝑃 do (6) Compute the fuzziness fitness functions 𝑓1𝑘 and 𝑓2𝑘 using the binary valued positions. (7) end for 𝑘 𝑘 (8) Compare the particle’s current finesses 𝑓1𝑘 and 𝑓2𝑘 with particle’s best 𝑓1,𝑙𝑏𝑒𝑠𝑡 and 𝑓2,𝑙𝑏𝑒𝑠𝑡 . 𝑘 𝑘 (9) if 𝑓1 < 𝑓1,𝑙𝑏𝑒𝑠𝑡 then 𝑘 = 𝑓1𝑘 (10) 𝑓1,𝑙𝑏𝑒𝑠𝑡 (11) end if 𝑘 then (12) if 𝑓2𝑘 < 𝑓2,𝑙𝑏𝑒𝑠𝑡 𝑘 (13) 𝑓2,𝑙𝑏𝑒𝑠𝑡 = 𝑓2𝑘 (14) end if 𝑘 . (15) Compare the global best fitness value 𝑓1,𝑔𝑏𝑒𝑠𝑡 with the population’s overall best values for the first fitness function, 𝑓1,𝑏𝑒𝑠𝑡 𝑘 (16) if 𝑓1,𝑙𝑏𝑒𝑠𝑡 < 𝑓1,𝑔𝑏𝑒𝑠𝑡 then (17) 𝑓1,𝑔𝑏𝑒𝑠𝑡 = 𝑓1,𝑙𝑏𝑒𝑠𝑡 (18) end if 𝑘 . (19) Compare the global best fitness value 𝑓2,𝑔𝑏𝑒𝑠𝑡 with the population’s overall best values for the second fitness function, 𝑓2,𝑏𝑒𝑠𝑡 𝑘 (20) if 𝑓2,𝑙𝑏𝑒𝑠𝑡 < 𝑓2,𝑔𝑏𝑒𝑠𝑡 then (21) 𝑓2,𝑔𝑏𝑒𝑠𝑡 = 𝑓2,𝑙𝑏𝑒𝑠𝑡 (22) end if (23) Update the velocities of particles using Eq. (5) (24) Update the positions of particles using Eq. (6) (25) Insert the updated particles into the 𝑄 (26) Create the binary change-detection mask using Eq. (7) (27) 𝑅←𝑃∪𝑄 (28) Use the Ranking and crowding distance operator [27] (29) Select Pareto solutions or non-dominated solutions (30) Insert selected Pareto solutions into the 𝑃 (31) 𝑔=𝑔+1 (32) end while (33) Output1: Set of Pareto optimal solutions (34) Output2: Set of Binary change detection masks Algorithm 1: Pseudocode of the Fuzzy MO-PSO algorithm for solving the change detection problem.
particle. To achieve this, two objective functions are used to estimate fitness values of the particles and these objective functions are formulated as follows:
2/(𝑚−1)
𝑗 𝜇𝑖
(𝑥, 𝑦) =
∑1𝜔=0 (𝑀𝑗 (𝑥, 𝑦) − 𝐶𝜔𝑗 )
𝑗 2/(𝑚−1)
(𝑀𝑗 (𝑥, 𝑦) − 𝐶𝑖 )
(9)
𝑗
𝑗
𝑓𝑖 =
𝑁𝑖 𝑊 𝐻 𝑗 𝑚 𝑗 𝑗 2 ∑ ∑ 𝜇𝑖 (𝑥, 𝑦) (𝑀 ℏ (𝑥, 𝑦) − 𝐶𝑖 ) ⏟⏟⏟⏟⏟⏟⏟⏟⏟⏟⏟⏟⏟⏟⏟⏟⏟⏟⏟⏟⏟⏟⏟⏟⏟⏟⏟⏟⏟⏟⏟⏟⏟ 𝐻 × 𝑊 𝑥=1 𝑦=1 𝑗
(8)
𝑗
𝑑(𝑀ℏ (𝑥,𝑦),𝐶𝑖 ) 𝑗
where 𝑚 is the degree of fuzziness (𝑚 ≤ 1), 𝜇𝑖 is the degree 𝑗 𝑗 of membership of 𝑀ℏ (𝑥, 𝑦) in the cluster 𝑖, 𝐶𝑖 is the center 𝑗 𝑗 𝑗 of the cluster 𝑖 in 𝑀ℏ , and 𝑑(𝑀ℏ (𝑥, 𝑦), 𝐶𝑖 ) is the distance measurement which estimates the square error between the 𝑗 intensity value of the 𝑀ℏ at the pixel (𝑥, 𝑦) and the cluster 𝑗 center 𝐶𝑖 . Fuzzy partitioning is carried out through MO-PSO of the objective functions shown in (4), with the update of 𝑗 𝑗 membership 𝜇𝑖 (𝑥, 𝑦) and the cluster centers 𝐶𝑖 by 𝑗
𝐶𝑖 =
𝑚
𝑗
𝐻 𝑗 ∑𝑊 𝑥=1 ∑𝑦=1 𝜇𝑖 (𝑥, 𝑦) 𝑀 (𝑥, 𝑦) 𝑗
𝑚
𝐻 ∑𝑊 𝑥=1 ∑𝑦=1 𝜇𝑖 (𝑥, 𝑦)
𝑗
𝑗
This iteration will stop when ‖𝜇𝑡+1 − 𝜇𝑡 ‖22 < 𝜖, where 𝜖 is a termination criterion, 𝑡 is the iteration number, and ‖ ⋅ ‖2 denotes the ℓ2 -norm distance. The proposed Fuzzy MO-PSO algorithm provides a set of Pareto optimal solutions and change detection masks so that it is necessary to select the most optimal solution amongst all the obtained solutions. It is worth noting that both objectives (e.g., changed and unchanged) are equally important to find the most optimum solution. Let 𝑊 be the number of Pareto optimal solutions and all of them are first ranked based on their priority level. For instance, the first ranked solution is the best result for the unchanged fitness function and the last ranked optimum result is the best result for the changed fitness function. Therefore, the medium optimal solution of overall Pareto solutions is selected as a trade-off solution in
8 the proposed approach. In this case, the medium solution is at 𝑊/2 if the 𝑊 is even number or at (𝑊 + 1)/2 if the 𝑊 is an odd number. The Fuzzy MO-PSO algorithm has been applied to two different subband images; then the proposed algorithm generates two different binary masks. 2.4. Fusion Method. In the change detection literature, there are several approaches to fuse multiple binary images to obtain the final change detection mask. For instance, Celik and Ma [23] used union based fusion approach to combine different binary subband images. However, using this approach will increase the error detection rates. In [43], MRF based approach is used to combine two binary image maps but this technique is not suitable in our case as the binary masks should be equivalent to using this method. In this paper, we propose a new fusion approach based on connected component and union techniques to fuse the LL and the HH binary masks for final binary mask estimation. To achieve this, the connected component technique based on 4-neighbour connectivity is first used to remove isolated pixels from the HH subband binary mask. More specifically, each changed pixel in the binary mask is compared with its two vertical and two horizontal neighbouring pixels. If any of these neighbouring pixels is flagged as changed (foreground) then the pixel remains as changed; otherwise the pixel is flagged as unchanged pixel (background). Note that noises are generally considered as high frequency components and appear in HH subband binary mask. Therefore, the connected component strategy is only applied to the HH subband binary mask. Finally, the union operator is applied to fuse the obtained HH and the LL subband binary masks in order to generate the final result.
3. Results and Discussion 3.1. Data Sets. In order to quantitatively and qualitatively understand and analyze the effectiveness and robustness of the proposed method, various semisynthetic images and two real multitemporal medium resolution Landsat data sets are used. The first data set belongs to the surface of the Lake Milh in Iraq and the second data set corresponds to the surface of the Caspian sea in Kazakhstan. Both data sets are provided by United States Geological Survey (USGS) [44, 45]. It is worth noting that the ground truth change masks for both data sets are not available. Therefore, for the first data set, the ground truth is generated by visual inspection and manual labelling and for the second data set, a region of interest which includes different atmospheric conditions but not land cover changes is considered to generate a ground truth. Even though the ground truth in the second data set does not reveal the exact differences between two Landsat images, one can use it to analyze sensitivity of the change detection methods with existence of atmospheric artifacts. In addition, we evaluate the change detection methods with quantitative and qualitative measurements on two different sets of semisynthetic images, generated using Lake Milh (Figure 3(a)). The first set of semisynthetic images are obtained by artificially inserting haze and different shapes and levels of thin cloud(s) into the various regions in Figure 3(a) (see Figure 5). The experiments
Mathematical Problems in Engineering in these data sets can reveal the accuracy of the change detection methods in different atmospheric conditions. To make the problem more challenging, the second set of semisynthetic images are generated by inserting nine different Gaussian noise levels into Figure 5(b) (for instance, see Figure 8(d)). The experiments on semisynthetic images imitate realistic Landsat satellite acquisition situations and clearly show the pros and cons of the change detection methods. The first Landsat data set [44] is with 1984 × 1451 pixels and shows the water surface of the Lake Milh. The images are acquired on July 16, 1995 (Figure 3(a)), and May 11, 2003 (Figure 3(b)), by the Landsat Multispectral scanner to evaluate the changes in the lake. The ground truth change detection mask for the whole area of the lake is shown in Figure 3(c). The second Landsat data set [45] is with 541×335 pixels and illustrates the north east area of the Caspian sea in 2009 (Figure 3(d)) and 2012 (Figure 3(e)) with existence of thin cloud. In this data set, the region of interest which is shown with blue rectangle is considered for quantitative evaluations. Moreover, the ground truth change mask for the region of interest (blue rectangular area) only includes unchanged pixels as there is not any land cover changes in the region of interest (see Figure 3(f)). 3.2. Quantitative Error Measurements. For quantitative comparison purposes, three standard measurements including false alarm rate (𝑃FA ), missed detection rate (𝑃MD ), and total error (𝑃TE ) [14] are used. The false alarm rate can be defined as the number of true unchanged pixels that were mistakenly chosen as changed pixels. This error measurement can be estimated in percentage as 𝑃FA = FA/𝑁0 × 100, where 𝑁0 is the overall number of unchanged pixels in the ground truth mask. The missed detection rate can be described as the number of true changed pixels that were erroneously selected as unchanged pixels. This error measurement can be calculated in percentage as 𝑃MD = MD/𝑁1 ×100, where 𝑁1 is the overall number of changed pixels in the ground truth mask. The third measurement is based on the total error which can be defined as the total of false alarm and the missed detection rates. The total error in percentage can be manipulated as 𝑃TE = (FA + MD)/(𝑁0+𝑁1)×100. Note that these three quantitative error measurements are used for the first real Landsat and semisynthetic data sets whereas only 𝑃FA is used for the second real Landsat data set as there is no land cover changes in the region of interest (region of interest in Figures 3(d) and 3(e)). 3.3. Change Detection Methods. The proposed change detection method is compared with one frequency domain and three spatial domain based change detection methods which are: DT-CWT-based [23], PCA-𝑘 means-based [14], ERGASbased [19], and PSO-GA-based [18]. The first method is the DT-CWT-based [23] change detection method; it is applied into the frequency domain which uses three levels of image decomposition for generating subband images and then, the EM algorithm is used to find the binary mask. Note that, it is not necessary to set any parameters for the EM algorithm and the same number of decomposition level preferred in [23] is used. The PCA-𝑘 means-based method has two different parameters which are nonoverlapping blocks ℎ and
Mathematical Problems in Engineering
9
(a)
(b)
(c)
(d)
(e)
(f)
Figure 3: Data sets: (a) and (d) Landsat image 𝑋1 ; (b) and (e) Landsat Image 𝑋2 ; (c) and (f) ground truth change masks.
36 32 28
TE (%)
24 20 16 12 8 4 0
5
10 Values of m
15
20
Figure 4: Performance of Fuzzy MO-PSO via different values of fuzziness parameter 𝑚.
the dimensions of the eigenvector space 𝑆 where we use ℎ = 4 and 𝑆 = 2 in our experiments. The ERGAS-based method does not need any parameter to set. In PSO-GA-based method, we use the parameters given in [18]. In the proposed method, the parameters, which must be tuned, are as follows: (1) bandwidth parameter (ℏ) of the mean shift clustering method, (2) 𝐶-mean fuzziness parameter 𝑚, (3) population size 𝐾, (4) acceleration coefficients 𝑐1 and 𝑐2 , and (5) inertia weight 𝑤. In our experiments, the bandwidth parameter (ℏ) is empirically chosen as 1.8. The rest of the parameters belong to the Fuzzy MO-PSO algorithm which are affecting the generation of population and the convergence behaviour.
The fuzziness parameter 𝑚 in (8) controls flexibility of the Fuzzy MO-PSO, which affects the performance of the algorithm. Here, to find the optimum 𝑚, we evaluate the performance of the proposed method based on TE in Figures 3(a) and 3(b) when 𝑚 varies from 2 to 20. Note that the smaller the TE is, the better the change detection performance is. The effect of fuzziness parameter 𝑚 is shown in Figure 4. It is clear that, when 𝑚 ranges from two to five, the change detection performance is superior. For the other 𝑚 values, the performance of the approach decreases significantly, so that based on this sensitivity analysis the 𝐶-mean fuzziness parameter 𝑚 is set to be 2. Note that the Fuzzy MO-PSO is a population optimization strategy and utilizes the probability transition instead of the certainty rule. With the increasing of particles’ populations size, the probability of finding the global optimal solution is increasing. However, increasing the size of the particles’ populations causes an increase in the computational time. Therefore, in the proposed method, the population size (𝐾) is set to be 40 in order to provide the best trade-off between quality of solutions and computational time. The next important parameter is the inertia weight 𝑤 in (5). It influences the ability of particles to search global and local optimum results. Therefore, the ability of searching global optimum result increases and the ability of searching local optimum result decreases when 𝑤 increases or vice versa. Other important parameters are the acceleration coefficients 𝑐1 and 𝑐2 and they are used as a learning rate of local optimum and global optimum of particles. If the coefficients are too large, the positions of the particles will change with large numbers which will result in exceeding the feasible boundary of the solutions. If they are very small, then the positions of the particles will change slowly so
10
Mathematical Problems in Engineering
(a)
(b)
(c)
(d)
Figure 5: Semisynthetic images that depict the 𝑋1 image (Figure 3(a)) with haze and various thin clouds.
(a) DT-CWT
(b) PCA-𝑘-means
(c) ERGAS
(d) PSO-GA
(e) Proposed
Figure 6: Change detection results for Figures 5(a) and 3(b).
searching speed of the global optimum result will be very slow. Because of all these reasons, these parameters affect the performance of the Fuzzy MO-PSO to resolve the change detection problem. In the proposed approach, the Fuzzy MOPSO is used with inertia weight 𝑤 = 0.4 and acceleration coefficients 𝑐1 = 2 and 𝑐2 = 2. These parameters are selected empirically and the proposed method with these parameter values provides satisfactory results in terms of obtaining the best change detection mask and computational cost. 3.4. Tests on Semisynthetic Data Sets 3.4.1. Data Sets with Haze and Thin Cloud. Generally, multispectral satellite images (e.g., Landsat images) are captured via a passive optical sensor, by those means this remote sensing technique is highly sensitive to any change in meteorologic conditions. Due to this sensitivity, Landsat images may include clouds. Furthermore, the contrast of the Landsat images acquired on the same geographical area at different time instances can be different because of the existence of haze. Existence of clouds and haze in the Landsat images is particularly a problem for land cover change analysis as they can reduce the contrast of the observed area and fade the colours in the image, so that they can influence the change detection accuracy by mistakenly detecting cloud as changed area and/or failing to correctly detect changed/unchanged pixels. Here we generate four different semisynthetic data sets with different percentages of cloud cover and thickness to quantitatively and qualitatively measure the performance of the change detection algorithms with existence of atmospheric artifacts. To this end, Figure 3(a) is firstly chosen and then haze and various percentages of thin cloud(s) with different thickness are artificially superimposed onto the different area of the image (see Figure 5).
Figures 6 and 7 illustrate the qualitative results of the change detection methods using Figures 5(a) and 3(b) and Figures 5(b) and 3(b), respectively. According to the qualitative results, it is clear that the DT-CWT-based method provides the least accurate results and it is very sensitive to variation of haze and existence of thin cloud in the images. The PCA-𝑘 means-based method shows better performance, but it still mostly detects cloud as changed areas. The PSOGA-based method shows less sensitivity to haze and thin cloud as it uses a cost function based on CC similarity metric and a hybrid PSO-GA optimization method, which are resulting in less sensitivity to intensity variations. In other words, this method can correctly detect thin cloud as unchanged area when the cloud does not cause large variation of intensities. For instance, the results in Figures 6 and 7(d) show that when the cloud(s) is outside the lake area, the method correctly detects them as unchanged pixels; however, when the clouds are exactly at the top of the lake, the PSO-GA method fails to detect the cloud pixels as unchanged as there is a huge intensity variation between two Landsat images. The ERGAS-based method shows a good performance over existence of haze, but it removes image features which are under the thin cloud areas (see Figures 6 and 7(c)). In contrast to all these methods, the proposed strategy provides promising results and the results show the robustness of the proposed method to the existence of haze and thin cloud on images and removes the influence of these artifacts effectively. The quantitative results for all the semisynthetic data sets, which are shown in Figure 5, are tabulated in Table 1. The quantitative results show that the proposed method provides the highest accuracy as compared with the state-of-the-art methods. The FA, MA, and TE measurement results verify that the proposed method is less sensitive to the existence
Mathematical Problems in Engineering
(a) DT-CWT
11
(b) PCA-𝑘 means
(c) ERGAS
(d) PSO-GA
(e) Proposed
Figure 7: Change detection results for Figures 5(b) and 3(b). Table 1: Quantitative results for semisynthetic data sets with haze and thin cloud. Method DT-CWT-based PCA-𝑘 means ERGAS-based PSO-GA-based Proposed Method
Figures 5(a) and 3(b) 𝑃FA 𝑃MA 𝑃TE 32.27 10.88 15.02 28.66 7.93 12.45 4.43 21.31 8.53 16.09 4.19 8.18 3.98 2.73 3.38
Figures 5(b) and 3(b) 𝑃FA 𝑃MA 𝑃TE 31.05 9.65 15.02 25.37 6.55 10.40 5.67 15.14 6.64 12.57 4.24 5.90 2.71 2.09 2.44
of haze and thin cloud and can more accurately analyze the pixels which are covered by thin cloud in 𝑋1 . The quantitative results for Figures 5(a) and 3(b) and Figures 5(d) and 3(b) show that the accuracy of the proposed method slightly decreases as the thickness of the cloud increases. For instance, the last column in Table 1 shows that the proposed method obtains the lowest 𝑃FA , 𝑃MA , and 𝑃TE with 2.83%, 4.03%, and 3.56%, respectively. The DT-CWT based method provides the poorest performance with 40.23%, 12.65%, and 22.91% for the 𝑃FA , 𝑃MA , and 𝑃TE , respectively. 3.4.2. Data Sets with Gaussian Noise. During the Landsat satellite image acquisition as well as the transmission and reception process, noise can be superimposed onto the informational signal. Generally, the noise on the images can be seen as random variations in signal intensity, and as the level of the noise increases, uncertainty in the Landsat images becomes greater. One of the most common noise models in Landsat satellite images is the Gaussian noise. Since the Landsat images can include both noise and atmospheric artifacts (e.g., thin cloud and haze), it is important to evaluate performance of the change detection methods with respect to all these artifacts. To achieve this, Figure 5(b), which includes haze and various thin clouds in different regions of the Lake Milh (Figure 3(a)), is selected and nine different levels of zero mean Gaussian noise are superimposed onto the image. To quantitatively demonstrate the noise levels in the image, the Peak Signal-to-Noise Ratio (PSNR), in decibel (dB), is used. The PSNR can be defined as follows: PSNR = 10 ⋅ log10 (
2552 (1/ (ℎ ×
𝑤)) ∑𝑤 𝑖1 =1
∑ℎ𝑖2 =1
(𝑋1𝜎
(𝑖1 , 𝑖2 ) − 𝑋1 (𝑖1 , 𝑖2 ))
2
),
(10)
Figures 5(c) and 3(b) 𝑃FA 𝑃MA 𝑃TE 35.03 13.23 15.75 29.36 10.49 13.02 3.05 10.68 5.81 7.87 2.95 4.96 1.91 2.18 2.02
Figures 5(d) and 3(b) 𝑃FA 𝑃MA 𝑃TE 40.23 12.65 22.91 34.23 12.43 20.19 20.22 7.84 13.43 14.55 16.41 15.25 2.83 4.03 3.56
where 𝑋1𝜎 is the Landsat image with all the artifacts and 𝑋1 is the Landsat image which can be seen in Figure 5(b). Note that as the PSNR value decreases, the noise level increases. To test the performance of change detection methods, firstly, various noisy synthetic images using Figure 5(b) are generated and these images are considered as the first input image (𝑋1 ). Moreover, the second input image is shown in Figure 3(b). Note that to generate noisy synthetic images, Gaussian noise model with a mean of zero and nine different standard deviations 𝜎 is used. In our experimental setup, 𝜎 varies in the range of 0.001 and 0.9 with the step size of 0.0112. Various experiments on semisynthetic data (Figure 5(b)) with various levels of Gaussian noise are conducted to assess the change detection methods. The results are tabulated in Table 2 and shown in Figure 8. Figure 8(a) illustrates the image which is used to generate noisy images (𝑋1𝜎 ) (Figure 8(d)). The second input image (𝑋2 ) is shown in Figure 8(b). Figure 8(c) shows the ground truth change mask, by which quantitative evaluations of binary change detection masks can be made. It is worth noting that 𝑋1𝜎 is corrupted by increasing the levels of the Gaussian noise varying from 50 dB (the least noise level) to 10 dB (the highest noise level). Figure 8(e) shows that DT-CWT-based method is robust to the existence of noise and mostly can remove this artifact correctly and this is mostly due to the implication of wavelet transforms in the change detection problem. The qualitative results of the PCA-𝑘 means change detection method (Figure 8(f)) show that this method is highly sensitive to the existence of noise and can wrongly detect noises as changed pixels, so that as the noise level increases (PSNR less than 35 dB), the accuracy rapidly decreases. In contrast with these two methods, the ERGAS-based method provides higher rate of correct detection. Note that even with high levels of noise interference, ranging from 30 to 10 dB, the ERGAS-based method correctly flags noise and atmospheric
12
Mathematical Problems in Engineering Table 2: Quantitative results for semisynthetic data sets with haze, thin cloud, and Gaussian noise.
PPSNR 50 45 40 35 30 25 20 15 10
FA 32.21 33.05 34.23 34.87 36.22 38.52 40.58 41.14 44.36
DT-CWT MA 10.09 10.23 10.91 11.03 11.22 11.29 11.33 11.56 13.12
TE 15.87 16.18 16.43 16.79 17.28 18.02 18.35 18.43 22.73
PCA-𝑘 means FA MA TE 25.74 7.33 11.02 27.82 7.41 11.56 28.11 7.54 12.06 30.71 7.72 12.43 32.46 8.05 13.83 35.88 8.15 14.83 38.89 8.12 14.98 40.29 8.42 15.18 45.19 9.18 17.23
(a) 𝑋1𝜎=0
(d) Corrupted image
(e) DT-CWT
ERGAS MA TE 15.29 6.98 15.49 7.04 15.61 7.12 15.96 7.15 16.77 7.82 17.21 7.91 17.66 8.03 18.02 8.09 20.16 10.21
FA 5.73 5.78 5.83 5.85 6.01 5.98 6.02 6.14 8.24
(b) 𝑋2
(f) PCA-𝑘 means
FA 12.68 12.93 12.96 13.16 13.88 14.05 14.33 15.13 16.29
PSO-GA MA 4.44 4.51 4.58 5.23 5.83 6.23 6.70 6.92 7.72
TE 6.13 7.22 7.24 8.29 8.56 9.22 9.64 9.94 11.43
FA 2.69 2.78 2.79 2.81 2.86 2.89 2.90 2.93 4.11
Proposed MA 2.21 2.25 2.25 2.26 2.40 2.40 2.42 2.49 3.28
TE 2.03 2.09 2.11 2.12 2.32 2.52 2.61 2.77 3.47
(c) Ground truth
(g) ERGAS
(h) PSO-GA
(i) Proposed
Figure 8: Evaluation of the various methods on semisynthetic data set with various noise levels. (a) Synthetic data set with the existence of haze and thin clouds; (b) Lake Milh data set (𝑋2 ) shown in Figure 3(b); (c) ground truth change mask. In (d), the image, shown in (a), is corrupted with different levels of zero mean Gaussian noise (from second row to fourth row, PSNR = 40, 20, and 10 dB, respectively). (e)–(i) shows the final change detection masks generated by DT-CWT, PCA-𝑘 means, ERGAS, GA-PSO, and proposed method, respectively.
artifacts as unchanged pixels (see Figure 8(g)). However, due to the use of OTSU’s thresholding technique to generate final binary change mask, many small changes are discarded in this technique. The PSO-GA-based method also shows very good performance against Gaussian noise and can detect small changes in the images, but those with great risibilities (see Figure 8(h)). This is due to the fact that this method employs
an optimization technique to generate the final change detection mask rather than OTSU’s thresholding technique. However, this method is sensitive to existence of atmospheric artifacts as it uses CC similarity metric. It is clear from Table 2 and Figure 8(i) that the proposed technique consistently outperforms the other approaches against different noise levels and atmospheric variations. This is mostly because the
Mathematical Problems in Engineering
(a) DT-CWT
(b) PCA-𝑘-means
13
(c) ERGAS
(d) PSO-GA
(e) Proposed
Figure 9: Change detection results for Figures 3(d) and 3(e).
proposed method uses hue colour channel with wavelet transforms and mean shift algorithm which makes the proposed method robust to illumination changes, existence of clouds, and Gaussian noise. Furthermore, the proposed method uses a new and effective fuzzy multiobjective approach to iteratively optimize two fuzzy fitness functions to obtain the optimal change detection mask. 3.5. Tests on Real Data Sets. In order to understand and analyze the performances of the change detection methods for the real data sets, Figures 3(a) and 3(b) and Figures 3(d) and 3(e) are used. Figure 9 illustrates the qualitative results of the change detection methods using the real data set with the atmospheric artifacts shown in Figures 3(d) and 3(e). According to the qualitative results, it is clear that the DT-CWT-based method provides the least accurate results and it is very sensitive to variation of haze and existence of thin cloud in the images. The PCA-𝑘 means-based method shows better performance, but it still wrongly detects cloud areas mostly as changed regions. The PSO-GA-based method shows less sensitivity to haze and thin cloud as it uses CC similarity metric which is less sensitive to intensity variations. The ERGAS-based method shows good performance over existence of haze, but it detects the dense thin clouds as changed and removes image features under the light thin cloud areas. In contrast to all these methods, the proposed strategy provides promising results and the results show the robustness of the proposed method to the existence of haze and thin cloud on images and removes the influence of these artifacts effectively. The quantitative results for the real data sets, which are shown in Figure 3, are tabulated in Table 3. For the first real data set (Figures 3(a) and 3(b)), the ERGAS method provides the poorest performance and it obtains the lowest 𝑃FA , 𝑃MA , and 𝑃TE with 9.38%, 18.83%, and 16.48%, respectively. The PSO-GA change detection method gives good results as it uses optimization strategy to find the final change detection mask and it obtains 4.65%, 2.88%, and 4.04% for 𝑃FA , 𝑃MA , and 𝑃TE , respectively. However, the method is not successful in finding the most optimal result as it uses weighted sum of fitness functions. On the other hand, the proposed method gives the best accuracy results compared to the state-of-theart change detection methods with 3.36%, 2.52%, and 3.26% for 𝑃FA , 𝑃MA , and 𝑃TE , respectively. In the second real data set (Figures 3(d) and 3(e)), the complexity increases in the real
data set as the haze and thin cloud are involved in the images. Note that the region of interest with the blue rectangular region as shown in Figure 3 is considered to evaluate the quantitative results and only 𝑃FA is estimated since there is no any change in the region of interest. For this data set, the DT-CWT based and PCA-𝑘 means methods provide the least performances with 82.51% and 68.33%, respectively. The ERGAS-based method provides good result because it is more robust to the haze and thin cloud than the other methods but it is not enough to obtain the best change detection mask. On the other hand, the proposed method gives the most accurate result as the haze and thin cloud mostly have influence on performances of the other methods. The combination of preprocessing and postprocessing (Fuzzy MO-PSO) strategies make the proposed method more effective and robust than the state-of-the-art methods to resolve the change detection problem even if the complexity increases with different kinds of artifacts (e.g., haze, thin cloud, and noise). 3.6. Discussion. Generally, there are several reasons that the state-of-the-art methods fail to resolve the change detection problem between two images efficiently: (1) The methods use the gray/colour value constancy assumption, which makes them not robust to the atmospheric artifacts. (2) The PSOGA, the PCA-𝑘 means, and the ERGAS-based methods are applied into the spatial domain which decreases the accuracy of detection near boundaries. (3) The PSO-GA method is a single-objective optimization solution approach and uses weighted sum of the objective functions which limits the searching of optimum result. (4) The DT-CWT based method uses simple union fusion based approach and neglects the low subband coefficients which results in increasing the incorrect detection rate. On the other hand, the proposed method uses different preprocessing and postprocessing strategies than the other methods which improve the performance and provide the greatest accurate change detection results. In addition, by comparing the results, we can conclude that the proposed method provides the best results as using the hue channel of Landsat images with the hybrid wavelet transform make the proposed method strongly robust to existence of artifacts. Another reason that the proposed method provides the highest performance over the sophisticated scenarios is due to the use of mean shift algorithm as it smoothes the intensity variations which results in better convergence rate and decreasing computational cost of the Fuzzy MO-PSO. Furthermore, the
14
Mathematical Problems in Engineering Table 3: Quantitative results for the real data sets.
Method DT-CWT-based PCA-𝑘 means ERGAS-based PSO-GA-based Proposed Method
𝑃FA 7.85 6.42 9.38 4.65 3.36
Figures 3(a) and 3(b) 𝑃MA 4.42 5.96 18.83 2.88 2.52
proposed MO-PSO provides the optimum trade-off between the fuzzy objective functions for better discrimination. In this paper, we have discussed the performance of the change detection methods if one of the Landsat images has haze and thin clouds. However, if both images have thin clouds and haze, then the change detection problem becomes even harder to resolve, especially if these atmospheric artifacts are in the mutual regions of the two different images (worst-case-scenario). If both Landsat images have thin clouds and haze in different regions, the proposed method will successfully resolve the corresponding problem since it uses several preprocessing techniques before applying the Fuzzy MO-PSO. For the worst-case-scenario, the proposed method may still provide the better result compared to the existing methods but it may not be successful in obtaining the most optimum result.
4. Conclusion In this paper, a new unsupervised approach in Landsat images using hybrid wavelet transform and mean shift clustering along with Fuzzy MO-PSO has been proposed to find the optimal change detection mask. In the method, a hybrid wavelet transform based on the DWT and the SWT has been used to decompose the hue channel of the Landsat images. Thus, the influence of atmospheric variations (e.g., thin cloud and haze) and noise artifacts have been significantly reduced in Landsat change detection problem. The LL and HH subbands have been used to generate two difference images and they are smoothed using mean shift algorithm. Next, the Fuzzy MO-PSO method is used to iteratively optimize fuzzy based fitness functions to find the Pareto optimal solutions and change detection masks for two different difference subband images. The most ideal solution is selected amongst many Pareto solutions as a trade-off solution for each subband image. Finally, two binary masks are combined to estimate the final binary image using the fusion method based on the connected component and union technique. The proposed method has been compared with the state-of-theart change detection algorithms for real and semisynthetic data sets and the results verify robustness and effectiveness of the proposed method to the existence of haze and thin cloud as well as variations of Gaussian noise in Landsat images.
Conflicts of Interest The authors declare that there are no conflicts of interest regarding the publication of this paper.
𝑃TE 5.92 5.45 16.48 4.04 3.26
Figures 3(d) and 3(e) 𝑃FA 82.51 68.33 12.46 36.92 0.00
Acknowledgments Huseyin Kusetogullari is funded by the research project “Scalable Resource Efficient Systems for Big Data Analytics” by the Knowledge Foundation (Grant: 20140032) in Sweden. Also, the authors would like to thank Professor T. Celik for sharing his codes.
References [1] S. Kumar, M. Anouncia, S. Johnson, A. Agarwal, and P. Dwivedi, “Agriculture change detection model using remote sensing images and GIS: study area Vellore,” in Proceedings of the 2012 International Conference on Radar, Communication and Computing, ICRCC 2012, pp. 54–57, ind, December 2012. [2] H. Nefeslioglu, M. Tun, C. Ayday, and R. Goktan, “Change detection of structures in the earthquake hazard zoning map of Eskisehir City, Turkey, by using satellite images,” in Proceedings of the 2nd GRSS/ISPRS Joint Workshop on Remote Sensing and Data Fusion over Urban Areas. URBAN 2003, pp. 177–181, Berlin, Germany, 2003. [3] E. K. Forkuo and A. Frimpong, “Analysis of forest cover change detection,” International Journal of Remote Sensing Applications, vol. 2, no. 4, pp. 82–92, 2012. [4] P. Du, S. Liu, P. Gamba, K. Tan, and J. Xia, “Fusion of difference images for change detection over urban areas,” IEEE Journal of Selected Topics in Applied Earth Observations and Remote Sensing, vol. 5, no. 4, pp. 1076–1086, 2012. [5] I. R. Hegazy and M. R. Kaloop, “Monitoring urban growth and land use change detection with GIS and remote sensing techniques in Daqahlia governorate Egypt,” International Journal of Sustainable Built Environment, vol. 4, no. 1, pp. 117–124, 2015. [6] S. Liu, Q. Du, X. Tong, A. Samat, L. Bruzzone, and F. Bovolo, “Multiscale morphological compressed change vector analysis for unsupervised multiple change detection,” IEEE Journal of Selected Topics in Applied Earth Observations and Remote Sensing, vol. 10, no. 9, pp. 4124–4137, 2017. [7] A. C. Van den Broek, R. J. Dekker, and T. P. H. Steeghs, “Concepts for monitoring and surveillance using space borne SAR systems,” in Proceedings of NATOSCI-150 Symposium on Integration of Space-Based Assets within Full Spectrum Operations, pp. 10–12, 2005. [8] Y. Wang, L. Du, and H. Dai, “Unsupervised SAR image change detection based on SIFT keypoints and region information,” IEEE Geoscience and Remote Sensing Letters, vol. 13, no. 7, pp. 931–935, 2016. [9] P. Coppin, I. Jonckheere, K. Nackaerts, B. Muys, and E. Lambin, “Digital change detection methods in ecosystem monitoring: a review,” International Journal of Remote Sensing, vol. 25, no. 9, pp. 1565–1596, 2004.
Mathematical Problems in Engineering [10] D. Lu, P. Mausel, E. Brond´ızio, and E. Moran, “Change detection techniques,” International Journal of Remote Sensing, vol. 25, no. 12, pp. 2365–2407, 2004. [11] R. J. Radke, S. Andra, O. Al-Kofahi, and B. Roysam, “Image change detection algorithms: a systematic survey,” IEEE Transactions on Image Processing, vol. 14, no. 3, pp. 294–307, 2005. [12] D. P. Roy, H. K. Zhang, J. Ju et al., “A general method to normalize Landsat reflectance data to nadir BRDF adjusted reflectance,” Remote Sensing of Environment, vol. 176, pp. 255–271, 2016. [13] J. Shi, J. Wu, A. Paul, L. Jiao, and M. Gong, “Change detection in synthetic aperture radar images based on fuzzy active contour models and genetic algorithms,” Mathematical Problems in Engineering, vol. 2014, Article ID 870936, 15 pages, 2014. [14] T. Celik, “Unsupervised change detection in satellite images using principal component analysis and 𝜅-means clustering,” IEEE Geoscience and Remote Sensing Letters, vol. 6, no. 4, pp. 772–776, 2009. [15] F. Bovolo, S. Marchesi, and L. Bruzzone, “A framework for automatic and unsupervised detection of multiple changes in Multitemporal Images,” IEEE Transactions on Geoscience and Remote Sensing, vol. 50, no. 6, pp. 2196–2212, 2012. [16] H. Kusetogullari, A. Yavariabdi, and T. Celik, “Unsupervised change detection in multitemporal multispectral satellite images using parallel particle swarm optimization,” IEEE Journal of Selected Topics in Applied Earth Observations and Remote Sensing, vol. 8, no. 5, pp. 2151–2164, 2015. [17] M. Hao, W. Shi, H. Zhang, and C. Li, “Unsupervised change detection with expectation-maximization-based level set,” IEEE Geoscience and Remote Sensing Letters, vol. 11, no. 1, pp. 210–214, 2014. [18] H. Kusetogullari and A. Yavariabdi, “Self-adaptive hybrid PSOGA method for change detection under varying contrast conditions in satellite images,” in Proceedings of the 2016 SAI Computing Conference (SAI), pp. 361–368, London, United Kingdom, July 2016. [19] D. Renza, E. Martinez, and A. Arquero, “A new approach to change detection in multispectral images by means of ERGAS index,” IEEE Geoscience and Remote Sensing Letters, vol. 10, no. 1, pp. 76–80, 2013. [20] F. P. Nava, L. Bruzzone, A. P. Nava, J. M. G. Lamolda, and M. F. Redondo, “Change detection for remote sensing images with graph cuts,” in Proceedings of the Remote Sensing, p. 59820Q, Bruges, Belgium, 2005. [21] M. Hao, H. Zhang, W. Shi, and K. Deng, “Unsupervised change detection using fuzzy c-means and MRF from remotely sensed images,” Remote Sensing Letters, vol. 4, no. 12, pp. 1185–1194, 2013. [22] T. Celik, “Change detection in satellite images using a genetic algorithm approach,” IEEE Geoscience and Remote Sensing Letters, vol. 7, no. 2, pp. 386–390, 2010. [23] T. Celik and K.-K. Ma, “Unsupervised change detection for satellite images using dual-tree complex wavelet transform,” IEEE Transactions on Geoscience and Remote Sensing, vol. 48, no. 3, pp. 1199–1210, 2010. [24] H. Li, M. Gong, and J. Liu, “A local statistical fuzzy active contour model for change detection,” IEEE Geoscience and Remote Sensing Letters, vol. 12, no. 3, pp. 582–586, 2015. [25] Y. Chen and Z. Cao, “Change detection of multispectral remotesensing images using stationary wavelet transforms and integrated active contours,” International Journal of Remote Sensing, vol. 34, no. 24, pp. 8817–8837, 2013.
15 [26] G. Jianya, S. Haigang, M. Guorui, and Z. Qiming, “A review of multi-temporal remote sensing data change detection algorithms,” The International Archives of the Photogrammetry, Remote Sensing and Spatial Information Sciences, vol. 37, pp. 757–762, 2008. [27] K. Deb, A. Pratap, S. Agarwal, and T. Meyarivan, “A fast and elitist multiobjective genetic algorithm: NSGA-II,” IEEE Transactions on Evolutionary Computation, vol. 6, no. 2, pp. 182–197, 2002. [28] J. Tarel and N. Hautiere, “Fast visibility restoration from a single color or gray level image,” in Proceedings of the IEEE 12th International Conference on Computer Vision (ICCV ’09), pp. 2201– 2208, September 2009. [29] J. Chen, P. Gong, C. He, R. Pu, and P. Shi, “Land-use/landcover change detection using improved change-vector analysis,” Photogrammetric Engineering and Remote Sensing, vol. 69, no. 4, pp. 369–379, 2003. [30] A. Yavariabdi and H. Kusetogullari, “Change detection in multispectral landsat images using multiobjective evolutionary algorithm,” IEEE Geoscience and Remote Sensing Letters, vol. 14, no. 3, pp. 414–418, 2017. [31] D. Rocchini, M. Metz, C. Ricotta, M. Landa, A. Frigeri, and M. Neteler, “Fourier transforms for detecting multitemporal landscape fragmentation by remote sensing,” International Journal of Remote Sensing, vol. 34, no. 24, pp. 8907–8916, 2013. [32] X. Pan, F. Xie, Z. Jiang, and J. Yin, “Haze removal for a single remote sensing image based on deformed haze imaging model,” IEEE Signal Processing Letters, vol. 22, no. 10, pp. 1806–1810, 2015. [33] J. Van De Weijer and T. Gevers, “Robust optical flow from photometric invariants,” in Proceedings of the 2004 International Conference on Image Processing, ICIP 2004, pp. 1835–1838, sgp, October 2004. [34] S. Sural, G. Qian, and S. Pramanik, “Segmentation and histogram generation using the HSV color space for image retrieval,” in Proceedings of the International Conference on Image Processing (ICIP’02), pp. 589–592, USA, September 2002. [35] E. J. Sadgrove, G. Falzon, D. Miron, and D. Lamb, “Fast object detection in pastoral landscapes using a colour feature extreme learning machine,” Computers and Electronics in Agriculture, vol. 139, pp. 204–212, 2017. [36] Setiawardhana, R. Dikairono, T. A. Sardjono, and D. Purwanto, “Visual ball tracking and prediction with unique segmented area on soccer robot,” in Proceedings of the 2017 International Seminar on Intelligent Technology and its Applications (ISITIA), pp. 362–367, Surabaya, August 2017. [37] M. Bejiga, A. Zeggada, A. Nouffidj, and F. Melgani, “A convolutional neural network approach for assisting avalanche search and rescue operations with UAV imagery,” Remote Sensing, vol. 9, no. 2, p. 100, 2017. [38] K. N. Plataniotis and A. N. Venetsanopoulos, Color Image Processing and Applications, Springer-Verlag, 2000. [39] R. Szeliski, Computer Vision: Algorithms and Applications, Springer-Verlag, New York, NY, USA, 2011. [40] A. Zhou, B.-Y. Qu, H. Li, S.-Z. Zhao, P. N. Suganthan, and Q. Zhangd, “Multiobjective evolutionary algorithms: a survey of the state of the art,” Swarm and Evolutionary Computation, vol. 1, no. 1, pp. 32–49, 2011. [41] W. Stadler, “A survey of multicriteria optimization or the vector maximum problem, Part I. 1776–1960,” Journal of Optimization Theory and Applications, vol. 29, no. 1, pp. 1–52, 1979.
16 [42] J. Kennedy and R. Eberhart, “Particle swarm optimization,” in Proceedings of the IEEE International Conference on Neural Networks, pp. 1942–1948, Perth, Australia, December 1995. [43] K. Chen, C. Huo, J. Cheng, Z. Zhou, and H. Lu, “Unsupervised change detection on SAR images using Markovian fusion,” in Proceedings of the International Symposium on Multispectral Image Processing and Pattern Recognition, p. 67901S, Wuhan, China. [44] https://eros.usgs.gov/bahr-al-milh, January 2017. [45] https://earthengine.google.com/timelapse, January 2017.
Mathematical Problems in Engineering
Advances in
Operations Research Hindawi www.hindawi.com
Volume 2018
Advances in
Decision Sciences Hindawi www.hindawi.com
Volume 2018
Journal of
Applied Mathematics Hindawi www.hindawi.com
Volume 2018
The Scientific World Journal Hindawi Publishing Corporation http://www.hindawi.com www.hindawi.com
Volume 2018 2013
Journal of
Probability and Statistics Hindawi www.hindawi.com
Volume 2018
International Journal of Mathematics and Mathematical Sciences
Journal of
Optimization Hindawi www.hindawi.com
Hindawi www.hindawi.com
Volume 2018
Volume 2018
Submit your manuscripts at www.hindawi.com International Journal of
Engineering Mathematics Hindawi www.hindawi.com
International Journal of
Analysis
Journal of
Complex Analysis Hindawi www.hindawi.com
Volume 2018
International Journal of
Stochastic Analysis Hindawi www.hindawi.com
Hindawi www.hindawi.com
Volume 2018
Volume 2018
Advances in
Numerical Analysis Hindawi www.hindawi.com
Volume 2018
Journal of
Hindawi www.hindawi.com
Volume 2018
Journal of
Mathematics Hindawi www.hindawi.com
Mathematical Problems in Engineering
Function Spaces Volume 2018
Hindawi www.hindawi.com
Volume 2018
International Journal of
Differential Equations Hindawi www.hindawi.com
Volume 2018
Abstract and Applied Analysis Hindawi www.hindawi.com
Volume 2018
Discrete Dynamics in Nature and Society Hindawi www.hindawi.com
Volume 2018
Advances in
Mathematical Physics Volume 2018
Hindawi www.hindawi.com
Volume 2018