through Risk Management. Use of a Bayesian Network Decision Tool to .... to decide upon the best options for managing these risks. Land & Water Australia ...
Report No 4 LWA/MDBC Project UMO43: Delivering Sustainability through Risk Management
Use of a Bayesian Network Decision Tool to Manage Environmental Flows in the Wimmera River, Victoria
Yung En Chee, Mark Burgman and Jan Carey University of Melbourne
August 2005
Executive Summary This report - Use of a Bayesian Network Decision Tool to Manage Environmental Flows in the Wimmera River, Victoria- is the forth in a series of five produced by LWA/MDBC project UMO43 Developing Risk-based Approaches for Managing Contaminants in Catchments. Decision making in ecosystem management is a process of balancing multiple objectives, constraints, trade-offs and uncertainties against a complex backdrop of socio-economic, cultural and political considerations and limited ecological understanding. A central challenge in providing credible, effective and defensible decision support therefore, is to provide and apply frameworks and methods that will allow informed choices by providing opportunities for genuine, substantive participation in decision making supported by best available scientific knowledge that also incorporates uncertainty in an honest, rigorous and consistent manner. Using Ecological Risk Assessment (ERA) as an organizing framework, stakeholder engagement, risk-based modelling and decision-analytic techniques were developed and applied to a case study of environmental flow management in a degraded, semi-arid lowland river in the Wimmera Catchment in Victoria. The case study focussed on the management of the summer environmental flow regime to maintain adequate instream habitat and water quality for aquatic biota in the Lower Wimmera River. Formal management and expert stakeholder workshops were used to obtain stakeholder input for the ERA stages of problem formulation, hazard identification and assessment, conceptual modelling and endpoint selection. Workshop outcomes provided the basis for risk analysis modelling of the ecological effects of environmental flow management. Synthesizing information and data from a wide range of sources, a Bayesian network (BN) model was constructed to capture current understanding on the potential effects of environmental flow management on Freshwater Catfish, the stakeholder chosen risk assessment endpoint. The application and utility of the BN model for evaluating potential environmental flow management strategies and supporting adaptive management within an ERA framework is demonstrated and evaluated. Insights from the modelling process were used to formulate general principles for designing flow strategies over summer and critical gaps in knowledge are also highlighted.
Table of Contents Executive summary 1. Background ………………………………………………………………….……..
1
2. Ecological risk assessment ………………………………………………………..
3
3. Wimmera catchment ………………………………………………………….…...
5
3.1. General description
5
3.2. Environmental values
7
4. Problem formulation ………………………………………………………….…..
10
4.1. Ecological management issues in the Wimmera River
10
4.2. Managing environmental flows in the Lower Wimmera under uncertainty
12
4.3. Planning, problem formulation and stakeholder involvement
15
4.4. Stakeholder workshops
17
4.5. Workshop outcomes
19
5. Development of the Bayesian network model for Freshwater Catfish in the Lower Wimmera River ……………………………………………………………
30
5.1. Bayesian network modelling
30
5.2. Overview of the development and construction of the Freshwater Catfish BN
32
5.3. Stakeholder considerations in BN model development
33
5.4. Biological and biophysical processes
33
5.5. Graphical structure of Freshwater Catfish BN
35
5.6. Reviewing BN model structure and node relationships
45
5.7. Sensitivity to findings
45
6. Management implications…………………………………………………….…...
47
6.1. General
47
6.2. Sensitivity to findings analysis
50
6.3. Analysis/evaluation of environmental flow scenarios and strategies
54
7. Conclusions ………………………………………………………………….…….
59
7.1 General
59
7.2 Benefits and limitations of the BN modelling approach
60
8.
References ………………………………………………………………………….
Appendix 1 ……………………………………………………………………………..
62 68
Tables Table 1: Environmental flow recommendations for the Lower Wimmera River (between McKenzie River and Lake Hindmarsh)
13
Table 2: Examples from the workshop of some of the hazards identified and the assessment of their potential effects
21
Table 3: Evaluation of the selected endpoints “sustainable populations of Freshwater Catfish” and “macroinvertebrate community diversity” with respect to congruence with required attributes of assessment endpoints
27
Table 4: Summary of model variable definitions, states and sources of information and/or data used to discretize variables and construct probability models
37
Table 5: Utility function for assessing environmental flow scenarios/strategies using the influence diagram
49
Table 6: Results of sensitivity to findings analysis for the seven variables of management interest. The rank of each network variable (findings node) with respect to the query variable is given by the value in each cell (with a rank of 1 indicating the network variable with the greatest influence on the query variable) Table 7: Summary of the main characteristics and expected utility value of various flow strategies evaluated using the BN decision network. The two shaded rows highlight the base cases of a worst case ‘Dry’ scenario and the SKM flow strategy that serve as benchmarks for evaluation.
57
Figures Figure 1: Figure 2: Figure 3: Figure 4: Figure 5: Figure 6:
Figure 7:
Steps in the ecological risk assessment (ERA) cycle (adapted from Burgman 2005 and Hart et al. 2005) Location and land use types in the Wimmera region, Victoria, Australia (adapted from Bureau of Rural Sciences, Commonwealth of Australia) The Lower Wimmera River, Lake Hindmarsh, Lake Albacutya and the terminal lake system in Wyperfeld National Park Operations map of the Wimmera-Mallee Water Supply System Bayesian network model for Freshwater Catfish in the Lower Wimmera River Full Bayesian network model for Freshwater Catfish in the Lower Wimmera River showing the instantiation of the summer flow release strategy recommended in SKM (2002), in which median MDF=5 ML/day, ‘Fresh’ frequency=4 and ‘Fresh’ magnitude=20 ML Full Bayesian decision network model for Freshwater Catfish in the Lower Wimmera River, showing the instantiation of a flow release strategy in which the median MDF=10 ML/day and the number of ‘freshes’=3. The number beside each decision choice in the Fresh Magnitude node indicates the expected utility of making that choice
3 5 6 7 36
48
50
Figure 8:
Figure 9:
Predicted probability distributions for variables of management interest. The worst case ‘Dry’ scenario is represented with stippled bars and the SKM flow strategy is shown as solid grey bars Variation in expected utility for a fixed volume of 240 ML allocated over 14 ‘freshes’ for median MDF values of 0, 10 and 30 ML/day
55 57
Risk-based Approaches for Managing Contaminants in Catchments – Report 4
1.
1
Background
Natural resource managers currently have few quantitative tools to assist them in identifying which of their environmental assets are at greatest risk from ecological degradation and then to decide upon the best options for managing these risks. Land & Water Australia (LWA) and the Murray Darling Basin Commission (MDBC) have funded project UMO43 Developing Risk-based Approaches for Managing Contaminants in Catchments to develop quantitative risk-based assessment guidelines that will offer a new framework and guidance to assist in improving the management of diffuse contaminants in catchments. These guidelines have been built around qualitative and quantitative models (the backbone of risk assessment) that link catchment contaminant reduction targets (end-of-valley targets for nutrients, salinity, SPM and pesticides) with the ecological benefits in receiving waterbodies. The project was undertaken through a collaborative partnership between Monash University, the University of Melbourne and CSIRO. The project objectives were: •
To develop guidelines for risk-based approaches that can be used to prioritise ecological risks from multiple contaminants in a catchment context (i.e. multiple-stressors resulting in multiple issues),
•
To develop quantitative models of ecosystem components and relationships to address key issue(s) of concern,
•
To increase the capacity in Australian natural resource management agencies to use riskbased assessment approaches.
The detailed project plan was developed with input from two workshops: (a) an initial planning workshop, where it was agreed that a review of the risk-based approaches used by other disciplines (e.g. economics, petroleum industry, human health (medical)) would be produced (see Burgman et al., 2003), and (b) a stakeholder workshop to identify possible case studies in collaboration with resource management partners. The project involved undertaking three case studies and using the outputs from these to modify the Ecological Risk Assessment guidelines previously prepared by Hart et al. (2005). Five reports have been produced: •
Summary Report - Risk-based Approaches for Managing Contaminants in Catchments (Hart et al., 2006).
•
Report 1 – Guidelines for Quantifying the Ecological Risks from Contaminants in Catchments (Carey et al., 2006).
•
Report 2 – Determining Uncertainty in Sediment & Nutrient Transport Models for Ecological Risk Assessment (Henderson & Bui, 2005).
•
Report 3 - Ecological Risk Assessment Case Study for the Woori Yallock Creek Catchment (Eucalyptus camphora swamps) (Pollino et al., 2005),
•
Report 4 - Use of a Bayesian Network decision tool to manage environmental flows in the Wimmera River, Victoria (Chee et al., 2005).
Risk-based Approaches for Managing Contaminants in Catchments – Report 4
2
These reports are all available at www.sci.monash.edu.au/wsc. This document is Report 4 of the series and covers the development of a Bayesian Network decision tool to assist in the management of environmental flows in the lower Wimmera River.
Risk-based Approaches for Managing Contaminants in Catchments – Report 4
2.
Ecological Risk Assessment
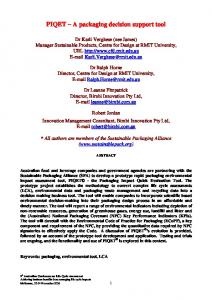
Ecological risk assessments evaluate the ecological effects caused by natural events and human activities and typically are defined as systematic, formal processes of estimating the likelihood of occurrence of adverse events/circumstances and the magnitudes of consequences to ecological values that result from these events (Burgman 2005). ERA is carried out within a broader framework that includes problem formulation, hazard identification and assessment, conceptual modelling, endpoint selection, risk analysis, sensitivity analysis, communication of results, decision-making, monitoring, review and updating (Figure 1). As shown in Figure 1, this is an iterative and cyclic process. Conceived in this perspective as a ‘megatool’, ERA can facilitate the integration of social, scientific and policy dimensions and serve as a comprehensive organizing framework for environmental problem-solving in complex settings. Learning is an elemental feature of the process and completion of the cycle ensures that (a) the appropriate questions are being investigated; (b) a wide range of potential hazards, or threats to what stakeholders value and want to protect are canvassed; (c) conceptual models of relationships between important interacting variables in the system under study are explicated and explicitly communicated; (d) assumptions are probed; (e) risks are quantified as rigorously as possible; (f) results are communicated; (g) feedback is collected; (h) predictions are validated and (i) knowledge is updated (Burgman, 2005).
Problem Formulation
Hazard Assessment
Conceptual Modelling
Monitoring, Review & Updating
Selection of Endpoint
Risk Analysis Modelling
Decision Making
Communication of Results
Figure 1:
Steps in the ecological risk assessment (ERA) cycle (adapted from Burgman 2005 and Hart et al. 2005)
To be meaningful and effective, ERA must be scientifically valid as well as relevant to regulatory needs and public concerns (USEPA, 1992). While the technical aspects of risk assessment, modelling and uncertainty analysis are important for improving the quality of information for environmental decision making, their value is limited if the endpoints do not
3
Risk-based Approaches for Managing Contaminants in Catchments – Report 4
coincide with the publicly-meaningful attributes that are of concern to decision makers (Reckhow, 1999a). In tailoring the traditional ERA framework for use in complex natural resource management problems on large spatial, temporal and ecological scales, the most important innovations are an increased emphasis on: communication with stakeholders; stakeholder participation in the tasks of problem formulation, hazard identification, endpoint selection and conceptual modeling and iteration between the various stages involved in conducting an ERA (see e.g. McDaniels et al., 1999; Borsuk et al., 2001; USEPA, 2001, 2002; Serveiss, 2002). On the technical side, a great deal of effort is also being invested in the development of modelling tools to address the problems of trying to estimate risks from diverse multiple stressors. This paradigm recognizes that scientific knowledge is critical for ensuring that the risk assessment addresses all important ecological concerns and characterizes uncertainty adequately but at the same time acknowledges the validity of socio-cultural perceptions of risks and provides procedural mechanisms for incorporating these in the risk assessment process.
4
Risk-based Approaches for Managing Contaminants in Catchments – Report 4
3.
The Wimmera Catchment
3.1
General description
The Wimmera region is located in north-west Victoria, Australia and covers almost 30,000 km2, or about 13% of Victoria’s total land area. The dominant land use is agriculture, mainly dryland cropping of cereals, grain, pulses and oilseeds (Figure 2). The climate in the Wimmera region varies from temperate in the Grampians and Pyrenees Ranges in the south-east to semi-arid in north (LCC, 1985). Rainfall is highest over the ranges in the south and south-east of the catchment, being over 1,000 mm and 700 mm per annum in the Grampians and the Pyrenees respectively. In the plains regions of the Wimmera, mean annual precipitation steadily decreases from south to north, from 576 mm at Stawell, to 449 mm at Horsham, to 384 mm at Jeparit and 368 mm at Rainbow (Bureau of Meteorology, 2002). Most of the rainfall occurs over winter and spring. Annual areal potential evapo-transpiration in the Wimmera region is high and greatly exceeds annual precipitation in all areas except in the south and south-eastern ranges. It varies from about 1,100 mm in the south to about 1,200 mm in the north (Wang et al., 2001).
Figure 2: Location and land use types in the Wimmera region, Victoria, Australia (adapted from Bureau of Rural Sciences, Commonwealth of Australia)
5
Risk-based Approaches for Managing Contaminants in Catchments – Report 4
The endorheic (terminal) Wimmera River basin falls within the Murray-Darling Drainage Division IV and represents the largest inland drainage system in Victoria (Anderson and Morison, 1988a). The Wimmera River is an allogenic river, originating in relatively wet upland areas in the Grampians and Pyrenees Ranges, but flowing for the majority of its length through a semi-arid landscape which not only produces little additional discharge, but which also results in large-scale losses through evapo-transpiration and percolation. Flows are highly seasonal and during low flow periods, sections of these lower reaches dry out and hydrological connectivity is interrupted as the river contracts into a series of pools. These pools are typically 4-8 m deep, 30-60 m wide and 1-4 km long and appear to persist even in severe drought conditions (Anderson and Morsion, 1988b; Western et al., 1996). Saline pools occur extensively between Horsham and Jeparit, particularly in the Lower Norton, Polkemmet, Ellis Crossing, Big Bend, Antwerp, Tarranyurk and Jeparit areas (Anderson and Morison, 1988a; Western, 1994; Metzeling, 1995; Ryan et al., 1999; SKM, 2003b) (some of these locations are shown in Figure 3). The northern most reach of the Wimmera River is ephemeral or episodic and only during exceptionally wet periods does the flow continue north of Lake Hindmarsh to Lake Albacutya, and on overflow, into the Outlet Creek system and terminal lakes in Wyperfeld National Park.
Figure 3:
Map showing the lower section of the Wimmera River, including Lake Hindmarsh, Lake Albacutya and the terminal lake system in Wyperfeld National Park
6
Risk-based Approaches for Managing Contaminants in Catchments – Report 4
Flows in the Wimmera River are highly seasonal with most flow occurring in the winterspring period. Low or zero flows typically occur from December to May. Periods of low flow (consecutive days with less than or equal to 5 ML/day) have lasted for up to 965 days at Horsham. The major aquifers of the Wimmera region are the unconfined Parilla Sand aquifer, the Murray Group Limestone aquifer and the basal Renmark Group aquifer. Finer grained units such as Ettrick Marl, Geera Clay, Winnambol Formation, Bookpurnong Beds and Blanchetown Clay behave as aquitards thoughout the region (Macumber, 1990). The Parilla Sand and Renmark Group aquifers extend throughout most of the Wimmera, but the Murray Group aquifer is restricted to the west of the Wimmera River (Weaver et al., 2002). Within the Wimmera region, water quality in the Murray Group Limestone is relatively fresh and consistent with a total dissolved solids (TDS) content of approximately 1,500 mg/L. In contrast, water quality varies greatly over a small spatial extent within the Parilla Sand (TDS 650-115,000 mg/L) and Renmark (TDS 600-16,000 mg/L) aquifers (Weaver et al., 2002; Swane, 2004).
3.2
Environmental values
Since European settlement, about 86% of the total catchment area has been denuded of native vegetation (WCCG, 1991). Most of the native vegetative cover that remains is in National Parks, State Parks, Flora and Fauna Reserves and Crown land water frontage reserves (Figure 3). The Wimmera region contains some 1,900 plant species and 440 animal species, including 58 mammal species, over 280 bird species and 66 reptile species (WCMA 2003a). Of these, 84 are rare (either at State/National level), 60 are vulnerable (either at State/National level) and 29 are endangered (under the Environment Protection and Biodiversity Conservation (EPBC) Act 1999 (WCMA, 2003a). The Wimmera River and its environs provide habitat for a variety of species, a number of which are considered threatened in Victoria and nationally (SKM, 2002a). Twelve native freshwater fish species have been recorded from the Wimmera River system. Of these, only five are endemic to the region, with the rest having been introduced (Anderson and Morison, 1988c). One species of threatened amphibian, the Warty Bell Frog (Litoria raniformis) has been recorded from the Wimmera River catchment. Other vertebrates present in the catchment that depend directly on the instream environment for habitat include the Platypus (Ornithorhychus anatinus), the Water Rat (Hydromys chrysogaster) and the Long-necked Tortoise (Chelodinia longicollis) (LCC, 1985; WCMA, 2003a). Of the 135 threatened flora species that occur in the Wimmera River catchment, 24 are directly reliant upon the instream environment for their survival (SKM, 2002a). The lowland reach of the Wimmera River extending from Polkemmet to Wirrengren Plain in Wyperfeld National Park (incorporating Lakes Hindmarsh and Albacutya and the rest of the terminal lake system) is a Heritage River corridor proclaimed under the Heritage Rivers Act 1992. Lake Albacutya is listed under the Ramsar Convention as a wetland of international significance and is registered on the National Estate.
7
Risk-based Approaches for Managing Contaminants in Catchments – Report 4
3.3
Development of Water Resources: The Wimmera-Mallee System
European settlement of the Wimmera region began in the 1850s and water regulation works commenced soon after, in order to ensure a more reliable supply of water for domestic, stock and irrigation purposes, in this region of highly variable streamflow. The resultant Wimmera-Mallee system (previously known as the Wimmera-Mallee Stock and Domestic System, WMSDS) harvests and distributes water in a complex system of impoundments, weirs, diversions, on and off-stream storages and distribution channels (Figure 4). The Wimmera-Mallee system is administered by the rural water authority, Grampians Wimmera Mallee Water (GWMW) (formerly Wimmera-Mallee Water, WMW). The Wimmera-Mallee system services a total area covering about 30,000 km2 and supplies 15,760 properties and an estimated 4,500 farming enterprises through a total length of approximately 14,000 km of open channels and 32,000 km of rural pipelines. The system provides water supply services to approximately 52,000 people in 74 towns throughout the region and domestic and stock water supplies for approximately 7,000 people throughout the region. The water supplied to the Wimmera-Mallee area is provided principally from the Glenelg River and Wimmera River and its tributaries. The headworks system consists of 12 storages in and around the Grampians, together with their connecting natural streams and man-made channels (Figure 4). The system interacts directly with the Wimmera River at Glenorchy and Huddlestones Weir. On average, diversions from the Wimmera River upstream of Horsham account for about 48% of the average annual yield of the Wimmera River catchment and around 85% of the average natural flows from the upper Glenelg River are diverted from the river system to fill Rocklands reservoir (WMW, 2001). At Huddlestones Weir, 100% of the natural low is frequently diverted resulting in the frequent occurrence of zero flow in the Wimmera River downstream of the weir (SKM, 2001).
8
Risk-based Approaches for Managing Contaminants in Catchments – Report 4
Figure 4: Operations map of the Wimmera-Mallee Water Supply System. (Source: GWMW)
9
Risk-based Approaches for Managing Contaminants in Catchments – Report 4
4.
10
Problem Formulation
Under the new Victorian Water Allocation Framework, Catchment Management Authorities (CMAs) have been invested with the task of managing environmental flows (DSE, 2004). This case study of an ERA for environmental flow management in the Lower Wimmera River was undertaken in partnership with the Wimmera Catchment Management Authority (WCMA), the Environment Protection Authority Victoria (EPA) and a Land and Water Australia/Murray Darling Basin Commission (LWA/MDBC) project on ‘Developing Riskbased Approaches for Managing Contaminants in Catchments (Contaminants Risk Assessment)’ (LWA/MDBC Project UMO43, 2005). The project represents a collaborative attempt by the scientific, regulatory and natural resource management community to develop a system for enhancing the quality of environmental decision making by engaging stakeholders and integrating substantive stakeholder concerns into scientific analyses as part of a holistic problem solving approach.
4.1
Ecological management issues in the Wimmera River
Since European settlement, the Wimmera River and its surrounding catchment has been heavily modified by extensive vegetation clearance for agriculture and urbanization and intensive river regulation. While the development of land and water resources for agricultural, urban and industrial purposes has brought much socio-economic benefit to the region and the state, it has exacted a high environmental cost. The combined impacts of anthropogenic activities has resulted in a host of natural resource management problems in the catchment including: (a) loss and decline of native vegetation communities (WCCG, 1991), (b) soil erosion and soil structure degradation (RWC, 1991), (c) expanding land salinization (Strudwick, 1992; Hocking, 1998, 1999), (d) alteration of the natural flow regime (Anderson and Morison, 1988a; SKM, 2001, 2002a,b) (e) changes in fluvial geomorphology due to impaired hydrological and geomorphological processes (SKM, 2001, 2002a,b), (f) deterioration in stream water quality due to saline groundwater intrusion, pollution and nutrient enrichment from domestic and industrial wastewater discharges and urban and agricultural runoff (EPA, 1984; Anderson and Morison, 1989; SKM, 2001) and (g) proliferation of pest plants and animals (EPA, 1984; Anderson and Morison, 1989; SKM, 2001). The environmental condition of the Wimmera River varies along its length. The mainstream Wimmera River from the headwaters to Horsham has predominantly been classified as marginal using the Index of Stream Condition (ISC)1 scores, a multi-metric indicator of ecologically relevant environmental conditions (Metzeling, 2002). The Lower Wimmera River has been classified as poor or very poor using the ISC scores. The assessments were corroborated by results from macroinvertebrate indices such as AusRiVas (Australian River Assessment System) and SIGNAL (Stream Invertebrate Grade Number-Average Level) scores (Metzeling, 2002).
1
The ISC is a bench-marking tool that combines information on current flow regime, water quality, physical condition of the channel and riparian zone and macroinvertebrate communities to provide a snapshot of river condition.
Risk-based Approaches for Managing Contaminants in Catchments – Report 4
11
The primary water quality issue in the Wimmera River is high salinity levels. Salinity has historically been high upstream of Glenorchy, decreasing below Glenorchy Weir due to the diluting effect of water entering from the weir pool from the Wimmera-Mallee system and then increasing downstream towards the terminal lakes (EPA, 1984). In addition to high surface water salinity, the lower reaches are subject to saline groundwater intrusions from the Parilla Sand aquifer, leading to localized occurrences of extremely high bottom water salinity (eg. 30,000-56,000 EC) which in turn leads to salinity-induced density stratification of the water column (Anderson and Morison, 1988a,b). In the Lower Wimmera River, the major in-stream problem from an environmental point of view is not salinity per se, but rather salinity-induced density stratification of the water column, which results in restricted vertical mixing in the water column during low flow periods and subsequent severe and persistent deoxygenation (with levels of dissolved oxygen (DO) frequently 20 ML/day
>334 ML/day
Promote recruitment of Murray Cod and Macquarie Perch. Annual
Bankfull Flow
> 3,000 ML/day
annual
Minimum 2 days
Maintain or improve water quality in pools via mixing and/or destratification.
Risk-based Approaches for Managing Contaminants in Catchments – Report 4
Annual
Overbank Flow
6,000 ML/day
annual
15
3-5 days
Provide lateral connectivity for exchange of energy and nutrients between in channel and floodplain habitats. Disturbance mechanism and fluvial power to shape and maintain diversity in channel geomorphological characteristics. Maintain and promote recruitment of Yarra Gum communities.
*A ‘fresh’ is a small peak flow event that exceeds the median flow for a given period and lasts several days.
Risk-based Approaches for Managing Contaminants in Catchments – Report 2
16
Environmental flows released after a prolonged dry spell in the river may result in a sudden influx of nutrients and organic material with high biochemical oxygen demand. The organic matter may cause rapid depletion of dissolved oxygen causing hypoxia or anoxia and nutrient influxes may fuel harmful algal blooms or encourage proliferation of aquatic vegetation. Environmental flows released from storages with high levels of dissolved salts or suspended sediments could increase salinity or turbidity and lead to adverse impacts on instream biota. Large overbank flows recommended for the maintenance of lateral connectivity and channel geomorphological processes (Table 1) also carry with them the risk of causing accelerated streambank erosion in highly degraded river sections. The quantities of water available for environmental flows are typically highly variable and it may not be possible for the complete suite of flow recommendations (making up the full flow regime) to be implemented. What then are the benefits (if any) of piecemeal implementation of the environmental flow recommendations? How should river managers allocate the fixed available volumes of water for environmental flows among the competing targets? For instance, should environmental flows be allocated to ‘freshes’ in summer rather than ‘freshes’ in autumn, or for a single high/bankfull flow event in spring rather than a few ‘fresh’ events in spring. Will implementation of certain flow components produce greater relative benefit than others? Or to reframe the perspective, can the implementation of certain flow components reduce the relative risks to particular values? The application of an ERA approach to addressing these management issues is described in the remainder of this report. Scientifically credible management of environmental flows within an ERA framework rests on operationalizing sensitive endpoints that encapsulate ecologically salient as well as socially valued characteristics of ‘river health’. In the ERA framework, these endpoints may be established via stakeholder and scientific input in the processes of problem formulation, hazard identification and assessment and conceptual modelling. These endpoints then need to be formalized in conceptual and quantitative models which explicate our understanding of the interactions between key variables in the system and explicitly represent the uncertainty associated with these factors. These endpoints then need to be monitored using statistically powerful, efficient monitoring programs that will inform about management decisions and the models and assumptions that support them.
4.3
Planning, problem formulation and stakeholder involvement
The risk assessment project team was a multidisciplinary and interagency group of scientists from research and regulatory backgrounds. The team included three scientists from the University of Melbourne (Prof Mark Burgman, Dr Jan Carey and Yung En Chee) and three scientists from the EPA (Claire Putt, David Tiller and Anne-Maree Westbury). Planning for the risk assessment was conducted by the risk assessment team in consultation with a management team at the WCMA comprised of the water program manager (E. Riethmuller), the water quality officer (P. Fennell) and the water resource officer (R. Carter). Details of the members of the risk assessment project team and WCMA management team are given in Appendix 1. As the over-arching objective of the project was to provide decision support to the environmental flow managers, the spatial and temporal context of the problem was essentially circumscribed by the management needs of the WCMA.
Risk-based Approaches for Managing Contaminants in Catchments – Report 4
17
A stakeholder may be defined as a person or organization who may be affected by, or perceive themselves to be affected by a decision, activity or risk. In large scale NRM problems that involve multiple hazards and multiple competing objectives from multiple stakeholders, broad stakeholder involvement is important for ensuring the credibility of the risk assessment process and the acceptability of decisions/proposed solutions. There are various approaches to obtaining stakeholder input to the risk assessment process, including survey mail-outs, opinion polls, interviews (telephone and face-to-face interviews), focus groups, advisory committees and workshops (Borsuk et al., 2001). Stakeholder workshops provide a formal opportunity for stakeholders to state what they want and why and for them to gain some ownership of the problem and process. In the context of this project however, the WCMA, as community-based managers of the EWR, represented the views of the local community and the issues to be addressed by the ERA were of a more technical nature. Since, the nature of the problem was relatively well understood from previous scientific assessments and many of the substantive concerns of the WCMA related to technical issues and uncertainties in physicochemical and ecological responses, the planning and assessment team decided upon expert stakeholder workshops as an efficient method for garnering expert scientific input to the ERA process. Relevant stakeholders were identified through professional contacts and a process of ‘snowballing’. Potential participants were identified from amongst professionals working in the local and regional CMAs (e.g. Wimmera CMA, Glenelg Hopkins CMA and Mallee CMA), the rural water authority (Grampians Wimmera Mallee Water), state resource management agencies (e.g. Fisheries Victoria), state and national environmental research agencies (e.g. Arthur Rylah Institute for Environmental Research, Marine and Freshwater Resources Institute and Murray-Darling Freshwater Research Centre), regulators (EPA) and university-based research scientists (e.g. from the universities of Melbourne, Monash, Sydney, Griffith and Western Australia). Each potential participant (23 in total) was contacted directly, briefed and invited to participate in the workshop. Of these, 14 participated in the workshop. The participation of local and regional natural resource managers provided expert knowledge on local issues and helped to ensure that the assessment addressed publicly meaningful issues. The participation of regulatory authorities and scientific experts in freshwater ecology, hydrology, forestry and environmental management helped to ensure that regulatory obligations and scientific knowledge were incorporated into the assessment. Framing of the problem context was developed in consultation with the WCMA. Background information and data were compiled to produce a background paper, which was circulated prior to the workshop. The specific objectives of the workshop were to: •
canvass specific environmental values in the Lower Wimmera River in order to establish management goals and objectives,
•
identify hazards/threats to these values in the context of environmental flow management;
•
develop conceptual models for cause-effect relationships and/or indirect interactions of the effects of hazards on values (ie. hazard assessment) and
Risk-based Approaches for Managing Contaminants in Catchments – Report 4
•
4.4
18
prioritize key hazards and values requiring more detailed risk analysis and develop a set of candidate assessment endpoints for the risk analysis phase.
Stakeholder workshops
There were a total of 23 attendees at the first workshop held on the 20 July 2004 in Horsham, the major service and commercial centre for the Wimmera region. This included the 14 participants mentioned in the previous section and the nine members of the project team, seven of whom doubled up as expert stakeholders for the workshop. The workshop was mainly facilitated by Yung En Chee, with assistance from Anne-Maree Westbury, Jan Carey and Mark Burgman. The participants included seven natural resource managers from the local and regional CMAs, two officers from Fisheries Victoria, one regional officer from the EPA, and 11 scientists with a range of expertise in hydrology, freshwater ecology, water resource and quality management, ecotoxicology, population ecology, conservation biology, forestry, risk assessment and decision analysis. Details of the list of participants at this workshop are given in Appendix 1. At the commencement of the workshop, an overview was given of the project context, aims and objectives. Participants were invited to briefly introduce themselves, their credentials, professional affiliations and responsibilities within their organizations. This was followed by a presentation on the ERA process by Jan Carey to familiarize participants with the underlying concepts, rationale and motivation for adopting the ERA approach. The presentation explained what ERA was, why it was important and how it might be useful for the problem at hand. The presentation covered issues on risk perception, judgemental biases, sources of uncertainty and the process and techniques used in an ERA to deal with these issues. Three previous studies undertaken to determine environmental flow requirements for the Wimmera River had already produced an extensive list of values which were translated into environmental management objectives for the purposes of environmental flow management (SKM, 2001, 2002a,b). However, the values previously identified related to the Wimerra River in its entirety. So in the workshop, participants were invited to nominate and discuss ecological values specifically associated with the Lower Wimmera River. Values could be entities such as particular species, populations or communities, or characteristics and features such as water quality, in-stream habitat quality or processes such as regeneration of riparian vegetation, sediment transport and nutrient cycling. They could be broad, aggregate and inclusive concepts such as biodiversity or be specific such as a particular fish species or a threatened plant species. Values identified then formed the focus of the hazard identification and assessment phase and ultimately informed the process of developing endpoints for detailed risk analysis. Hazards are events or activities that in particular circumstances can lead to harm or adverse effects. The terms hazards, stressors and threats were used interchangeably during the workshop to refer to all sources of potential adverse effects. Care was taken to minimize linguistic uncertainty by defining values and hazards as precisely and unambiguously as possible, to the extent that the definitions conformed with the perceptions and preferences of
Risk-based Approaches for Managing Contaminants in Catchments – Report 4
19
stakeholders. Hazard identification and assessment in the workshop proceeded through brain-storming, group discussion, hazard matrices and conceptual modelling. The identification of hazards and their assessment depends on an understanding of how a system is believed to work. The diverse pool of participants encompassed a range of different experiences and perspectives on the system and different mental conceptions of cause-effect relationships within the system. Group discussion and the development of conceptual models helped to draw out and visually represent these mental models so that they could be mapped, shared, documented and scrutinized. Hazard matrices were used to depict the interactions between values and hazards arising from natural events or human activities and helped in identifying hazards that could have multiple effects. They also helped to reduce the probability of overlooking interactions. In this way, a more comprehensive list of hazards could be generated. The hazard matrices constituted a visual summary of interactions between values and activities and provided a rudimentary but useful foundation for the hazard assessment phase. Detailed notes and outcomes of the first workshop were organized and summarized. They were then disseminated to all workshop participants for corrections, additions and clarification. Further deliberation took place with a second workshop in Horsham held on the 12 August 2004. There were a total of 11 attendees at the workshop. They included four participants from WCMA, two participants from Fisheries Victoria, four participants from the EPA and myself. The list of participants at the second workshop is given in Appendix 1. This workshop was facilitated by the EPA project team. Feedback from the management team at WCMA indicated that although care had been taken try and minimize linguistic uncertainty in the definition of values and hazards discussed in the first workshop, there was confusion over interpretations of the fundamental concept of environmental flows, in particular, what was understood by the term ‘environmental flow’ and what people thought the role of ‘environmental flows’ should be in river ecosystem management and restoration. The activities in the second workshop included a review of the outcomes of the first workshop, an in-depth discussion of meanings of the term ‘environmental flows’ and what people thought environmental flows could be used to achieve. This helped participants to understand one another’s perspectives and mental models and consequently the assumptions underlying their reasoning. This was followed by further conceptual modelling and extended discussion to select appropriate assessment endpoints for the detailed risk analysis from the list of priority values generated in the first workshop. The list of desirable criteria for endpoints include: (a) social importance and relevance; (b) ecological importance and relevance; (c) a clear and unambiguous operational definition; (d) be measurable and predictable and (e) be susceptible to the hazard (Suter, 1995). Broad guidance on selection of assessment endpoints was provided by the management goal articulated in the Wimmera Regional Catchment Strategy 2003-2008 (WCMA, 2003a) for wetlands and streams in the Wimmera River basin, which states that ‘flow regime and water quality of wetlands and streams in the Wimmera River basin should be sufficient for recreation, stock and domestic purposes while sustaining viable populations of native flora and fauna. Stream courses should not erode at accelerated rates and floodplain management should be sympathetic to natural processes’. Candidate endpoints were reviewed collectively
Risk-based Approaches for Managing Contaminants in Catchments – Report 4
20
in the second workshop and their relative merits deliberated. In selecting assessment endpoints, social relevance was evaluated by the local natural resource managers while scientists provided technical input on ecological relevance, susceptibility to hazards/stressors and operational feasibility of measurement.
4.5
Workshop outcomes
Workshop participants tended to emphasize broad-scale, aggregate values such as a natural flow regime, biodiversity, native endemic plant and animal species and plant communities, diverse biofilm, phytoplankton, benthic and macrophyte communities. Values nominated by individual participants tended to reflect their area of expertise and/or professional responsibility. In particular, WCMA participants strongly identified with their role as managers for broad ‘big picture’ goals such as ‘river health’ and biodiversity and were reluctant to parse these concepts at a finer level of detail. Even as other workshop participants contributed values of a more specific nature, such as particular fish and vertebrate species, concerns were expressed throughout over reductionism and excessive narrowing of objectives. A broad range of hazards arising from natural events such as prolonged drought, fire and algal blooms and human activities such as river regulation, environmental flow management, agricultural practices, urbanization and industrial development were identified in the workshop. Hazards were considered mainly in terms of their potential effects on broad ecological values such as the various aspects of water quality (eg. salinity, dissolved oxygen (DO), nutrient concentrations and turbidity), the quantity and quality of habitat and the abundance and diversity of aquatic and riverine biota. Examples of some of the hazards discussed in the workshop organized by event/activity themes are shown in Table 2. The use of the hazard matrix showing all the potential interactions between potentially hazardous events and activities and ecological values helped workshop participants to appreciate the scale of the problem in a system with multiple values and multiple stressors. Each filled cell in the matrix represented a perceived activity/event-value relationship and was useful for drawing out ‘mental models’ on the pathways by which hazards are believed to adversely affect values. This helped in developing an understanding of which hazards may give rise to a number of adverse effects (and thus may be more important to analyse in detail) and also identified when several hazards may produce the same adverse effect (and promoted consideration of whether they might interact synergistically to exacerbate negative impacts). Time and resource constraints meant that it was not possible to investigate each hazard exhaustively. Conceptual modelling was thus selectively focussed on hazards of particular management concern in the context of environmental flow management. These included natural factors such as prevailing drought conditions, river regulation activities and hazards arising from the provision of environmental flows themselves (Table 2). Conceptual models mapped the various sources of hazard/stressors and the pathways and interactions that led to potentially adverse effects on values. Two themes, ‘biodiversity’ and ‘water quality for sustaining biota’, headed the list of priority values at both stakeholder workshops. The key hazards/threats to biodiversity were identified
Risk-based Approaches for Managing Contaminants in Catchments – Report 4
21
as reduced habitat availability, low DO and salt toxicity. The latter two were also deemed to be the key hazards to water quality for sustaining biota. Physicochemical parameters of water quality are the most commonly measured metrics in river management and conventionally, it has been assumed that if target levels of water quality parameters are attained, the aquatic environment could be considered to be ‘healthy’ (Norris and Thoms, 1999). However, this premise is problematic for the following reasons: •
appropriate parameters might not be measured (eg. measurement only of surface water DO when the problem may lie with bottom water DO),
•
the approach does not take into account possible antagonism or synergism between stressors which may affect aquatic biota (eg. high temperatures and low DO increase the toxicity of ammonia to fish (Alabaster and Lloyd, 1980),
•
spot measurements of parameters which frequently exhibit high natural variability are unlikely to reflect water quality over timescales relevant to aquatic biota and furthermore, may miss intermittent inputs and flood events (Norris and Thoms, 1999; ANZECC/ARMCANZ, 2000), and
•
merely monitoring physicochemical water quality parameters provides no information on other factors that may affect biotic distribution (e.g. quantity of hydraulic habitat, flow velocity, availability of food resources and competitive interactions between biota and/or exotic species).
Water quality is essential and if socially valued as an end in itself is appropriate as an assessment endpoint. However, if the value of water quality is that it provides ecological objectives such as abundance and diversity of biota, then biological entities which integrate the effects of stressors over space and time may be more appropriate assessment endpoints. There is consensus on this point within the scientific community (Norris and Norris, 1995; ANZECC/ARMCANZ, 2000) and it was advocated by many of the scientific stakeholders in the workshop. Surrogates for biodiversity had to be chosen to provide operationally feasible assessment endpoints for risk analysis and subsequent monitoring activities. Candidate endpoints ranging from population level entities such as native fish species (threatened and otherwise) and community level attributes such as macrophyte and macroinvertebrate community diversity were deliberated at length in the second workshop. Discussion focussed on conformance with the desired attributes as well as additional considerations relating to scientific credibility and operational practicality such as availability of baseline data, compatibility with extant protocols for river health monitoring, availability of technology for measurement and monitoring cost-effectiveness. After collective review and deliberation over the relative merits of various candidate endpoints, the two assessment endpoints selected by group consensus, were “sustainable populations of a native fish species” and “macroinvertebrate community diversity”. Freshwater Catfish (Tandanus tandanus) was the focal species selected to represent the former endpoint. Table 3 summarizes the selection rationale and their congruence with required attributes for assessment endpoints.
Risk-based Approaches for Managing Contaminants in Catchments – Report 2
Table 2:
22
Examples from the workshop of some of the hazards identified and the assessment of their potential effects
Event/Activity
Hazard/Threat/Stressor
Potential primary effects
Potential secondary effects
Increased input of sediment and particulate matter
Increased turbidity levels and reduced light penetration in water column
Reduced primary productivity in deeper waters
Natural Event Fire in riparian zone
Transport into waterway of contaminants bound to particulate matter
Loss of riparian habitat
Smothering of benthic biota
Acute toxic effects/indeterminate sublethal effects on aquatic biota
Reduced feeding efficiency of filterfeeding and visual feeding biota
Reduced abundance and/or diversity of benthic community
Burial of structural habitat features such as gravel and coarse debris
Loss of benthic feeding, refuge and spawning habitat
Reduced riparian habitat Reduced connectivity between aquatic and terrestrial ecosystems Prolonged drought
Extended period of low/zero flow Loss of longitudinal hydrologic connectivity Lack of overbank flows -> loss of lateral hydrologic connectivity, loss of channelfloodplain exchange mechanism
Saline groundwater intrusion
Increased salinity
Reduced quantity and quality of physical instream hydraulic habitat Reduced quantity and quality of floodplain wetland habitat Reduced productivity of riverinefloodplain ecosystem
Acute toxic effects/indeterminate sublethal on aquatic biota
Reduced abundance and/or diversity of aquatic biota
Reduced abundance and/or diversity of riverine and floodplain biota
Reduced abundance and/or diversity of aquatic biota
Risk-based Approaches for Managing Contaminants in Catchments – Report 4
intrusion
23
sublethal on aquatic biota Salinity induced density stratification
aquatic biota
Lack of vertical mixing of water column leading to development of hypoxia/anoxia Reduced quantity and quality of physical in water column and bottom sediments instream hydraulic habitat Build up of toxic levels of ammonia and hydrogen sulphide due to activity of anaerobic bacteria Lack of vertical mixing resulting in increased residence time of algae in euphotic zone
Increased rates of nitrogen and phosphorus mineralization which may fuel algal blooms Algal blooms
High temperatures in summer
Temperature induced density stratification
Lack of vertical mixing of water column Reduced quantity and quality of physical leading to development of hypoxia/anoxia instream hydraulic habitat in water column and bottom sediments Build up of toxic levels of ammonia and hydrogen sulphide due to activity of anaerobic bacteria
Lack of vertical mixing resulting in increased residence time of algae in euphotic zone Occurrence of algal bloom
Reduced light penetration Algal bloom is harmful
Reduced primary productivity in deeper waters Illness/death of biota that graze on algae that produce toxins
Increased rates of nitrogen and phosphorus mineralization which may fuel algal blooms Algal blooms
Bioaccumulation of toxins in taxa/organisms at higher trophic levels Die-off of algal bloom may produce DO ‘sag’.
Risk-based Approaches for Managing Contaminants in Catchments – Report 4
24
Injury/death of fish via gill and tissue damage caused by algal species that have physical structures such as spines (eg. some diatoms, dinoflagellates and raphidophytes.)
‘sag’.
Reduced quantity and quality of physical instream hydraulic habitat
Reduced abundance and/or diversity of aquatic biota
River Regulation Activities Abstraction, diversion and distribution
Reduced flow magnitude in all seasons
Reduced quantity and quality of seasonally inundated low-lying backwater and anabranch habitat
Reduced frequency and duration of cease-to-flow events -> loss of disturbance mechanism
Reduced diversity of benthic community
Proliferation of monospecifc stands of Excessive baseflow stability - aquatic vegetation (eg. Azolla spp., > loss of flow variability Phragmites australia and Typha spp.)
Reduced diversity of macrophyte community
Impacts on life-history strategies of native Reduced diversity of instream structural habitat aquatic biota (eg. loss of spawning cues) Respiratory requirements of large standing crop can create hypoxic conditions before sunrise and during days of overcast weather.
Risk-based Approaches for Managing Contaminants in Catchments – Report 4
25
May favour establishment and proliferation of exotic species
Die-off of large standing crop of aquatic vegetation may produce DO ‘sag’. Impaired survival, competitive ability and reproduction of affected biota. Reduced abundance and/or diversity of native biota
Leakage from Wimmera-Mallee distribution system
Raised water table -> reduced Reduced diversity of benthic community frequency and duration of cease-to-flow events -> loss of disturbance mechanism Excessive baseflow stability > loss of flow variability Proliferation of monospecifc stands of aquatic vegetation (eg. Azolla spp., P. australia and Typha spp.)
Reduced diversity of macrophyte community
Reduced diversity of instream structural Impacts on life-history strategies of native habitat aquatic biota (eg. loss of spawning cues) Respiratory requirements of large standing crop can create hypoxic conditions before sunrise and during days of overcast weather. Die-off of large standing crop of aquatic vegetation may produce DO ‘sag’. May favour establishment and proliferation of exotic species
Impaired survival, competitive ability and reproduction of affected biota. Reduced abundance and/or diversity of native biota
Risk-based Approaches for Managing Contaminants in Catchments – Report 4
26
Environmental Flow Management ‘Fresh’ magnitude too large
Sudden purging of saline pools containing highly saline, bottom waters containing low DO and/or low pH and/or high levels of ammonia/hydrogen sulphide
Acute toxic effects/indeterminate sublethal effects on aquatic biota
Flow release allocated from storage with high levels of salinity
Input of water with high levels of salinity
At best, no improvement in water quality, at worst, acute toxic effects/indeterminate sublethal effects on aquatic biota
Flow release allocated from distant storage within the WimmeraMallee system
Flow magnitude diminished through seepage and evaporative losses -> extended period of low/zero flow
Reduced quantity and quality of physical instream hydraulic habitat
Reduced abundance and/or diversity of aquatic biota
Reduced quantity and quality of physical instream hydraulic habitat
Reduced abundance and/or diversity of aquatic biota
Reduced quantity and quality of physical instream hydraulic habitat
Reduced abundance and/or diversity of aquatic biota
Loss of longitudinal hydrologic connectivity Lack of water for environmental flow release
Extended period of low/zero flow Loss of longitudinal hydrologic connectivity
Flow delivery impeded Extended period of low/zero by council weir pool flow management (eg. to maintain full weir pools for recreation)
Risk-based Approaches for Managing Contaminants in Catchments – Report 4
27
management (eg. to Loss of longitudinal maintain full weir pools hydrologic connectivity for recreation) Flow delivery absorbed by water users with private entitlements
Extended period of low/zero flow Loss of longitudinal hydrologic connectivity
Reduced quantity and quality of physical instream hydraulic habitat
Reduced abundance and/or diversity of aquatic biota
Risk-based Approaches for Managing Contaminants in Catchments – Report 4
Table 3:
28
Evaluation of the selected endpoints “sustainable populations of Freshwater Catfish” and “macroinvertebrate community diversity” with respect to congruence with required attributes of assessment endpoints
Endpoint Attribute Social importance and relevance
Sustainable populations of Freshwater Catfish
Macroinvertebrate Community Diversity
Highly-valued native species; listed under the Flora and Fauna Guarantee Act 1988; classified as ‘Endangered’ in Advisory List of Threatened Vertebrate Fauna in Victoria (DSE 2003a).
Macroinvertebrate community diversity is relatively well appreciated by the community due to national awareness programs such as Waterwatch.
Recreationally important.
Indices of macroinvertebrate community are a required component of ecological objectives in the State Environmental Protection Policy (Waters of Victoria) (SEPP WoV).
Macroinvertebrate communities have been judged to have Although non-endemic in the region, it has established sufficient credibility to be used in federal and state self-sustaining populations in the Lower Wimmera environmental monitoring frameworks for reference River which now constitutes a stronghold for the species condition monitoring (eg. in National River Health in Victoria. monitoring and the Victorian Index of Stream Condition).
Ecological importance and relevance
Species is of high conservation value.
Macroinvertebrate community represents a critical Occupies bottom waters prone to water quality problems pathway for the transport and utilization of energy and which managers hope to address through environmental aquatic matter in aquatic ecosystems (Carmargo 2004) flow management.
Susceptible to hazards/stressors
Species has declined in abundance and distribution throughout its natural range in Victoria, but specific stressors which might account for this have not been established (Clunie and Koehn 2001). Monitoring is required to establish response to flow regime and water quality changes effected by environmental flow strategies.
There is considerable evidence that macroinvertebrate assemblages can be useful indicators of high nutrient input or pollutants and contaminants (Mebane 2001; Chessman 2003). However, there is little information on how invertebrates might respond to changing flow regimes (SKM 2003a). Monitoring is required to establish response to flow regime and water quality changes effected by environmental flow strategies.
Risk-based Approaches for Managing Contaminants in Catchments – Report 4
29
effected by environmental flow strategies. Operational definition
Can be framed clearly and unambiguously.
Can be framed clearly and unambiguously.
Measurement feasibility
Sampling of Freshwater Catfish to estimate demographic parameters for quantifying viability may be time-consuming and costly. Monitoring of fish communities has not occurred in any regular program, but programs are under development (DNRE 2002b). Some quantitative survey data exists from previous studies. Angler reports and annual results from fishing competitions held along the Lower Wimmera River are a potential source of useful data.
Ubiquitous and relatively easy to collect. Standardized sampling and processing protocols are well-developed and taxonomic keys are available to identify most macroinvertebrates. Component of routine river health monitoring programs in Victoria. Good, baseline data exists from monitoring carried out by the EPA.
Risk-based Approaches for Managing Contaminants in Catchments – Report 2
30
Selection of assessment endpoints was a difficult exercise because the Lower Wimmera River is highly degraded and relatively depauperate in terms of socially important aquatic and riverine biota. Uncertainty regarding the susceptibility of each assessment endpoint to relevant hazards and stressors is an important limitation and arises from incomplete scientific understanding. Susceptibility is a function of exposure to the hazard/stressor and sensitivity to direct as well as indirect adverse effects of the hazard/stressor and consideration of susceptibility itself requires a qualitative or simple quantitative hazard assessment (Suter, 1995). An anticipated difficulty in interpreting measurement of the endpoints is that the natural variability of physical and biological components of semi-arid, intermittent rivers is very high (Boulton, 1999). This variability has been documented for the macroinvertebrate community in the Wimmera River (Metzeling, 2002). The amount of variability could make it difficult to discern what effects, if any, environmental flows might have. The effect of multiple stressors interacting in complex and often non-linear ways over different spatial and temporal timescales makes it difficult to untangle and definitively establish causal relationships for observed impacts. In addition to these uncertainties, environmental flow management in the context of a complex distribution system like the Wimmera Mallee system needs to take into account logistical constraints. Consequently, it would be advantageous if we could develop a knowledge base of how equivalent environmental outcomes might be achieved (within limits of acceptable risk) for different patterns of flow deployment. This would provide valuable flexibility in the operational management of the EWR. The characteristics of the problem suggests a need for an adaptive management and decision analytic approach that provides requisite information to discriminate between competing hypotheses that constitute the underlying rationale for management interventions, incorporates tools for investigating and evaluating management alternatives and explicitly takes risks and uncertainty into account. A Bayesian Network model for Freshwater Catfish in the Lower Wimmera River was developed to provide a risk-based decision tool for the management of environmental flows in the Lower Wimmera River.
Risk-based Approaches for Managing Contaminants in Catchments – Report 4
31
5.
Development of the Bayesian network model for Freshwater Catfish in the Lower Wimmera River
5.1
Bayesian network modelling
Bayesian networks (BNs) (also known as Bayes nets, Bayesian belief networks, causal probability networks and probability networks) are well suited to the task of modelling a situation in which causality plays a role, but where our understanding is incomplete, so we need to describe events probabilistically (Charniak, 1991). Bayesian methods provide a formalism for reasoning about beliefs under conditions of uncertainty. In this formalism, propositions are given numerical parameters signifying the degrees of belief accorded them under some body of knowledge and the parameters are combined and manipulated according to the rules of probability (Pearl, 1991). Good introductions to BNs are available in Neapolitan (1990), Pearl (1991), Jensen (1996) and Pearl (2000). The use of BN models is well-developed in the fields of knowledge engineering, software engineering and artificial intelligence (Neil et al., 2000; Fenton and Neil, 2001). Recent applications in ecological management include modelling a restoration strategy for a temperate lake in Finland, modelling salmon fisheries management in the Baltic Sea (Varis and Kuikka, 1999), evaluating fish and wildlife population viability under land management alternatives (Marcot et al., 2001), evaluating land management alternatives on salmonid populations and habitat in the Columbia River Basin (Rieman et al., 2001) and modelling estuary eutrophication in the Neuse River in North Carolina, USA (Borsuk et al., 2004). A Bayesian Network is a directed acyclic graph consisting of a set of nodes and a set of directed arcs, which allows the representation of a complex causal chain linking events/actions to outcomes (Pearl, 2000). Random variables can be either discrete or continuous and are represented by nodes. Uncertainty is represented by specifying probability distributions for the variables. Causal relations between variables within the domain are denoted by arc connections between nodes and signify conditional dependence (not absolute causal relations). Conversely, the absence of arcs between two nodes signifies conditional independence between the two random variables. Nodes without incoming arcs are known as ‘parent’ nodes and are described by marginal probability distributions. Nodes with incoming arcs are known as ‘child’ nodes. The relationships between nodes are defined by conditional probability functions. When the variables are discrete, the conditional probability function takes the form of conditional probability tables (CPTs) (also called link matrices). A CPT describes the likelihood of the states of a node given the states of the node’s immediate predecessors. It contains entries for every possible combination of states of a node’s parents. The CPTs must be specified for the joint condition and incorporate any interactions that might exist. When the variables are continuous, the relationships between linked nodes are described by conditional probability density functions, which express the joint probability distribution of a node’s parents. The conditional independence implied by the absence of a connecting arc between any two nodes greatly simplifies the modelling process because it permits a modular approach in which separate submodels can be developed to quantify each relationship indicated by the
Risk-based Approaches for Managing Contaminants in Catchments – Report 4
32
presence of an arc (Pearl, 2000; Borsuk et al., 2004). Submodels may be derived from any combination of process knowledge, statistical correlation or expert judgement depending on the type and scale of information available (Borsuk 2004; Borsuk et al. 2004). Similarly, CPTs can be constructed using empirical data, output from process models, theoretical insight, probabilistic or deterministic functions, ancillary data from empiric studies independent of the constructed system, and expert judgements (Reckhow, 1999b; Lee, 2000; Borsuk et al., 2001; Cain, 2001. Generation of CPTs from functional relationships uses Monte Carlo simulation to draw representative samples from a node’s predecessors, to build up a discrete conditional distribution of the node based on the functional relationship. With the model fully specified and validated, the BN model can be used to produce probability distributions (or risk profiles) for model endpoints and any other variables of management interest for both inference and prediction. This is basically performed by altering the states of some nodes in accordance with observations/findings or proposed interventions while observing the effect this has on model endpoints. The impact of changing any variable is transmitted throughout the network in accordance with the relationships encoded in the CPTs and the joint probability distribution of the entire network conditioned on these observations is inferred or calculated for other variables using Bayes’ Theorem (Pearl, 1991). BN modelling is useful because the process of formal identification of system variables and interactions forces model builders to articulate, structure and thereby clarify their understanding, not only of the relevant influences on management objectives, but of the nature of the problem itself. The graphical structure of BNs provides a compact way of depicting and communicating substantive assumptions and relationships between variables and facilitates economical representation of joint probability functions and efficient inferences from observations (Pearl, 2000). The simplicity and intuitiveness allows alternative models representing different plausible explanations and competing hypotheses to be constructed easily, thus providing a means of enhancing the quality of causality assessments (see Newman and Evans (2002) and Stow and Borsuk (2003) for more detail). Because BN models can be constructed through combination and/or synthesis of information and data from a range of sources and of varying formats (eg. categorical, ordinal scale and continuous data), it provides an effective technique for making use of existing knowledge. It also provides a coherent framework which is easily updatable to incorporate new evidence. The ability to use the models interactively enables decision makers and stakeholders to explore the potential benefits and risks of management alternatives and this facilitates learning which is particularly important in complex systems fraught with uncertainty (Borsuk et al., 2001). Freshwater Catfish typically occupy bottom waters that are prone to water quality problems, which catchment managers hope to address through the appropriate management of environmental flows. So in addition to the importance of the viability of Freshwater Catfish populations as management objectives in their own right, it was hoped that Freshwater Catfish might also serve as a useful indicator of in-stream conditions, a surrogate for the broader community of aquatic biota. The viability of Freshwater Catfish populations in the Lower Wimmera River was thus designated as an assessment endpoint for the Bayesian Network.
Risk-based Approaches for Managing Contaminants in Catchments – Report 4
5.2
33
Overview of the development and construction of the Freshwater Catfish BN
The two main tasks in BN modelling are construction of a graphical structure and construction of CPTs for each node. Developing the graphical structure involves formal, systematic identification of system variables and interactions and well-founded decisions for what variables and values to include and omit from the network (Batchelor and Cain, 1999; Coupé et al., 2000). For the Freshwater Catfish BN key variables and the nature of their dependencies were identified and refined through: •
the workshop process of hazard/threat identification,
•
the workshop process of conceptual model construction,
•
a review of the environmental flow recommendations documented in the ‘Stressed Rivers Project: Environmental Flows Study’ (SKM, 2002a),
•
a comprehensive survey of the relevant literature, and
•
consultations with fisheries managers and experts in hydrology, freshwater ecology and Freshwater Catfish biology.
The sources above were used along with practical BN modelling guidelines provided in Cain (2001) to develop a model linking Freshwater Catfish population characteristics with the summer flow regime in the Lower Wimmera River. As the purpose of the model was prediction for decision analysis and support, it was important that the model should not be overly detailed (Reckhow, 1999b). Rather, the emphasis was on producing a parsimonious yet realistic model. The guiding principle therefore was to include only those variables and relationships, which contribute to the ability to predict ecosystem attributes of management relevance (Borsuk et al., 2004). Each node in drafts of the graphical BN model was systematically reviewed to determine if the variable it represented was either (a) controllable; (b) predictable or (c) observable at the scale of the management problem. To formalize the graphical model as a BN model, variables had to be clearly defined, be observable and testable. The definition of model variables, the states included and the placement of break-points (in the case of continuous variables) was established using the relevant literature and in consultation with technical experts. Probabilities for CPTs of the various model variables were specified using a combination of empirical data, output from process models, functional relationships, theoretical insight, ancillary data from empiric studies independent of the constructed system, and expert judgements. Although the approach has been described in a linear manner, the development of the graphical model and construction of CPTs for each node in the model proceeded in parallel and in an iterative manner. The process of developing submodels using available data and information to quantify conditional dependencies between variables often led to rethinking and refinement of the graphical structure.
Risk-based Approaches for Managing Contaminants in Catchments – Report 4
34
BN modelling was carried out using the software Netica (Norsys Software Corp. 19972003). Netica uses junction tree algorithms to perform probabilistic inference (Norsys, 1997). Details on computation and algorithms used in Netica are available in Neapolitan (1990) and Spiegelhalter et al. (1993).
5.3
Stakeholder considerations in BN model development
The objective of constructing the BN model was to capture understanding of how flow conditions are believed to affect key in-stream physicochemical and habitat variables governing Freshwater Catfish population structure and viability. The temporal focus of the model is the summer period when environmental conditions are expected to be most stressful for in-stream aquatic biota and when catchment managers are typically required to make decisions about the deployment of environmental flows. In the course of the risk assessment workshops, during which a large number of hazards were considered, it became clear that the factors that stakeholders believed were most important with respect to maintaining self-sustaining populations of fish were the quantity and quality of in-stream habitat as determined by the magnitude, timing and duration of flows. With respect to water quality, the importance of turbidity, pH and concentrations of nitrogen and phosphorus were acknowledged, but it was believed that ultimately the two most important aspects were dissolved oxygen (DO) and salinity. There was an expectation that providing (minimum) flows over summer would increase the quantity of available aquatic habitat and enable access to alternative habitat if conditions within a pool become unfavourable. However, the benefits of minimum flows of various magnitudes, in terms of increased habitat and improved hydrological connectivity, were not well understood. It was also believed that providing periodic ‘freshes’ would help to maintain or improve water quality by overcoming stratification problems through mixing or dilution of pools that would otherwise be stagnant or sluggish over the summer period. However, there was uncertainty over how to manage the magnitude, frequency and duration of ‘freshes’. If ‘freshes’ are too small, they might be ineffective. But if they are too large, they might flush toxic bottom waters from pools (particularly saline ones) up into the water column, leading to potentially detrimental ‘slug’ events as well as potentially causing secondary progression of saline water which might then induce salinity stratification at a downstream location. Thus a further critical consideration was how to assess the potential benefit of providing ‘freshes’ against the potential risk of lethal or sublethal impacts to aquatic organisms. It was suggested that a compromise solution may be to target ‘freshes’ at maintaining a minimum standard of water quality in the upper layers of the water column and confine stratified sections to isolated pools. However, there is uncertainty over the appropriate magnitude of ‘freshes’ required to achieve this outcome. These concerns were taken into account in the construction of the BN model.
5.4
Biological and biophysical processes
To construct a biological and ecological knowledge base for the development of the Freshwater Catfish BN model, existing information on Freshwater Catfish biology was
Risk-based Approaches for Managing Contaminants in Catchments – Report 4
35
collated and reviewed. In general, Freshwater Catfish appear to be relatively long-lived, hardy and extremely tolerant of poor physicochemical conditions. They favour slow, sluggish waters and spawn and develop in carefully tended nests constructed in shallow waters. Detailed results from the review are summarized in Chee (2005). The phenomenon of density stratification, bottom water deoxygenation and conclusions from previous work done on salinity and thermal stratification in the Lower Wimmera was also reviewed. The detailed review is available in Chee (2005). A summary of the review follows. In the Lower Wimmera River, both thermal and salinity stratification occur. Thermal stratification is extensive and affects a much greater proportion of the river than salinity stratification (Anderson and Morison, 1988b). It is persistent during summer, but also occurs for shorter periods in autumn (Western and Stewardson, 1999). Salinity stratification develops most often as a consequence of saline groundwater seeping directly into river pools, and less frequently as a consequence of saline inflows to a relatively fresher pool from an upstream source (Anderson and Morison, 1988b; Western, 1994). Salinity stratification is therefore largely dependant on the presence of sites of saline groundwater intrusion, which may be very localized. Sites of groundwater intrusion characteristically have well-developed, persistent stratification of the water column and where significant groundwater intrusion occurs, salinity stratification will persist most of the year, particularly under low flow conditions (Anderson and Morison,, 1988b; Western, 1994; Western et al., 1996; SKM, 1997) but also under moderate flow events (Ryan et al., 1999). The relationships between salinity and temperature induced stratification, flow velocity and bottom water DO status are complex and not well understood. Further complications arise at sites, which are both thermally and salinity stratified. In a study of thermal stratification in the Wimmera and Glenelg Rivers, Western and Stewardson (1999) found that in pools which were only thermally stratified, cross-sectional flow velocities above 0.01 m/s, maintained over a 24 hour period, were sufficient to achieve full mixing and de-stratification. With destratification, bottom water DO would be expected to improve. However, analysis of data collected in previous studies on saline pools in the Lower Wimmera suggested that at sites that were only thermally stratified, flow velocities which may not be large enough to remove thermal stratification, may nonetheless produce improvements in subsurface DO status (see Chee, 2005). At sites that are both thermally and salinity stratified, flow velocities above 0.01 m/s may destroy thermal stratification without affecting salinity stratification (see Chee, 2005). Under such conditions however, the improvements to bottom DO may only be negligible. Rapid mixing of salinity-stratified pools, has been documented at flow velocities ranging from about 0.03-0.08 m/s (A. Western, unpublished data). However, once high flows cease and flows return to low levels, salinity stratification re-establishes rapidly, usually in a matter of days (Western, 1994).
Risk-based Approaches for Managing Contaminants in Catchments – Report 4
5.5
36
Graphical structure of Freshwater Catfish BN
The spatial boundary of the model encompasses an approximately 62 km reach of the Lower Wimmera River, from the junction of the Wimmera and McKenzie Rivers to Big Bend. This reach was chosen because it is known to be inhabited by Freshwater Catfish, it contains known sites of saline pools and cross-section profile elevation data are available for developing flow, depth and cross-section area relationships. The model is focussed on environmental conditions during summer and the model endpoint is the viability of Freshwater Catfish populations within the specified river reach. The full graphical Bayesian probability network model linking summer flow regime to Freshwater Catfish populations in the Lower Wimmera River is shown in Figure 5. The graphical BN model was structured according to the main conceptual ideas as follows: •
The viability of Freshwater Catfish populations in the focal reach (Viability of Catfish Popn) is determined by the abundance of the breeding population (Abundance Breeding Popn) and the recruitment of juvenile and larval catfish (Recruitment Juvenile Catfish and Recruitment Larval Catfish). These population characteristics are in turn dependent on the quantity and quality of physical hydraulic habitat for living (Hydraulic Habitat) and spawning (Spawning Area Availability) and on stochastic elimination via adverse ‘slug’ events (Severity of ‘Slug’ Event), and in the case of larval catfish, via high flow velocities (Peak XS Velocity) as well. This is depicted by the graphical structure in Box A in Figure 5.
•
The quantity and quality of physical hydraulic habitat (Hydraulic Habitat) is determined by a combination of flow cross-sectional area (XS Area) and bottom water quality (Bottom Water Quality), while the severity of ‘slug’ events (Severity of ‘Slug’ Event) depends on bottom water quality (Bottom Water Quality) and the peak crosssectional flow velocity (Peak XS Velocity) experienced over the summer period.
•
Bottom water quality (Bottom Water Quality) is determined by the interaction between bottom salinity (Bottom Salinity), bottom DO (Bottom DO) status and the maximum interval between mixing events (Max Interval Betw Mix Evts) which are expected to have an ameliorating influence on bottom water quality (Box B in Figure 5).
•
Bottom salinity (Bottom Salinity) is predicted from the extent of groundwater intrusion (Extent of Grdwater Intrusion) and the observed range of bottom salinity (Obs Range Bottom Salinity) within the focal reach (Box C in Figure 5). Bottom DO (Bottom DO) is predicted on the basis of stream depth (Depth) which in turn depends on the median mean daily flow (MDF) (Median Mean Daily Flow (MDF)) over summer (Box D in Figure 5). The maximum interval between mixing events (Max Interval Betw Mix Evts) is controlled by the frequency of occurrence of flow velocities sufficient to produce full mixing of unstratified or thermally stratified waters and depends on the pattern of summer flow distribution of median MDF (Mixing due to Median MDF) and ‘freshes’ (Mixing due to ‘Freshes’ and Fresh Freq) (Box E in Figure 5).
The main flow components of the summer flow regime that are amenable to management are the cease-to-flow period, minimum flows and ‘freshes’. Minimum flows are represented in
Risk-based Approaches for Managing Contaminants in Catchments – Report 4
37
the model by the median MDF over the summer period. ‘Freshes’ are defined as small peak flow events that exceed the summer median MDF and several may occur over the summer period. Both ‘fresh’ frequency and magnitude have been included in the model. Flush flow refers to the largest flow event experienced over the summer and is considered to be a stochastic event with potentially detrimental impacts on Freshwater Catfish. The full model consists of 22 nodes and 35 arcs. A summary of model variable definitions, metrics, states and sources for constructing probability models is presented in Table 4. Full details of model components and the construction of their CPTs are available in Chee (2005).
Box C
Extent of Grdwater Intrusion
Median Mean Daily Flow (MDF)
Box D Depth Distribution
Box E
Mixing due to Median MDF
Obs Range Bottom Salinity
XSArea Distribution Fresh Magnitude
Mixing due to 'Freshes '
Bottom DO
Bottom Water Quality
Bottom Salinity
Fresh Freq
Max Interval Betw Mix Evts
Box B
Flush Magnitude
Peak XS Velocity
Hydraulic Habitat
Severity of 'Slug' Event Spawning Area Availability
Abundance Breeding Popn
Recruitment Juvenile Catfish Recruitment Larval Catfish
Viability of Catfish Popn
Figure 5:
Box A
Bayesian network model for Freshwater Catfish in the Lower Wimmera River
Risk-based Approaches for Managing Contaminants in Catchments – Report 2
Table 4:
Summary of model variable definitions, states and sources of information and/or data used to discretize variables and construct probability models
Model Variable
Model Variable Definition
Median Mean Daily Flow (MDF)
Median mean MDF0: 0 ML/day daily flow over MDF5: 5 MlL/day summer MDF10: 10 ML/day
Variable States: Names & Descriptions
Node Parents
Purpose/Usage of Variable in the Model Info source for discretizing variable and/or specifying probability model
None
Characterizes and summarizes the minimum flow conditions experienced in the nominated reach over summer. Determines stream depth distribution over the reach. Also used to assess the maximum interval between mix events.
Time series flow data measured at Horsham gauge 415200 (19452001 inclusive): (10)
Median Mean Daily Flow (MDF)
Depth is used as a variable for predicting the status of bottom DO and the availability of spawning area for Freshwater Catfish over the reach.
Data, hydraulic model, empirical probability model: (9)
Median Mean Daily Flow (MDF)
Cross-sectional area is used as index of the quantity of physical hydraulic habitat. It is also used to calculate flow velocities for the peak cross-sectional velocity variable and to determine whether or not mixing occurs due to median MDF and ‘freshes’.
Data, hydraulic model, empirical probability model: (9)
MDF20: 20 ML/day MDF30: 30 ML/day
Depth
38
Distribution of stream depths over the reach
VShal: < 1.0 m Shal: 1.0m – 2.0 m Mod: 2.0 m – 2.5 m Deep: >2.5 m
XS Area
Distribution of flow crosssectional area over the reach
A_0to20: 0-20 m2 A_20to40: 20-40 m2 A_40to80: 40-80 m2
Risk-based Approaches for Managing Contaminants in Catchments – Report 4
39
whether or not mixing occurs due to median MDF and ‘freshes’.
A_80to120: 80-120 m2 A_120to160: 120-160 m2 A_160to200: 160-200 m2 A_mt200: >200 m2 Extent of Groundwa ter Intrusion
Extent of saline groundwater intrusion
Low: 0-5% of river section affected
None
Estimates the extent of groundwater intrusion as a precursor to assessing bottom water salinity.
Data: (2), (8)
None
Characterizes the observed range of bottom salinity values within a particular river section. Used in conjunction with the extent of groundwater intrusion to assess bottom salinity.
Data: (1), (3), (4), 5), (8)
Extent of Groundwater Intrusion
Characterizes bottom salinity conditions Analyst over summer within the reach of judgement interest. Bottom salinity is an important factor in the assessment of bottom water quality.
Mod: 5-10% of river section affected High: > 10% of river section affected
Obs Range Observed Bottom range of Salinity bottom salinity (as measured by electrical conductivity below the halocline)
Good: ≤ 3,000 EC
Bottom Salinity
Good: ≤ 3,000 EC
Salinity as measured by electrical conductivity of water below the halocline
Okay: 3,000-12,000 EC Poor: 12,000-20,000 EC Very Poor: > 20,000 EC
Okay: 3,000-12,000 EC Poor: 12,000-20,000 EC Very Poor: > 20,000 EC
Obs Range Bottom Salinity
Risk-based Approaches for Managing Contaminants in Catchments – Report 4
the halocline
40
Salinity
Bottom DO
Bottom dissolved oxygen concentration (% saturation)
Stressful: ≤10% sat.
Fresh Magnitude
Magnitude of summer ‘freshes’
F20: 20 ML/day
Depth
Characterizes bottom DO conditions Data, empirical over summer within the reach of relationship: (1), interest. Bottom DO is an important (3), (5) factor in the assessment of bottom water quality.
None
Allows exploration of the effects of employing ‘freshes’ of different magnitudes. Needs to be used in conjunction with ‘Fresh Freq’ node.
User-defined
None
Allows exploration of the effects of deploying ‘freshes’ at different frequencies. Needs to be used in conjunction with ‘Fresh Magnitude’ node.
User-defined
Median Mean Daily Flow (MDF)
Mixing events are expected to have an ameliorating effect on bottom water quality over summer. Mixing of thermally stratified waters occurs due to flow-related turbulence when flow velocities are sufficiently high. This variable characterizes the probability that mixing occurs due to median MDF over summer. The flow velocity criteria used to determine the probability of
Data, functional relationship, empirical relationship: (6), (11)
Okay: > 10% sat.
F40: 40 ML/day F80: 80 ML/day F115: 115 ML/day F150: 150 ML/day F190: 190 ML/day F240: 240 ML/day
Fresh Freq
Frequency of occurrence of ‘freshes’ over summer
NoFr: 0 freshes Fr_x1: 1 fresh Fr_x2: 2 freshes Fr_x3: 3 freshes Fr_x4: 4 freshes
Mixing due to Median MDF
Occurrence of mixing as a result of median MDF for any given cross-sectional area
Yes No
Risk-based Approaches for Managing Contaminants in Catchments – Report 4
MDF
median MDF for any given cross-sectional area
(MDF) XSArea
Mixing due to ‘Freshes’
Occurrence of mixing as a result of ‘freshes’ for any given cross-sectional area
Yes
Max Interval Betw Mix Evts
Maximum interval between mixing events for any given cross-sectional area
Int_0to21: 0-21 days
No
Fresh Magnitude XSArea Distribution
Int_22to28: 22-28 days
Mixing due to Median MDF
Int_29to35: 29-35 days
Fresh Freq Mixing due to ‘Freshes’
41
thermally stratified waters occurs due to flow-related turbulence when flow velocities are sufficiently high. This variable characterizes the probability that mixing occurs due to median MDF over summer. The flow velocity criteria used to determine the probability of mixing are discussed in greater detail in Chee (2005).
relationship: (6), (11)
Mixing events are expected to have an ameliorating effect on bottom water quality over summer. Mixing of thermally stratified waters occurs due to flow-related turbulence when flow velocities are sufficiently high. This variable characterizes the probability that mixing occurs due to ’freshes’ over summer. The flow velocity criteria used to determine the probability of mixing are discussed in greater detail in Chee (2005).
Data, functional relationship, empirical relationship: (6), (11)
Mixing events are expected to have an Functional ameliorating effect on bottom water relationship quality over summer. The effectiveness of this depends upon the length of time between mix events and is characterized by the maximum interval between events.
Risk-based Approaches for Managing Contaminants in Catchments – Report 4
Bottom Water Quality
42
cross-sectional area
Int_mt35: > 35 days
‘Freshes’
by the maximum interval between events.
Descriptive indicator of bottom water quality
Poor: habitable by adult Freshwater Catfish but low in terms of food productivity and likely to be harmful to eggs and larval catfish
Bottom Salinity
Synthetic variable that characterizes bottom water (in the terms defined), on the basis of bottom salinity, bottom DO and the maximum interval between mix events. Used in conjunction with crosssectional area to rate hydraulic habitat.
Process knowledge, analyst judgement
Synthetic variable that characterizes hydraulic habitat on the basis of quantity (as indicated by cross-sectional area) and quality (as indicated by bottom water quality).
Process knowledge, analyst judgement
Okay: habitable by Freshwater Catfish (& other aerobic biota), moderate in terms of food productivity and not detrimental to eggs and larval catfish
Bottom DO Max Interval Betw Mix Evts
Good: habitable by Freshwater Catfish (& other aerobic biota), good in terms of food productivity and provides favourable physicochemical conditions for eggs and larval catfish Hydraulic Habitat
Descriptive indicator of hydraulic habitat
Low
XSArea
Mod
Bottom Water Quality
Risk-based Approaches for Managing Contaminants in Catchments – Report 4
Flush Magnitude
habitat
High
Magnitude of the peak flow event over summer
F0to300: 0-300 ML/day
43
area) and quality (as indicated by bottom water quality).
judgement
None
Characterizes the distribution of annual summer peak flow events. In other words, the probability of occurrence of peak flow events of varying magnitudes each summer (ie. on an annual basis).
Time series flow data measured at Horsham gauge 415200 (19452001 inclusive) and empirical probability model: (10)
Fresh Magnitude
Characterizes the peak cross-sectional flow velocity experienced over summer, whether as a result of ‘freshes’ or a flush event. Used in conjunction with bottom water quality to assess the severity of ‘slug’ events. Also an important factor in assessment of the recruitment success of larval catfish.
Functional relationship,
Synthetic variable that characterizes the severity of a ‘slug’ event on the basis of bottom water quality status and mean cross-sectional peak velocity.
Analyst judgement
F300to600: 300-600 ML/day F600to1200: 600-1,200 ML/day F1200to3000: 1,200-3,000 ML/day F3000to6000: 3,000-6,000 ML/day Fmt6000: > 6,000 ML/day
Peak XS Velocity
Peak crosssectional flow velocity experienced over summer
Low: < 0.05 m/s Mod: 0.05-0.08 m/s High:> 0.08 m/s
Severity of Descriptive Low ‘Slug’ indicator of the Mod Event severity of an adverse ‘slug’ High event
Flush Magnitude XSArea
Bottom Water Quality Peak XS Velocity
expert judgement: (13)
Risk-based Approaches for Managing Contaminants in Catchments – Report 4
44
event Abundanc e Breeding Popn
Descriptive indicator of abundance of Freshwater Catfish breeding population within the reach at the end of summer
Low
Recruitme nt Juvenile Catfish
Descriptive Poor indicator of Mod recruitment Good success of juvenile catfish within the reach at the end of summer
Hydraulic Habitat
Spawning Area Availabilit y
Descriptive Low indicator of the Mod availability of spawning area High over the reach
Depth
Mod High
Hydraulic Habitat Severity of ‘Slug’ Event
Severity of ‘Slug’ Event
Synthetic variable that characterizes the abundance of the Freshwater Catfish breeding population within the reach on the basis of hydraulic habitat and mortality impact of ‘slug’ events. Is a key factor in assessing the viability of Freshwater Catfish within the reach.
Expert judgement: (13)
Synthetic variable that characterizes the recruitment success of juvenile catfish within the reach on the basis of hydraulic habitat and mortality impact of ‘slug’ events. Is an important factor in assessing the viability of Freshwater Catfish within the reach.
Analyst judgement
Characterizes availability of spawning area within the reach over summer. Is an important factor in the assessment of the recruitment success of larval catfish.
Data, expert judgement: (7), (12)
Risk-based Approaches for Managing Contaminants in Catchments – Report 4
Recruitme nt Larval Catfish
Descriptive indicator of recruitment success of larval catfish within the reach at the end of summer
Low Mod High
Spawning Area Availability Hydraulic Habitat Severity of ‘Slug’ Event Peak XS Velocity
Viability of Catfish Popn
Descriptive Poor indicator of the Good viability of Freshwater Catfish populations within the reach at the end of summer
Abundanace Breeding Popn Recruitment Juvenile Catfish
45
Synthetic variable that characterizes the recruitment success of larval catfish within the reach on the basis of spawning area availability, hydraulic habitat and mortality impacts of ‘slug’ events and high flow velocity conditions. Is an important factor in assessing the viability of Freshwater Catfish within the reach.
Analyst judgement
Model endpoint. Synthetic variable that characterizes the viability of Freshwater Catfish populations within the reach.
Analyst judgement
Recruitment Larval Catfish
(1) Anderson and Morison (1988b); (2) Western (1994); (3) Metzeling (1995); (4) SKM (1997); (5) Ryan et al . (1999); (6) Western and Stewardson (1999); (7) Clunie and Koehn (2001); (8) SKM (2003b); (9) Cooperative Research Centre for Catchment Hydrology; (10) Grampians Wimmera Mallee Water (formerly Wimmera-Mallee Water; (11) A.Western, unpublished data; (12) P.Clunie, pers.comm., 2005; (13) T.Ryan, pers.comm., 2005.
Risk-based Approaches for Managing Contaminants in Catchments – Report 2
5.6
46
Reviewing BN model structure and node relationships
The graphical and probability structure of the BN was checked and reviewed using methods described in Cain (2001). With respect to overall graphical structure, checks were performed to ensure that all parentless nodes represented either controlling factors or interventions and that the childless node described the stakeholder management objective. Expert review (by P. Clunie, Arthur Rylah Institute for Environmental Research, ARI, and T. Ryan, formerly of ARI) was used to ensure that all important variables had been included and that any omissions were justifiable/defensible. Node names and states were checked in consultation with experts to ensure that they were adequately and appropriately defined in terms of spatial and temporal scale and specific problem context. Node connections, relationships and probability structure were reviewed in consultation with experts and by altering node states to observe how the model behaved. Node relationships were systematically reviewed according to Cain’s (2001) methodology. Full details of the review process and outcomes are available in Chee (2005).
5.7
Sensitivity to findings
Sensitivity to findings analysis was used to identify network variables which have the greatest influence on the variables of management interest. These variables, denoted as ‘query nodes’, include: Bottom Water Quality, Hydraulic Habitat, Severity of ‘Slug’ Event, Abundance Breeding Popn, Recruitment Juvenile Catfish, Recruitment Larval Catfish and Viability of Catfish Popn. For each given query node, the Sensitivity to Findings function in Netica was used to identify the network variables that were of greatest influence. For convenience, these variables will be referred to as ‘findings nodes’. Essentially, the Sensitivity to Findings function calculates and reports on a number of different sensitivity measures. For nodes with categorical states, the sensitivity measures used in Netica are calculations of entropy reduction (or mutual information) (Norsys Software Corp. 1997-2003). Shannon’s entropy denoted as H(Q), is the average amount of information contained in the random (query) variable, Q. The formula for Shannon’s entropy is given as (Pearl, 1991): H(Q) = - ∑ Pr(q) * log Pr(q) qεQ
Measuring the effect of one variable on another is referred to as mutual information denoted as I(Q/F) and given by the formula (Pearl, 1991): I(Q/F) = H(Q) – H(Q/F) where F is the findings variable. When H(Q/F) is subtracted from the original uncertainty in Q prior to consulting F (i.e. H(Q)), the total uncertainty-reducing potential of F is obtained (Pearl 1991). This potential is known as Shannon’s mutual information (or entropy reduction in Netica) and basically describes the expected reduction, I, in mutual information of a query variable, Q, due to a finding, F. The greater the entropy reduction value associated with an findings node, the greater the influence on the query node. It is calculated as (Pearl, 1991):
I = ∑q ∑ f Pr(q, f ) log[Pr(q, f ) /((Pr (q ) * Pr ( f ))]
Risk-based Approaches for Managing Contaminants in Catchments – Report 4
47
where q is a state of the query variable, Q, f is a state of the findings variable, F, and the summations refer to the sum of all states q of f of variables Q or F (Pearl, 1991). The entropy reduction or mutual measures can be used to rank variables according to the capacity for entered evidence at these variables to change the posterior probability of the query node. As entropy reduction describes the reduction in uncertainty in a query node when information is available for a findings node, it can be used to help identify areas of research priority by indicating which variables to target to enable optimal learning.
Risk-based Approaches for Managing Contaminants in Catchments – Report 4
6.
Management Implications
6.1
General
48
The pattern of allocation of available water over the suite of flow components, comprising cease-to-flow periods, minimum flows and ‘freshes’ constitutes the environmental flow release strategy over summer. Exploration of flow scenarios or strategies using the BN model was carried out by entering findings at the appropriate nodes and examining the resultant changes in probability distributions of the variables of management interest. This allows a model-user to assess the sensitivity of outcomes to different management interventions. Two basic scenarios were used to provide baselines for comparative evaluation of environmental flow strategies: •
a worst case scenario (called ‘Dry’) in which the focal reach receives no flow at all throughout summer, and
•
the SKM (2002a) environmental flow recommendations (Table 5) which consisted of a cease-to flow period of 21 days; median MDF=5 ML/day and four evenly distributed ‘freshes’ over summer of 20 ML each. The implementation of this strategy in the full BN model is shown in Figure 6.
Under conditions of low median MDF, the most likely state of cross-sectional area distribution (XSArea) is 0-20 m2 with a probability of 0.83 and the most likely states of Bottom Water Quality are ‘Okay’ and ‘Good’ with probabilities of 0.44 and 0.35 respectively (Figure 6). These conditions in turn result in Hydraulic Habitat being most likely to be in an ‘Average’ state over summer, with a probability of 0.50 (Figure 6). Under the SKM (2002a) flow recommendations, the probability that the severity of a ‘slug’ event will be ‘Low’ is 0.85 (Figure 6). The BN model can be extended to support decision-making under uncertainty by converting it into a decision network (also known as an influence diagram). This involves specifying decision nodes for variables under management control and specifying a utility model with which to measure the expected value of different choices. This section describes how this might be done. The BN model was converted into a decision network by converting the flow variables amenable to management control into decision variables. These variables were: Median Mean Daily Flow (MDF), Fresh Freq and Fresh Magnitude. The designated model endpoint is the viability of Freshwater Catfish populations in the focal reach and utility could be based on the states for Viability of Catfish Popn. However, this is expected to be ‘Good’ within the temporal frame chosen for the model, because the adult fish seem to be able to persist at high densities under extremely poor physicochemical conditions for extended periods of time. Indeed, the viability of populations in the focal reach is likely to be an issue only if there is a combined sequence of adverse events such as a large number of consecutive years (eg. 10 years) of poor conditions, during which little or no breeding occurs and recruitment over that period is insufficient to offset mortality in the breeding population. So even though Freshwater Catfish population viability is an important management objective in its own right, the viability and abundance of Freshwater Catfish
Risk-based Approaches for Managing Contaminants in Catchments – Report 4
49
populations are not, as originally believed, likely to be useful indicators of stressors that river managers would like to address through environmental flow management. We therefore chose to focus on Hydraulic Habitat and Severity of ‘Slug’ Event as key indicators of environmental conditions which are of general importance to in-stream aquatic biota. The goal in managing environmental flows over summer was to maximize hydraulic habitat while minimizing ‘slug’ events of ‘High’ severity. This goal was translated into a simple utility function formalizing both the order and strength of hypothetical preferences for different consequences (Table 5) and was incorporated into the decision network as a Utility node representing quantities to be maximized.
Median Mean Daily Flow ( MDF0 MDF5 MDF10 MDF20 MDF30
Depth Distribution Extent of Grdwater Intrusion Low Mod High
VShal Shal Mod Deep
55.9 38.4 5.73
73.0 13.7 3.23 10.1
...
0 100 0 0 0
Fresh Magnitude
5
1.4 ± 2.2 Obs Range Bottom Salinity Good Okay Poor Very Poor
41.9 34.2 11.0 12.9
Bottom DO Stressful Okay
A 0to20 A 20to40 A 40to80 A 80to120 A 120to160 A 160to200 A mt200
Bottom Water Quality
Bottom Salinity Good Okay Poor Very Poor
XSArea Distribution
30.1 69.9
Poor Okay Good
44.5 43.1 10.1 2.34
21.6 43.5 35.0
3e+001 ± 1e+002
Hydraulic Habitat
Low Mod High
Mixing due to Median MDF Yes No
29.0 71.0
Mixing due to 'Freshes' Yes No
Poor Average Good
Abundance Breeding
83.0 6.39 4.53 1.90 1.06 0.68 2.47
80.8 19.2
Max Interval Betw Mix Evts
28.8 49.5 21.7
Int Int Int Int
0to21 22to28 29to35 mt35
Peak XS Velocity
Popn Severity of 'Slug' Event Low High
Recruitment Juvenile Ca Low Mod High
Spawning Area Availability Low 17.4 Mod 23.0 High 59.6
41.8 34.6 23.6
18.1 7.44 74.5
3.7e+004 ± 3.3e+004
84.9 15.1
...
100 0 0 0 0 0 0 20
Fresh Freq NoFr Fr x1 Fr x2 Fr x3 Fr x4
0 0 0 0 100 4
82.6 0 0 17.4
Low Mod High
17.6 50.4 32.1
Fr20 Fr40 Fr80 Fr115 Fr150 Fr190 Fr240
Flush Magnitude F0to300 F300to600 F600to1200 F1200to3000 F3000to6000 Fmt6000
71.9 10.0 7.45 6.11 2.46 2.08
9e+002 ± 3.6e+003
Recruitment Larval Catfish
Viability of Catfish Poor Good
Figure 6:
Popn
Low Mod High
62.5 31.5 6.05
12.8 87.2
Full Bayesian network model for Freshwater Catfish in the Lower Wimmera River showing the instantiation of the summer flow release strategy recommended in SKM (2002), in which median MDF=5 ML/day, ‘Fresh’ frequency=4 and ‘Fresh’ magnitude=20 ML
The Netica software was used to find values for the decision nodes that will result in the largest possible expected value for the utility node. Solving the influence diagram finds a decision function for each decision node (ie. a function which gives a decision value for each possible set of parent values). This may be used to identify the optimal combination of parent values, assuming that one or two out of the three parent decision variables is given
Risk-based Approaches for Managing Contaminants in Catchments – Report 4
50
within the decision context. For example, if in a particular summer, operational constraints dictate that it is possible to release only a maximum of 3 ‘freshes’ and the median MDF is expected to be 10 ML/day. These conditioning values can be entered into the network as findings. Having done so, examination of the decision function for the Fresh Magnitude node will reveal the fresh magnitude value that will produce the highest expected utility value. In this particular example, the expected utility value is maximized for the given conditions when the fresh magnitude is 115 ML/day. Table 5:
Utility function for assessing environmental flow scenarios/strategies using the influence diagram
Hydraulic Habitat
Severity of ‘Slug’ Event
Utility Value
Poor
Low
10
Poor
High
0
Average
Low
60
Average
High
40
Good
Low
100
Good
High
80
Finally, to provide users with an indication of the quantity of water required to implement any combination of decision variables, the node Water Required (ML) was added to the network. This is a deterministic node that simply computes the volume of water required for any flow scenario/strategy over summer, using the following formula: Water Required (ML) = (90 - CTF - (FrFreq*Dur))*Flow + (FrFreq*Dur*FreshMag)
Eqn 1
where CTF, is the cease-to-flow period (in the model constructed, a CTF period of 21 days was assumed); FrFreq, refers to the number of ‘freshes’ over the summer period (ie. 0-4); Dur, refers to the duration of the ‘fresh’ (assumed to be 2 days), FreshMag refers to the ‘fresh’ magnitude and Flow, is the value of the median MDF (ie. 0, 5,10, 20, 30 ML/day). The decision network instantiating the example discussed above is shown in Figure 7. As can be seen from the figure, the quantities of water required to implement the flow strategy depends on the fresh magnitude selected and spans the range 500-2,500 ML. Choosing a fresh magnitude of 115 ML/day will require a total of 1,320 ML. However, the differences in expected utilities for the full range of fresh magnitudes are actually very small (Figure 7). Thus the model suggests that if the quantities of water available for environmental flows in that season are less than the 1,320 ML required, a smaller fresh flow (eg. 40 ML which implies a total volume required of 870 ML) can be used without much difference in expected utility. The decision network was used to explore flow release strategies, to develop insight into how flow components interact and impact on variables of management interest and to formulate general principles for developing flow strategies.
Risk-based Approaches for Managing Contaminants in Catchments – Report 4
Median Mean Daily MDF0 MDF5 MDF10 MDF20
Depth Distribution Extent of Grdwater Intrusion Low Mod High
VShal Shal Mod Deep
55.9 38.4 5.73
70.5 15.5 3.60 10.4
Flo...
0 0 52.2004
Water Required (ML)
0
MDF30
0
1.4 ± 2.2 Fresh Magnitude Obs Range Bottom Salinity Good Okay Poor Very Poor
41.9 34.2 11.0 12.9
Bottom DO Stressful Okay
Bottom Salinity Good Okay Poor Very Poor
XSArea Distribution
30.3 69.7
A 0to20 A 20to40 A 40to80 A 80to120 A 120to160 A 160to200 A mt200
Bottom Water Quality
44.5 43.1 10.1 2.34
Poor Okay Good
21.5 43.9 34.6
81.9 7.19 4.92 1.98 1.08 0.67 2.22
Mixing due to Median MDF Yes No
57.3 42.7
Max Interval Int Int Int Int
29.1 49.2 21.7
0to21 22to28 29to35 mt35
57.3 35.6 0 7.13
Peak XS Velocity Low Mod High
Low High
17.7 50.4 31.9
83.4 16.6
Spawning Area Availability Recruitment Juvenile Cat Low Mod High
Low Mod High
...
42.1 34.4 23.5
11.4 6.21 82.4
4.1e+004 ± 3.2e+004
Severity of 'Slug' Event Popn
89.9 10.1
1.39e+003 ± 5.3e+002
Fresh Freq
Betw Mix Evts
Utility
Low Mod High
51.6530 52.0334 52.1949 52.2004 52.1680 52.1557 52.1367
0 28.6 28.6 28.6 14.3 0 0
Mixing due to 'Freshes'
Hydraulic Habitat
Abundance Breeding
Fr20 Fr40 Fr80 Fr115 Fr150 Fr190 Fr240
R0to500 R500to1000 R1000to1500 R1500to2000 R2000to2500 R2500to3000 R3000to4000
31 ± 96 Yes No
Poor Average Good
51
17.8 23.4 58.8
NoFr Fr x1 Fr x2 Fr x3 Fr x4
Flush Magnitude F0to300 F300to600 F600to1200 F1200to3000 F3000to6000 Fmt6000
71.9 10.0 7.44 6.10 2.46 2.06
9e+002 ± 3.6e+003
Recruitment Larval Catfish Low Mod High Viability of Catfish Poor Good
63.8 30.5 5.72
Popn
12.9 87.1
Figure 7: Full Bayesian decision network model for Freshwater Catfish in the Lower Wimmera River, showing the instantiation of a flow release strategy in which the median MDF=10 ML/day and the number of ‘freshes’=3. The number beside each decision choice in the Fresh Magnitude node indicates the expected utility of making that choice
6.2
Sensitivity to findings analysis
Sensitivity to findings analysis was performed for each individual query node, resulting in a list of network variables (findings nodes) ranked according to the sensitivity values for entropy reduction (mutual information). The results have been organized into a matrix with the variables of management interest in columns and the findings nodes in rows (Table 6). The values in each cell refer to the rank of each network variable with respect to the query variable (with a rank of 1 indicating the variable of greatest influence). The entropy reduction value associated with each findings node, I, has also been provided to give an indication of the relative sensitivity of each variable.
Risk-based Approaches for Managing Contaminants in Catchments – Report 4
52
The observed pattern of the relative influence of the various network variables on each query variable reflects the combined effect of the graphical structure (i.e. the formal representation of our conceptual model) and the probability structure between network variables embodied by the CPTs. Generally if distance is measured in terms of the number of nodes lying between the finding node and the query node, then those findings nodes closer to the query node will have a greater impact. The influence of findings nodes, which are further away from the query node tends to be ‘diluted’ because each intermediate node has a CPT which introduces more conditional uncertainty into the effect (Lee, 2000; Cain, 2001). In addition, some of the intermediate nodes have additional parents representing factors which must also be considered when investigating how the findings node affects the query variable. Both these features of BN structure tend to attenuate the impact of a findings node on query variable (Cain, 2001). In general, this means that the nodes that have the greatest influence on a query node tend to be parent and/or child nodes or nodes that are separated by at most one intermediate node. It can be seen from Table 6 that this pattern of relative influence is reflected in the three topranked findings nodes for each query node of Freshwater Catfish BN model. In addition, two variables, Bottom Water Quality and Hydraulic Habitat, are ranked within 1-3 with respect to all query nodes, reflecting the dominating influence these variables have on our variables of management interest. This is consistent with the conceptual understanding of the system and provides some assurance that the logic underlying the model has been captured in the model structure and the strength of relationships between system variables. The rankings provide an indication of which variables it would be most useful to study in order to reduce uncertainty in the variables of management interest and can thus be used to prioritize investment of research effort. The dominating influence of Bottom Water Quality and Hydraulic Habitat has already been noted and these variables are natural candidates for further work that might focus on developing more rigorous definitions and methods of quantification as well as further research to quantify their relationships with demographic characteristics and processes in Freshwater Catfish in the Lower Wimmera River. I values for marginal variables whether they were variables amenable to management (i.e. Median Mean Daily Flow (MDF), Fresh Magnitude and Fresh Freq) or not (i.e. Extent of Grdwater Intrusion, Obs Range Bottom Salinity and Flush Magnitude) were very low. With the exception of Obs Range Bottom Salinity, I values for all the marginal variables were