Use of Bayesian Inference in Crystallographic Structure Refinement via Full Diffraction Profile Analysis Chris M. Fancher1 , Zhen Han2 , Igor Levin3 , Katharine Page4 , Brian J. Reich2 , Ralph C. Smith5 , Alyson G. Wilson2 , and Jacob L. Jones1,* 1 Department
of Materials Science and Engineering, North Carolina State University, Raleigh, North Carolina 27695, USA 2 Department of Statistics, North Carolina State University, Raleigh, North Carolina 27695, USA 3 Materials Measurement Science Division, National Institute of Standards and Technology, Gaithersburg, Maryland 20899, USA 4 Neutron Scattering Science Directorate, Oak Ridge National Laboratory, Oak Ridge, Tennessee 37831, USA 5 Department of Mathematics, North Carolina State University, Raleigh, North Carolina 27695, USA * jacob
[email protected]
Supplementary Figure 1. Posterior probably distributions from Bayesian inference and corresponding point estimates (vertical lines) from Rietveld LSQ method with estimated errors.
1
Supplementary Figure 2. Posterior probably distributions from Bayesian inference and corresponding point estimates (vertical lines) from Rietveld LSQ method with estimated errors.
Supplementary Figure 3. Posterior probably distributions from Bayesian inference and corresponding point estimates (vertical lines) from Rietveld LSQ method with estimated errors.
2/10
Supplementary Figure 4. Posterior probably distributions from Bayesian inference and corresponding point estimates (vertical lines) from Rietveld LSQ method with estimated errors.
Supplementary Figure 5. Posterior probably distributions from Bayesian inference and corresponding point estimates (vertical lines) from Rietveld LSQ method with estimated errors.
3/10
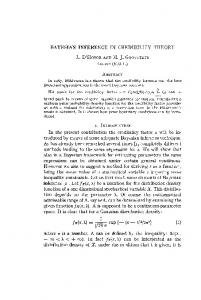
Supplementary Figure 6. Pairs plots of model parameters are a common diagnostic used to identify correlations among parameters that might lead to slow mixing and convergence of the MCMC algorithm.
Microstrain (100* %)
400
380
0
360
5000
10000
340
320
10000
50000
90000
300
280 0
25000
50000
75000
100000
Iteration
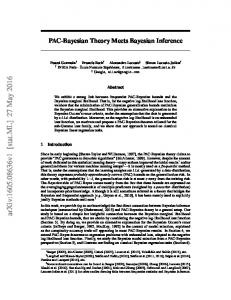
Supplementary Figure 7. Traceplot of the MCMC samples for microstrain illustrates the behavior of the MCMC algorithm as parameter space is stochastically sampled. Initially the sampled values vary widely until the analysis reaches a stable region of parameter space. These iterations are referred to as burn-in and are discarded the subsequent analysis because these samples are not representative of the posterior distribution. The insets are shown to highlight the behavior of the MCMC sample before (red) and after (blue) burn-in.
4/10
Supplementary Figure 8. Example trace plots of MCMC samples that (left) have not reach convergence and (right) have converged. The trend that the MCMC samples decreases with iteration number indicates that the samples have not reached a stable point. The plot on the left is from a preliminary run of the MCMC and is not used in any reported calculations.
Supplementary Table 1. Summary of prior distributions and constants used in the MCMC analysis. Parameter Wavelength U V W Scale Zero Microstrain Crystallite Size Uiso B-spline parameters (γ ) τ2 σ2 γ0 Polarization Absorption X Y d C
Prior Distribution/Fixed Value Uniform(0.41, 0.42) Uniform(0.1, 1.5) Uniform(-0.35, -0.04) Uniform(0.0, 0.1) Uniform(0, 500) Uniform(-0.1, 0.1) Uniform(0, 600) Uniform(0, 2) Uniform(0.0, 0.1) Normal(0, τ 2 ) InverseGamma(0.1,0.1) InverseGamma(0.1,0.1) LogNormal(0,1) 0.99 0.1 0 0 5.431230 10,000
5/10
#Here load up the package outside of the function to make it a one time thing #minimal cost because this is only loaded once #import time import GSASIIstrIO as G2stIO import GSASIIIO as G2IO import GSASIIstrMath as G2stMth import GSASIIpath import pylab as plt class Calculator: ’’’ ################################################## How it works ##################### # Variables are stored in various python dictionaries # (parmDict, calcControls, Phases, and Histograms) # # Variables of interest that are stored in parmDict include: # Background parameters: :0:Back:x (x represent the order) # X-ray absorption coef: :0:Absorption # X-ray wavelength: :0:Lam # Intensity scale factor: :0:Scale # 2-theta offset: :0:Zero # Various peak parameters: :0:U, :0:V, :0:W, :0:L, :0:X, :0:SH/L # # Variables of interest that are stored in calcControls include: # Model for background: :0:bakType (default is chebyschev) # available models are: # chebyschev (default), cosine, lin interpolate, inv interpolate, and log interpolate # # Phases contains information about the phases in the material # (Space group, atom positions, Debye-Waller factors, preferred orientation, ....) # Change between isotropic and anisotropic Debye-Waller factors: # Phases[Phases.keys()[0]][’Atoms’][X][9] = ’I’ (isotropic) or ’A’ (anisotropic) # [X represents atom number (0 to n-1)] # Debye-Waller factors are controled by: # Phases[Phases.keys()[0]][’Atoms’][X][10-16] (isotropic case only used element 10) # # Histograms contains information about the diffraction data file (DO NOT CHANGE) # ’’’ def __init__(self,GPXfile=None): ’’’ Initialize the setup using an existing GPXfile ’’’ if not GPXfile: #TO DO: Raise name error raise NameError(’Must input some GPX file’) # Initallizing variables from input file GPXfile #Code from Chris #time0 = time.time() varyList = []
6/10
parmDict = {} Controls = G2stIO.GetControls(GPXfile) calcControls = {} calcControls.update(Controls) constrDict,fixedList = G2stIO.GetConstraints(GPXfile) restraintDict = G2stIO.GetRestraints(GPXfile) Histograms,Phases = G2stIO.GetUsedHistogramsAndPhases(GPXfile) rigidbodyDict = G2stIO.GetRigidBodies(GPXfile) rbIds = rigidbodyDict.get(’RBIds’,{’Vector’:[],’Residue’:[]}) rbVary,rbDict = G2stIO.GetRigidBodyModels(rigidbodyDict) if GSASIIpath.GetVersionNumber() > 1500: Natoms,atomIndx,phaseVary,phaseDict,pawleyLookup,FFtables,BLtables, \ maxSSwave = G2stIO.GetPhaseData(Phases,restraintDict,rbIds,Print=False) else: Natoms,atomIndx,phaseVary,phaseDict,pawleyLookup,FFtables,BLtables = \ G2stIO.GetPhaseData(Phases,restraintDict,rbIds,Print=False) calcControls[’atomIndx’] = atomIndx calcControls[’Natoms’] = Natoms calcControls[’FFtables’] = FFtables calcControls[’BLtables’] = BLtables hapVary,hapDict,controlDict = \ G2stIO.GetHistogramPhaseData(Phases,Histograms,Print=False) calcControls.update(controlDict) histVary,histDict,controlDict = G2stIO.GetHistogramData(Histograms,Print=False) calcControls.update(controlDict) varyList = rbVary+phaseVary+hapVary+histVary parmDict.update(rbDict) parmDict.update(phaseDict) parmDict.update(hapDict) parmDict.update(histDict) G2stIO.GetFprime(calcControls,Histograms) varyListStart = tuple(varyList) # save the original varyList before dependent vars are removed #Save the instance parameters self._Histograms = Histograms self._varyList = varyList self._parmDict = parmDict self._Phases = Phases self._calcControls = calcControls self._pawleyLookup = pawleyLookup self._restraintDict = restraintDict self._rigidbodyDict = rigidbodyDict self._rbIds = rbIds self._tth = Histograms[Histograms.keys()[0]][’Data’][0][0:-1]
#print ’variable initallizing time: %.3fs...Successful’%(time.time()-time0) def Calculate(self): ’’’ Calculate the f and g for the current parameter setup
7/10
’’’ #time0 = time.time() ’’’ #Load the parameters Histograms = self._Histograms varyList = self._varyList parmDict = self._parmDict Phases = self._Phases calcControls = self._calcControls pawleyLookup = self._pawleyLookup restraintDict = self._restraintDict rbIds = self._rbIds ’’’ yc1,yb1 = G2stMth.getPowderProfile(self._parmDict,self._tth,self._varyList, \ self._Histograms[self._Histograms.keys()[0]], \ self._Phases,self._calcControls,self._pawleyLookup) # print ’Pattern calculation time: %.3fs’%(time.time()-time0) return [self._tth, yc1, yb1] def CalculateDeriv(self): X = G2stMth.getPowderProfileDerv(self._parmDict,self._tth,self._varyList,\ self._Histograms[self._Histograms.keys()[0]],\ self._Phases,self._rigidbodyDict, \ self._calcControls,self._pawleyLookup) return X def SaveData(self,OutputFileName): x, yc, yb = self.Calculate() outputFile = open( OutputFileName, ’w’ ) for i in xrange( len( x ) ): outputFile.write( str(x[i]) + ’\t’ + str(yc[i]) + ’\t’ + str(yb[i]) + ’\n’) def Draw(self,SaveFigure=None): ’’’ Calculate the f and g for the current parameter setup ’’’ x, yc, yb = self.Calculate() plt.plot(x,yc+yb) if SaveFigure: plt.savefig(SaveFigure) else: plt.show() def UpdateParameters(self, parmVarDict=None, controlVarDict=None, \
8/10
phaseVarDict=None, histogramVarDict=None): ’’’ Update parameters in the current model ’’’ if not(parmVarDict or controlVarDict or phaseVarDict): print ’No update specified...Abort’ return 0 if histogramVarDict: for key1 in histogramVarDict.keys(): for key2 in histogramVarDict[key1].keys(): self._Histograms[self._Histograms.keys()[0]][key1][0][key2][1] = \ histogramVarDict[key1][key2] if phaseVarDict: for key1 in phaseVarDict: if key1 == ’Atoms’: self._Phases[self._Phases.keys()[0]][key1][phaseVarDict[key1]\ [’Atom’]][phaseVarDict[key1][’i1’]] = phaseVarDict[key1][’Val’] else: for key2 in phaseVarDict[key1]: if key1 == ’Histograms’: self._Phases[self._Phases.keys()[0]][key1]\ [self._Histograms.keys()[0]][key2][phaseVarDict[key1]\ [key2][’i1’]] = phaseVarDict[key1][key2][’Val’] else: for key3 in phaseVarDict[key1][key2]: self._Phases[self._Phases.keys()[0]][key1][key2][key3] = \ phaseVarDict[key1][key2][key3]
hapVary,hapDict,controlDict = G2stIO.GetHistogramPhaseData(self._Phases, \ self._Histograms,Print=False) histVary,histDict,controlDict = G2stIO.GetHistogramData(self._Histograms,Print=False) if GSASIIpath.GetVersionNumber() > 1500: Natoms,atomIndx,phaseVary,phaseDict,pawleyLookup,FFtables,BLtables,maxSSwave = \ G2stIO.GetPhaseData(self._Phases,self._restraintDict,self._rbIds,Print=False) else: Natoms,atomIndx,phaseVary,phaseDict,pawleyLookup,FFtables,BLtables = \ G2stIO.GetPhaseData(self._Phases,self._restraintDict,self._rbIds,Print=False) self._parmDict.update(hapDict) self._parmDict.update(histDict) self._parmDict.update(phaseDict) if parmVarDict: for name in parmVarDict: self._parmDict[name] = parmVarDict[name] if controlVarDict: for name in controlVarDict: self._calcControls[name] = controlVarDict[name]
9/10
’’’ #Load the parameters Histograms = self._Histograms varyList = self._varyList parmDict = self._parmDict Phases = self._Phases calcControls = self._calcControls pawleyLookup = self._pawleyLookup restraintDict = self._restraintDict rbIds = self._rbIds ’’’
#print ’Successful’
10/10