Available online at www.sciencedirect.com
ScienceDirect Procedia Manufacturing 3 (2015) 5427 – 5434
6th International Conference on Applied Human Factors and Ergonomics (AHFE 2015) and the Affiliated Conferences, AHFE 2015
User centered evaluation of interactive data visualization forms for document management systems Antje Heinicke*, Chen Liao, Katrin Walbaum, Jennifer Bützler and Christopher M. Schlick Chair and Institute of Industrial Engineering and Ergonomics of RWTH Aachen University, Bergdriesch 27, 52062 Aachen, Germany
Abstract In order to manage the overload of digital information in the SMEs document management is becoming increasingly important. With a DMS documents can be searched, checked, edited and forwarded, which simplifies the handling of documents for the employees. Compared to the inciting and joyful designed user interfaces used for private matters, the interfaces of the up-to-date DMS are lagging far behind regarding usability since DMS are usually designed according to functional aspects. When solving the tasks, positive user experiences and joy of use are rather rare although this can help to encourage the acceptance and positive attitude towards software. In order to improve the usability aspects of DMS, in a first step, interactive visualizations were developed for the DMS data analysis and were tested for usability and attractiveness. Results of the study show that zoomable tree map is the most appropriate visualization type for DMS data and thus is recommended for interactive presentation of data structures. © 2015 The Authors. Published by Elsevier B.V. This is an open access article under the CC BY-NC-ND license © 2015 The Authors. Published by Elsevier B.V. (http://creativecommons.org/licenses/by-nc-nd/4.0/). Peer-reviewunder underresponsibility responsibilityofofAHFE AHFE Conference. Peer-review Conference Keywords: Document Management, Joy of use, Data visualization, Usability
* Corresponding author. Tel.: +49 241 80 99 456; fax: +49 241 80 92 131. E-mail address:
[email protected]
2351-9789 © 2015 The Authors. Published by Elsevier B.V. This is an open access article under the CC BY-NC-ND license (http://creativecommons.org/licenses/by-nc-nd/4.0/). Peer-review under responsibility of AHFE Conference doi:10.1016/j.promfg.2015.07.669
5428
Antje Heinicke et al. / Procedia Manufacturing 3 (2015) 5427 – 5434
1. Introduction As the overload of digital information in small and medium enterprises (SMEs) requires an adequate management, DMSs increasingly gain importance [1]. Due to its cross-process functionality DMS are applied in SMEs across all departments and disciplines. Compared to user interfaces that are designed for private matters, interfaces of the up-to-date DMS are lagging far behind regarding usability [2]. Poor usability reduces the effectiveness and efficiency in accomplishing specific tasks, and lowers the system’s overall acceptance. Woywode et al. [3] showed that increased usability is an important differentiating characteristic in the software market which contributes to an immediate increase in competitiveness. The main goal of data visualization is to communicate information clearly and effectively. Both aesthetic form and functionality need to go hand in hand. The tree view chart is often used for data visualization [4] since this node link diagram with nodes expanding from left to right allows users to see the data in a traditional way. Another frequently used diagram is sunburst a circular design with nodes expanding from the inside to the outside. Here the size of the nodes’ area can be determined by their metadata (e.g. amount, volume, importance). Thus the proportion between the metadata can be detected visually. As a traditional tool in visualization, zoom is quite indispensable when large graph structures are explored [5]. It helps to focus on specific areas by reducing the visual complexity. One possible way to increase the usability of DMS is to include interactive data visualizations into the data analysis section. This can help users to get a general view of the overall data (sum of invoices), and find the required figures (amount of paid or outstanding invoices) quickly. In a DMS various data about creditors and debtors can be evaluated and presented. This involves amongst others the representation of sales, payments made and outstanding items. Most of these visualizations to display the metadata are in a static form but interactive can lead to higher usability as users are allowed to make direct manipulation or navigation when using the charts. A comparison of different data visualizations shows, that the sunburst chart came out on top regarding aesthetics and was among the best rated visualizations in terms of efficiency and effectiveness [6]. Here, the used dataset comprises of a file directory structure containing subfolders and files. Research indicate that the tree view possessed a faster response time for correct answers, and people tended to spend more time on this visualization before they gave up on a difficult tasks. In addition users were quicker in solving data-retrieval tasks with the tree view chart. However, this online study examined the visualizations only in a static form. Accordingly, it has to be examined whether this result also applies to interactive visualizations of DMS data analysis structures. Therefore, in this study four different interactive visualization techniques for DMS creditor data were developed based on sunburst and tree view charts combined with zoom techniques. The visualization forms were implemented interactively using Web technologies and tested in an empirical study. The aim was to examine how efficiently and effectively information can be detected in the different visualization forms and which one will be rated by the participants as most joyful. Based on the research mentioned above it is to expect that there are no major differences between tree-based and sunburst-based visualizations regarding execution times and error rates. It is assumed that the zoomable visualizations are seen as more attractive than the other visualizations. 2. Method 2.1. Participants 21 subjects aged between 20 and 31 years (M=25.57, SD=2.69) participated in the study. All participants had experience in document management; five participants used particular document management software to manage their documents. The participants rated their software skills as ‘good’. 2.2. Design The experimental analysis was based on a full factorial design with one within-subject factor. The type of interactive visualization form was the within factor. It had four levels: 1) Collapsible tree, 2) sequence sunburst, 3) zoomable tree map and 4) zoomable sunburst are displayed in Table 1.
5429
Antje Heinicke et al. / Procedia Manufacturing 3 (2015) 5427 – 5434 Table 1 Visualization types used
Visualization State
Collapsible tree
Sequence sunburst
Zoomable tree map
Zoomable sunburst
Initial state
Expanded / highlighted/ zoomed state
Collapsible tree is a visualization type with expandable nodes and links that represent the relationship between parent and child data nodes. A single click on a node expands or folds the node so that child nodes could or could not be seen. Users read from left to right and click the nodes along the path to find a specific file. As initial state, only three levels were shown. For the collapsible tree continuous edges were used since their use leads to good results regarding execution times and error rates [9]. Sequence sunburst is a circular design that constantly shows all nodes in the system. Higher levels are positioned outside the circle. The size of the area that a node occupies is related to its metadata and therefore its children’s metadata (here total amount of invoice/s). When the cursor is positioned on a node, its parent nodes are highlighted in a path, so that the hierarchical structure became more obvious. Zoomable tree map is a resizable design consisting of rectangle nodes. The size of the node area is related to its metadata and therefore its children’s metadata (here total amount of invoice/s). As initial state, only three levels were shown. All nodes are clickable in this visualization. When clicking on a node it became the start node with the next two children levels shown. The levels above the clicked node disappear, only his parent node is still visible to its left as a button to go back in the structure. Zoomable sunburst is a resizable circular design. As in sequence sunburst and partition layout the size of the node area is related to its metadata. As initial state, only three levels were shown. All nodes are clickable in this visualization. When clicking on a node it became the start node with his next three children levels shown around him. The levels above the clicked node disappear, only his parent node is still visible in the center circle to go back in the structure. Effectiveness, efficiency, attractiveness and mental effort were investigated regarding the type of visualization. In order to evaluate the effectiveness, the relative frequency of not successfully processed tasks was recorded. For the efficiency task execution time and eye-tracking data (fixations and length of scan path) were analyzed. Regarding attractiveness the perceived usability and joy of use were measured with the questionnaire AttrakDiff [7]. The AttrakDiff questionnaire measures the pragmatic and hedonic quality of a system. A product has pragmatic quality if it supports the task completion effectively and efficiently. The aspects related to the hedonic
5430
Antje Heinicke et al. / Procedia Manufacturing 3 (2015) 5427 – 5434
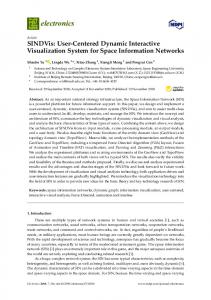
quality should bring joy and fun to the user, for example, when a product works particularly stimulating. It consists of 23 seven-level items whose endpoints are each formed by a contrasting adjective (e.g. "confusing" - "clear", "superior" - "usual", "good" - "bad"). In each case, several items are combined into a scale. The mean value of the items, constitute the scale value (from 3 very good to -3 very bad) for pragmatic quality (PQ), hedonic quality (HQ) and attractiveness (ATT). The Rating Scale Mental Effort (RSME), developed by Zijlstra [8], was used for the measurement of mental effort. The RSME consists of a scale with a range of 0–150, with nine descriptive indicators ranging from 3 (not effortful) to 114 (awfully effortful). Participants are asked to mark a point on the scale which reflects their amount of mental workload invested in the task performance. The data structure and the actual data which underlies the visualizations were varied to avoid learning effects; one structure was sorted according to the years (yearÆcreditorÆpaid|outstandingÆinvoiceÆorder|invoice|delivery note, the other one according to creditors (creditorÆyearÆpaid|outstandingÆinvoiceÆorder|invoice|delivery note. The documents related to the invoices (order, invoice, delivery note) were openable as pdf with a double click. The participants had to conduct four types of tasks with the data visualizations: Determination of creditors which charged the highest total amount of invoices in a given year, determination of the year in which the highest total amount of invoices was charged by a given creditor, determination of the total amount of invoices which was charged in a given year by a given creditor and a navigation task, where a specific invoice document had to be opened. 2.3. Apparatus The experiment was conducted using a 22” TFT-monitor with a resolution of 1680x1050px, a standard keyboard and a standard mouse. Eye movements were measured using a SMI RED500 Eye Tracking system. The viewing distance was set to 50cm, with the aid of marks on the ground (chair position). The corresponding online questionnaire was filled in using a second 22” TFT-monitor, a standard keyboard and a standard mouse. The visualizations were developed as a combination of D3.js and CSS embedded in a HTML document. D3.js is a JavaScript library with extensive visualization components and a data-driven approach to DOM manipulation [10]. It was selected as the basis visualization tool since it provides numerous kinds of chart models and many options regarding customization and interaction. The experiment’s interface consisted of four parts, a breadcrumb trail at the top left containing a metadata text field at the top center and the visualization graph in the center with the instruction on top. The breadcrumb trail was designed to show users where they were located in the data structure (See Fig. 1), since in some types of visualization the root node became invisible after zooming into the chart. The metadata text field displayed numbers that were asked in the tasks. The instruction was displayed in the upper screen area so that no head movement took place during the task.
Fig. 1. Breadcrumb for the year based data structure with all possible instances
2.4. Procedure In the beginning the participants had to fill in a questionnaire regarding demographic data and software knowledge. Before the experiment began, as introduction a background scenario was presented to the participants. After the scenario, the first run of the main experiment started. During the main test participants were asked to solve four different tasks according to four visualizations. The sequence of the visualizations was permutated. For each
5431
Antje Heinicke et al. / Procedia Manufacturing 3 (2015) 5427 – 5434
visualization type, participants had to do a training task, in which they could get familiar with the visualization and with the interaction. They were free to ask any questions. During the actual test, they were asked to find the answer as soon as possible, and were not allowed to ask any questions. Before each main task started, the eye-tracking system was calibrated. After finishing the tasks for one visualization type, the participants filled in the AttrakDiff questionnaire and rated their mental effort using the RMSE scale for this visualization type. At the end of all four runs, there was a final questionnaire which allowed the participants to select their favorite visualization and give some feedback. 2.5. Data analysis The statistical analysis in this work was calculated using the statistical software package SPSS Version 21.0. Data for mental effort, attractiveness, task execution time, fixation count and scan path length were not normally distributed. The Friedman-Test was used to analyse the differences between the variables’ means. The chosen level of significance for each analysis with the Friedman-Test was α=0.05. Post hoc analysis was done with Wilcoxon signed-rank tests using a Bonferroni correction, resulting in a significance level set at α=0.0125. 3. Results 3.1. Effectivity The analysis showed a significant effect of the factor visualization type on the number of errors (χ2(3) = 15.84, p = 0.001). The zoomable sunburst visualization resulted descriptively in the lowest error rate (see Table 2), whereas statistically only the difference between zoomable tree map and zoomable sunburst was significant (Z = - 3.162, p = 0.002). Table 2 Error rate depending on visualization type
Error rate for task solving
Collapsible tree
Sequence sunburst
Zoomable tree map
Zoomable Sunburst
4,8%
4,8%
3,6%
15,5%
3.2. Effectiveness There was a significant difference in task execution time depending on which type of visualization was used (χ2(3) = 10.686, p = 0.014). As depicted in Figure 2 the zoomable sunburst lead to highest execution times but the post-hoc tests only showed a statistical significant difference between zoomable tree map and zoomable sunburst (Z = -2.778, p = 0.005). Descriptively the zoomable tree map showed the lowest execution times.
Mean task excecution time [s]
30 25 20 15 10 5 0 Collapsible tree
Sequence sunburst Zoomable tree map Zoomable sunburst
Fig. 2. Mean task execution time
5432
Antje Heinicke et al. / Procedia Manufacturing 3 (2015) 5427 – 5434
60 50 40 30 20 10 0
8 7 6 5 4 3 2 1 0
Mean scan path length [tsd px]
Mean fixation count breadcrumb area
Mean fixation count visualization area
Regarding the eye tracking data, fixations on the visualization area, fixations on the breadcrumb area and the scan path length were analyzed (see Fig. 3). 8 7 6 5 4 3 2 1 0
Fig. 3. Eye tracking data: Mean fixation count visualization (left), mean fixation count breadcrumb (middle), mean scan path length regarding visualization area (right)
There was a statistical significant difference in fixation counts on the visualization area depending on which type of visualization was used, χ2(3) = 13.958, p = 0.003. Here the differences between zoomable sunburst and collapsible tree (Z = -4.281, p = 0.00002), zoomable sunburst and sequence sunburst (Z = -3.105, p = 0.002) as well as zoomable sunburst and zoomable tree map (Z = -3.832, p = 0.00013) are significant. Regarding fixation counts on the breadcrumb area, there are significant differences depending on the visualization type, χ2(3) = 11.025, p = 0.012. Here the pair zoomable tree map and collapsible tree shows significant differences, Z = -2.904, p = 0.004. The data for the length of scan path regarding visualization area shows also significant differences depending on type of visualization χ2(3) = 8.629, p = 0.035. The scan path length for zoomable sunburst is significantly higher to the scan path length of collapsible tree (Z = -3.559, p = 0.0004), to the scan path length of sequence sunburst (Z = -3.175, p = 0.0015) as well as to the scan path length of zoomable tree map (Z = -3.528, p = 0.0004). 3.3. Subjective evaluation Fig. 4 shows the mean values of the AttrakDiff qualities. The hedonic quality is divided into the dimensions identity (e.g. valuable) and stimulation (e.g. innovative) according to [7].
3 2 1 0 -1 -2 -3
Pragmatic quality
3 2 1 0 -1 -2 -3
Hedonic quality-identity
3 2 1 0 -1 -2 -3
Hedonic qualitystimulation
3 2 1 0 -1 -2 -3
Attractivness
Fig. 4. Comparison of the four visualizations’ mean values for the four qualities of the AttrakDiff questionnaire
5433
Antje Heinicke et al. / Procedia Manufacturing 3 (2015) 5427 – 5434
Significant difference exists regarding pragmatic quality (χ2(3) = 11.668, p = 0.009) for the pairs sequence sunburst and zoomable tree map (Z = -3.131, p = 0.002) as well as zoomable sunburst and zoomable tree map (Z = 2.820, p = 0.005). Also for the hedonic quality-stimulation (χ2(3) = 18.778, p = 0,0003) regarding the pairs zoomable sunburst and collapsible tree (Z = -2.597, p = 0.009), sequence sunburst and zoomable tree map (Z = 2.676, p = 0.007) as well as zoomable sunburst and zoomable tree map (Z = -3.027, p = 0.002). Table 3 shows the results for the in the final questionnaires made subjective evaluations. For the pair-by-pair comparison the participants should select out of two visualizations the one they liked better. In this way each visualization was compared to all the others. Collapsible tree won the most pair-by-pair comparisons followed by zoomable tree map. Finally, the participants were able to specify, which visualization they liked best of all; zoomable tree map was named by the most participants. Table 3 Subjective evaluation final questionnaire Collapsible tree
Sequence sunburst
Zoomable tree map
Zoomable sunburst
Wins pair-by-pair comparisons
3
0
2
1
Mentions best visualization
6
3
9
3
3.4. Mental effort
Mean RSME - Value
Fig. 5 shows the results for the rating scale mental effort. 50 45 40 35 30 25 20 15 10 5 0 Collapsible tree
Sequence sunburst
Zoomable tree map
Zoomable sunburst
Fig. 5. Mean RSME Values for the four visualizations
Zoomable tree map has the lowest value with ‘little effort’ (regarding mean value). Sequence sunburst has the highest value with ‘some effort’ (regarding mean value). There was a statistically significant difference in RSME depending on which type of visualization was used (χ2(3) = 13.781, p = 0.003). Here, significant differences exist for the pair sequence sunburst and zoomable tree map (Z = -2.848, p = 0.004) as well as for the pair zoomable tree map and zoomable sunburst (Z = -2.994, p = 0.003). 4. Discussion Contrary to expectations, it cannot be confirmed that tree-view based and sunburst based visualizations are equally good regarding efficiency and effectiveness. When using zoomable sunburst the number of fixations and the scan path length were significantly higher respectively longer compared to the other visualizations. Regarding relative frequency of not successfully processed tasks, task execution time and RSME the measured values for zoomable sunburst are significant higher than those for zoomable tree map. In terms of AttrakDiff’s pragmatic quality the ratings for zoomable sunburst are significant lower than those for zoomable tree map. Only the values for AttrakDiff’s hedonic quality-stimulation and attractiveness for zoomable sunburst were significant higher than for
5434
Antje Heinicke et al. / Procedia Manufacturing 3 (2015) 5427 – 5434
collapsible tree and zoomable sunburst. Also zoomable sunburst was preferred to sequence sunburst in the pair-bypair comparison. The other tested sunburst version, sequence sunburst, reached on average better results, however, gets only for AttrakDiff's hedonic quality-stimulation significant higher ratings than one other visualization (zoomable tree map). Zoomable sunburst has not won a single pair-by-pair comparison. In contrast to the results from another study [2] where sunburst was among the best rated visualizations in terms of efficiency and effectiveness it cannot be confirmed that sunburst is a good method to present the DMS creditor data in an interactive form. Hence, sunburst can be used as gimmick but is not useable for everyday work with large data sets. The usual visualization type for data structures, collapsible tree, ranks in the middle regarding efficiency, effectiveness and attractiveness. It won the pair-by-pair comparison against all other visualizations and is in principle well suited to present the used data. Even though the differences to all other visualization are not always significant, when using zoomable tree map the best results regarding the following values were achieved: relative frequency of not successfully processed tasks, task execution time, fixation count visualization, fixation count breadcrumb, RSME and AttrakDiff’s pragmatic quality. Also it was most often mentioned as the best visualization and won the pair-by-pair comparisons against zoomable sunburst and sequence sunburst. Only for AttrakDiff’s hedonic quality-stimulation zoomable tree map get the lowest ratings from all visualizations (significant in comparison with the two sunburst diagrams). According to the study’s results zoomable tree map is the most appropriate visualization type for the used DMS data and thus can be recommended for interactive presentation of data structures. Acknowledgements The joint research project uSelect DMS (01MU12018A) is supported by the Federal Ministry of Economics and Technology within the framework of the research program "SME-Digital" initiative "Simply intuitive - usability for SMEs" program. References [1] Sontow K, Treutlein P, Sontow R (2012), ERP in der Praxis - Anwenderzufriedenheit, Nutzen & Perspektiven. Trovarit AG, 2012. [2] Heinicke, A.; Bröhl, C.; Bützler, J.; Schlick, C.: Usability of Document Management Systems Considering Users' Level of Experience: A Survey, In: Proceedings of the 5th International Conference on Applied Human Factors and Ergonomics 2014 (AHFE), Hrsg.: Ahram, T.; Karwowski, W.; Marek, T., The Printing House, Inc., Stoughton, FL, USA 2014, ISBN 978-1-4951-1572-1, S. 359-367 [3] Woywode et al. 2012, Woywode, M., Mädche, A., Wallach, D., Plach, M., „Gebrauchstauglichkeit von Anwendungssoftware als Wettbewerbsfaktor für kleine und mittlere Unternehmen (KMU)“, http://www.usability-in-germany.de/ergebnis, letzter Aufruf 08.04.2015, 2012 [4] Plaisant, C.; Grosjean, J.; Bederson, B.B.: SpaceTree: Supporting Exploration in Large Node Link Tree, Design Evolution and Empirical Evaluation. In: IEEE Symposium on Information Visualization, 2002. INFOVIS 2002, 2002, S. 57–64 [5] Herman, I.; Melancon, G.; Marshall, M.S.: Graph Visualization and Navigation in Information Visualization: A Survey. In: IEEE Transactions on Visualization and Computer Graphics Bd. 6 (2000), Nr. 1, S. 24–43 [6] Cawthon, N. and Vande Moere, A..: The effect of aesthetic on the usability of data visualization, In IEEE Int. Conf. Info Vis (IV’07), Zurich, Switzerland, pages 637–648, 2007. [7] Hassenzahl, M.; Burmester, M.; and Koller, F. 2003. AttrakDiff: Ein Fragebogen zur Messung wahrgenommener hedonischer und pragmatischer Qualität. In: Mensch& Computer 2003. Interaktion in Bewegung, Hrsg.: J. Ziegler & G. Szwillus, S. 187-196. [8] Zijlstra, F. R. H. 1993. Efficiency in work behavior: A design approach for modern tools. Delft: Delft University Press. [9] Bützler, J.; Bröhl, S.;Schlick, C. M. Altersrobuste kognitionsergonomische Gestaltung von Netzplänen in Projektmanagement Software. In VerANTWORTung für die Arbeit der Zukunft, 61. Kongress der Gesellschaft für Arbeitswissenschaft. GfA-Press, 2015. [10] Bostock, M.; Ogievetsky, V. ; Heer, J.: D3: Data-Driven Documents. In: IEEE Transactions on Visualization and Computer Graphics Bd. 17 (2011), Nr. 12, S. 2301–2309