Using Augmentations as Bridges from Concrete to Abstract Representations Guillaume Zufferey, Patrick Jermann, Son Do-Lenh, Pierre Dillenbourg Center for Research and Support of Learning and its Technologies Ecole Polytechnique Fédérale de Lausanne 1015 Lausanne, Switzerland
{guillaume.zufferey, patrick.jermann, son.dolenh, pierre.dillenbourg}@epfl.ch ABSTRACT We describe a pedagogical approach supporting the acquisition of abstraction skills by apprentices in logistics. Apprentices start with a concrete representation in the form of a small-scale model which aims at engaging them in learning activities. Multiple External Representations are used to progressively introduce more abstract representations displayed on paper-based forms called TinkerSheets. We present the implementation of this approach on the TinkerTable, a tabletop learning environment which is used in two professional schools by four different teachers. We report observations of the use of the environment at different stages of the curriculum with first- and second-year apprentices.
Categories and Subject Descriptors H.5 [Information Interfaces and Presentation]: Miscellaneous; K.3 [Computers and Education]: Computer Uses in Education—collaborative learning
Keywords
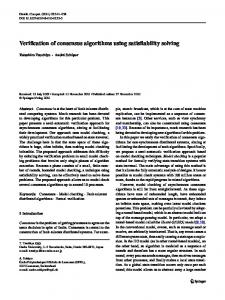
Figure 1: Two apprentices building a warehouse layout on the TinkerLamp.
Tangible User Interfaces, Multiple External Representations, Vocational Training
1.
INTRODUCTION
In our country, 70% of young people learn a profession directly after obligatory schooling. The vocational training system is mostly organized in a dual way. Apprentices go to school one day per week and spend the rest of the time working in a company. A field study conducted in the field of logistics identified issues related to the way theoretical concepts are taught at school and the limited responsabilities given to apprentices at their workplace. It appears that most of the apprentices in logistics lack the necessary skills to understand the concepts presented at school. Moreover, the practical experience they acquire at their workplace is often limited to moving boxes in their warehouse with a forklift, without being involved in the more complex aspects of their trade. c 2009 by the Association for ACM COPYRIGHT NOTICE. Copyright Computing Machinery, Inc. Permission to make digital or hard copies of part or all of this work for personal or classroom use is granted without fee provided that copies are not made or distributed for profit or commercial advantage and that copies bear this notice and the full citation on the first page. Copyrights for components of this work owned by others than ACM must be honored. Abstracting with credit is permitted. To copy otherwise, to republish, to post on servers, or to redistribute to lists, requires prior specific permission and/or a fee. Request permissions from Publications Dept., ACM, Inc., fax +1 (212) 869-0481, or
[email protected].
The TinkerTable is a tabletop learning environment developed for apprentices in logistics. It offers two complementary physical interaction modalities. Apprentices use a smallscale model to design warehouse layouts (Fig. 1) and paperbased forms called TinkerSheets to control parameters and visualize data. The main objective of this environment is to overcome the weak abstraction skills of apprentices at the beginning of their apprenticeship, and accompany them during the whole curriculum to compensate for the lack of meaningful practical experience they develop at the workplace. In this contribution, we describe a pedagogical approach we developed for the TinkerTable. It has the particularity to build on the two levels of representation offered by the smallscale model and the TinkerSheets to support apprentices to switch from the concrete and situated representation of the small-scale model to disembodied and abstract representations displayed on TinkerSheets. It relies on the use of multiple external representations (MERs) to support the progressive integration of increasingly more abstract representations. After discussing related work in the field of TUIs for education and MERs, we describe the context of our work and present the TinkerTable. We then give a detailed descrip-
tion of our pedagogical approach, illustrate its use through three sessions in logistics classrooms and finally discuss our observations.
2. RELATED WORK 2.1 Tangible User Interfaces Tangible User Interfaces (TUIs) [11, 9] bridge the gap between real and digital worlds, allowing users to interact with computers in a physical way and providing them with a strong coupling between input and output. They opened the way for the creation of novel types of interfaces, building on the implicit knowledge people have of everyday objects [5]. Many applications of TUIs have taken place in the field of education. The added value of sensori-motor experience is often described in projects involving young children [17]. The advantage of graspable and tangible interfaces relies on the idea that they support an enactive mode of reasoning [4] and enable empirical abstractions of sensori-motor schemes [15]. Another interesting aspect of TUIs is that they might lower the threshold of participation [10]. They have also been described as being particularly well adapted for children, people with learning disabilities and novices [23]. Most of the applications of TUIs for learning have taken place in a few domains. These include storytelling [13, 20], programming [14, 22, 7] and dynamic systems [18, 24]. We could find only one work explicitly addressing vocational education which explored the use of graspable interfaces for vocational training in pneumatics [19]. Physical manipulatives can be classified in two broad categories. Specific manipulatives are objects which have a strong resemblance with their virtual counterparts (e.g. toy car or model of a building). Generic manipulatives do not have a clear meaning and can be associated with any kind of virtual objects (e.g. tokens or cubes). This property is referred to in different frameworks developed for describing and analyzing TUIs. Fishkin [8] refers to it as the degree of metaphor, which is a continuous axis going from no metaphor, where physical manipulations are not connected to any real-world analogy (e.g. command-line interface), to full metaphor, where no analogy at all is needed as the physical object is identical to the virtual one (e.g. deformable landscape [16]). Edge and Blackwell propose the tangible correlates of cognitive dimensions [6], an adaptation of the cognitive dimensions framework [3] meant to support the design and analysis of TUIs. Among the correlates they describe, structural correspondence and adaptability are closely related to the categorization of tangibles as specific or generic objects. Structural correspondence is defined as the similarity between the physical structure and the information structure represented. Adaptability is referred to as the ability to redefine how states are interpreted. According to Edge and Blackwell, combining structural correspondence and adaptability in a single object is difficult as it is not clear how different meanings could be assigned to an object which is clearly identified by its physical structure. Their recommendations include that emphasis should be put on role expressiveness when designing for novices, while experts might profit more from adaptability oriented designs. Most of the works applying TUIs to education are based
on manipulatives situated at a single level of structural correspondence and adaptability. They use either specific or generic objects. We propose a novel approach which explicitly uses manipulatives at two levels of abstraction as a design choice, and takes advantage of their differences to develop a tool able to accompany apprentices during the whole duration of their curriculum.
2.2
Multiple External Representations
Taxonomic frameworks for TUIs often refer to the integration of physical and digital representations as a key factor for describing different systems [11, 21]. In a discussion on the effectiveness of tangible interfaces in enhancing learning processes [12], Marshall criticizes the lack of guidance offered by these frameworks on how to use these representations to support learning outcomes. He recommends to designers to get some guidance from the large body of research on the role of external representations in learning. Bruner [4] defines three levels of representations. The enactive level corresponds to representations that are experienced in a physical way. The figurative level encompasses representations which have some resemblance with the represented information (e.g. a map of a room shares a spatial relationship with the room it represents). At the iconic level, there is no more relationship between the representation and the concept it represents. Interpretation is only possible through the use of conventions (e.g. written numbers). According to Bruner [4], it is possible to teach everything as long as the representation that is used corresponds to the level of the learner. Multiple External Representations (MERs) have been proposed as a way to facilitate the transition from one level of representation to another [2]. The main assumption is that presenting learners with several instances of the same information at different levels of representations will act as a scaffold allowing them to understand the more abstract representation by observing how it is related to the more concrete one. In our contribution, we rely on MERs to help apprentices to progressively understand representations of increasing abstraction levels, supporting them in the transition from the concrete representation they build on their profession at their workplace to the abstract concepts presented at school in their course book.
3. CONTEXT 3.1 Abstraction gap Apprentices in logistics usually work in a warehouse where they are responsible for the reception, storage and expedition of goods. During a typical work day, their duties include unloading trucks delivering goods to the warehouse, moving them to the storage area using a forklift and preparing customer orders. In our country, most of the apprentices are part of a dual vocational training system which concerns 70% of young people after obligatory schooling. They go to school one day per week and spend the rest of the time working in a company. A priori, this seems to be a good organisation for apprentices who have the opportunity to apply the theoretical concepts they learn at school in an authentic setting. The practical experience acquired at the workplace is in turn useful to understand new concepts presented at school as they can relate them to their practice.
manager. The driver module corresponds to the tasks usually assigned to apprentices at their workplace. It includes concepts related to the navigation in a warehouse, the different types of forklifts available, security measures and forklift maintenance. This module is not addressed by the TinkerTable, as it corresponds to the level of tasks apprentices are usually given at their workplace and the concepts presented at school do not pose any particular problem.
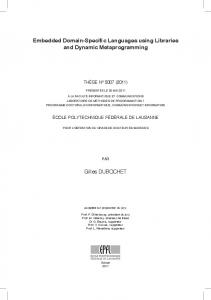
Figure 2: Left: The TinkerTable, a tabletop learning environment for apprentices in logistics. Right: The TinkerLamp, a smaller and lighter version of the TinkerTable. A field study we conducted in the summer of 2006 involving visits to twelve companies, observations at school as well as interviews with teachers, apprentices and their supervisors showed us that the reality is different from this idealized description. In many of the companies that we visited, apprentices are restricted to relatively basic tasks, often limited to moving boxes in the warehouse without knowing why they are doing it. Decisions related to storage management or warehouse organization are usually reserved for senior logisticians or office workers. Apprentices are not involved in the management process. They do not acquire the practical experience that would be useful when transferred to the school to understand theoretical aspects of their profession. Moreover, teachers reported another difficulty they face while teaching logistics concepts to their apprentices. The apprenticeship in logistics is one of the less demanding professions offered by the vocational training system in terms of school expectations. This orientation is often chosen by young people who used to perform badly during obligatory schooling and enter the vocational training system with important knowledge gaps. These two issues contribute to what we call the abstraction gap. On one hand, apprentices lack sufficient abstraction skills to understand the theory as it is currently presented at school. On the other hand, they do not get the chance to practice the more complex aspects of their profession in an authentic setting where they would be easier to understand. As a result, many apprentices lose interest in school and never get to understand important concepts that would be useful later in their career. Our tentative to fill this gap is the TinkerTable, a tabletop learning environment co-developed with two teachers of a professional school. The goal of the TinkerTable is to provide apprentices with an integrated environment that helps them to overcome the abstraction gap and accompanies them during the whole duration of their apprenticeship.
3.2
Curriculum
The curriculum of apprentices in logistics can be divided in three modules of increasing complexity: driver, designer and
The designer module includes all the notions related to the layout of a warehouse. Apprentices should learn how to evaluate the quality of a layout, answering questions like what are the trade-offs that must be made between work efficiency and storage capacity or why should a given type of forklift be used in a situation and not in another one. Logisticians might have to organize a warehouse when their company moves to a new place or gets bigger and needs to reorganize the storage areas. It is then important for apprentices to know the parameters that should be taken into account when organizing a warehouse and understand how to apply them. The last module, called manager, corresponds to all the concepts related to the logistics flows in a warehouse. There are two types of flows: physical flows, the physical movement of goods, and information flows, the information describing the physical flows. The goal of the manager module is to introduce apprentices with notions related to storage management. They should learn how to read simple charts showing storage levels and storage breaks and decide when it is necessary to reorder a given product and how much should be reordered. They should also understand the different strategies that can be used to manage a storage in an efficient way, taking for example costs into account.
3.3
TinkerTable
The TinkerTable is a tabletop environment made of a 2m by 1.5m table covered with white board material and a gallows carrying a camera-projector system (Fig.2). The camera gets the position of tagged objects using StudierStube Tracker [1], a fiducial markers tracking library. The projector is used to augment these objects by projecting information on top of them. Users interact with the environment through two different modalities: a Tangible User Interface (TUI) and a Paper-Based Interface called TinkerSheets [25]. The TUI is a small-scale model of a warehouse made of wooden shelves, metallic pillars, wooden docks and cardboard obstacles (e.g. offices, technical rooms), all scaled at 1:16. These objects can be used to create the layout of a warehouse, which is then augmented with projections illustrating the concepts addressed during logistics classes. Simulations can be run on top of the model too, allowing apprentices to evaluate the efficiency of a given layout depending on a large set of parameters including forklifts’ type, customers demand, delivery time and costs. TinkerSheets are paper-based forms used to control the parameters of the simulation (e.g. augmentations, type of forklifts, speed, . . . ) and visualize data (e.g. storage size, average distance of shelves to the reception dock, storage level,
. . . ). As we can see on Figure 3, TinkerSheets are also tagged with fiducial markers. This allows the system to detect and locate a sheet. A simple computer vision algorithm is then used to detect dark tokens (i.e. magnets) used to set parameter values. Textual information is printed on each TinkerSheet, allowing users to recognize the parameters and/or visualizations attached to a sheet. Four primitives are currently implemented: radio buttons, sliders, textual feedback and graphical feedback. In a second design iteration, we developed the TinkerLamp, a smaller and portable version of the TinkerTable shown on Figure 2. It consists of a projector and a camera mounted in a metal casing suspended above a regular classroom table by an aluminum goose neck. This environment provides identical functionalities to those offered by the TinkerTable. The only differences between the table and the lamp versions of the system are the scale of the objects (1:16 on the table and 1:50 on the lamp) and the size of the projection (2m by 1.5m and 50cm by 37cm). On the lamp, TinkerSheets are also scaled to 40% of their original size (A4) to cope with the smaller available space.
3.4
Classroom usage
Four teachers from two different schools have been using the system since September 2008. A TinkerTable and a TinkerLamp are installed in the school of the two teachers who co-developed the environment while four TinkerLamps are used by two teachers in the other school. From a development perspective, the main effort is now put on creating activities with the teachers to progressively cover the whole curriculum of apprentices. Giving an extensive description of the functionalities is not possible here for space reasons. We limit the description to an overview of the current state of the system.
Figure 3: A user setting a parameter value on a TinkerSheet using a black magnet.
i.e. the small-scale model and the TinkerSheets, to propose different levels of representations to the apprentices. Multiple External Representations are used as a way to facilitate the move from one level of representation to the other. By explicitly designing the pedagogical approach of the system around these two levels of representations, our assumption is that it will be able to first engage apprentices at the beginning of their apprenticeship with a level corresponding to their limited abstraction skills, and second accompany them through each step of their apprenticeship without creating new abstraction gaps. We now describe in more detail the role of the small-scale model, the TinkerSheets and MERs in this model.
4.2 The TinkerTable allows teachers to create many different activities. More than 50 parameters can be set using TinkerSheets, and roughly the same quantity of feedback is available in either a textual or a graphical form. It is possible to run simulations on any layout designed with the small-scale model, in a near real-time or in fast mode. During a near real-time simulation, virtual forklifts are projected on top of the model and move boxes between the storage area and the docks (Fig. 7). Different storage and work strategies (e.g. first-in first-out) are implemented and can be defined on corresponding TinkerSheets. Time can be accelerated up to 10 times. In the fast simulation mode, one day is equivalent to 2 seconds, allowing teachers to address concepts related to storage management which are only significant over longer terms. The next section discusses the pedagogical approach addressing the problem of the abstraction gap and describes how it as been implemented on the TinkerTable.
4. TOWARDS ABSTRACTION 4.1 Overview Figure 4 shows a schematic view of the model that was followed for the design of the TinkerTable and its integration in the curriculum of apprentices in logistics. The main idea is to build on the properties of two interaction modalities,
Small-scale model
The goal of the small-scale model is to propose an appropriate level of representation for apprentices at the beginning of their apprenticeship. It takes into account the abstraction gap by considering both their limited abstraction skills and their lack of practical experience that can be transfered in a meaningful way to the concepts presented at school. In terms of the tangible correlates of cognitive dimensions [6], the small-scale model has a high structural correspondence and a low adaptability. Elements of the model are similar to the virtual objects they represent and it is not easy to assign them different meanings because of their specificity. It is also interesting to note that they not only are a concrete representation of the virtual world, but also serve as a link to the internal representation apprentices have of their workplace. Using Bruner’s terms [4], the small-scale model provides a figurative representation of a warehouse which is easy for apprentices to relate to their own experience.
4.3
TinkerSheets
While paper-based interfaces are not always considered as TUIs, we describe them as such for several reasons. First of all, they share the main properties usually pointed out to describe specific aspects of TUIs. They provide users with a physical modality of interaction, allow them to communicate with computers using the metaphor of paper forms and they propose a close mapping between input and output.
5.
FIELD STUDY
As already stated, a TinkerTable and several TinkerLamps are used on a regular basis by four teachers in two different schools. This gave us the opportunity to observe and record videos of more than twenty two-hours sessions involving classes of first- and second-year apprentices using our learning environment. In the rest of this section, we describe three sessions that illustrate the use of the TinkerTable at different levels of the curriculum and give an overview of the transition towards abstract representations. Figure 4: Illustration of the abstraction gap and the relationships between school, workplace and the two interaction modalities (TUI and TinkerSheets).
Compared to the small-scale model, TinkerSheets are at the opposite side of the abstraction level scale. They have a low structural correspondence, sharing no attribute with the information they display, and have a high adaptability as they can be associated with any kind of information. In other words, TinkerSheets offer a generic container for information allowing us to assign them any level of representation, figurative or symbolic. While the small-scale model has an inherent meaning deeply anchored in its physical properties, particularly strong for logisticians who can relate the model to their own workplace, sheets of paper do not convey any particular meaning. It is fully determined by their printed information and the augmentation which is projected on top of them. For all these reasons, TinkerSheets are very close to the type of representation that apprentices find in their course book, with the important difference that they allow the presentation of dynamic content.
4.4
MERs
MERs are at the core of the pedagogical design of the TinkerTable. They are the medium that supports the apprentices in the understanding of progressively more abstract representations. They support the transition from the situated context provided by the small-scale model and the disembodied representations projected on TinkerSheets. The idea is to present apprentices with the same information projected both on the warehouse small-scale model and on the TinkerSheets, allowing them to relate one representation to the other and progressively build a valid model explaining the more abstract form of presentation given on the TinkerSheets. MERs are not limited to the information projected on top of the small-scale model. The different objects of the small-scale model and their spatial organization are external representations that should also be taken into account. These physical objects are at the center of our approach as they are at the junction between the workplace and the school. They represent at the same time the real workplace of apprentices and the virtual model of a warehouse built in the software. The role of the augmentations is to increase adaptability which is low for the physical objects themselves. By doing this, the meaning of the physical objects in the model is extended and is getting closer to the representations displayed on the TinkerSheets.
5.1 5.1.1
Activity 1: Alley width Description
This session took place on the TinkerTable and a TinkerLamp with a class of first-year apprentices. The goal of the activity was for the apprentices to discover the impact of the type of forklifts on alley width. Choosing a forklift type is a trade-off between many variables. For example, a smaller forklift has a lower cost and allows to use a smaller alley width but results in slower work and limitations in terms of the boxes’ weight and height of the shelves. During this activity, the top of the shelves of the small-scale model were augmented with information about their accessibility (see Figure 5). A shelf can contain a maximum of 9 boxes on three levels, each divided in three columns. It is accessible if there is enough space for a forklift to reach its content. This information is presented through a square, representing a box, surrounded by two triangles pointing towards the square. Each triangle is either green or red, indicating whether a forklift can access its content from the corresponding side or not. If both triangles are red, the square is red as well. This representation is the result of several design iterations trying to disambiguate the fact that a shelf is accessible from both sides, which did not appear to be obvious for many apprentices. Two TinkerSheets were used during this activity. The first one allowed apprentices and their teacher to choose among three types of forklifts while the other displayed the number of shelves and accessible boxes in the warehouse. In the first part of the activity, groups of apprentices were instructed to use the small-scale model to design the layout of a warehouse, placing as many shelves as possible in a given area of the table, with the additional constraint that shelves’ orientation was fixed. When apprentices were satisfied with their design, they wrote down the number of shelves and accessible boxes. They were then asked to repeat the same task with the two other types of forklifts. After completing the task, each group sat around a table in the classroom and tried to deduce some conclusions from their results. At the end of the session, the teacher organized a debriefing session where the conclusions of each group were discussed.
5.1.2
Augmentations as bridges
In this case we have two types of representations for the number of shelves: the small-scale shelves on the table and the total number written on the TinkerSheet. In addition, the TinkerSheet displays the number of accessible boxes. The augmentations allow to make explicit the precise numbers corresponding to the intuition of quantity.
Figure 5: Activity 1. Left: Accessibility information projected on top of shelves. Right: Apprentices giving the last touch to their layout.
The accessibility is represented in three ways: the observable distance between shelves on the table (leading to comments like: it’s ok here, you can go through with your forfklit! ), the red and green squares and triangles projected on top of the shelves (No, it’s red now, move it away! ) and finally through the juxtaposition of the total number of shelves and the number of accessible ones.
5.1.3
Observations
The main observation we did during this session is that the small-scale model seems to be situated at the right level of representation for first-year apprentices. Even though they were using the system for the first time, they got quickly involved in strong discussions on how to place the shelves on the table. The constraint about the orientation of the shelves was difficult to respect for them as they wanted to take advantage of different orientations to place more shelves in the available space. We had the impression that this rule was perceived by apprentices as being arbitrary, which it actually is, and we plan to remove it in the future. Following a constrained orientation was not natural for them as it had no reason to exist.
The difficulties we had to find a clear augmentation showing the accessibility of the shelves while clearly indicating that a shelf does not have to be accessible from both sides illustrates the difficulties some apprentices have when they enter the vocational training system. At the beginning of the session, the teacher placed a small-scale model of a box in a shelf to clearly show that a shelf is wide enough to contain only one box, such that only one of its side has to be accessible. Even with the current augmentation, some apprentices still do not place shelves next to each other and insist on leaving both sides of the shelves accessible for forklifts. On several occasions, one member of a group pointed out that it was not necessary to leave space on both sides of shelves. Most of the time, these apprentices had strong arguments with the rest of their group, and sometimes the teacher had to intervene to give them a hint.
5.2 5.2.1
Activity 2: Surfaces Description
This second session took place on the TinkerTable and a TinkerLamp with a class of apprentices in the beginning of their second year. At this time, apprentices were reaching the end of the designer module. The objective of the activity was to teach the different types of surfaces that are
Figure 6: A TinkerSheet displaying information about surfaces updated in real-time. The left part of the sheet gives information in a textual way. A radio button below the graphical representation allows apprentices to display either the net or the raw storage surface.
used to describe a warehouse and illustrate the impact of a warehouse layout on work efficiency. In their curriculum, apprentices in logistics have to be familiar with three kinds of surfaces. The raw surface, which is simply the surface of the whole warehouse, the raw storage surface, which is the raw surface from which adjoining rooms have been removed (offices, technical rooms, docks, . . . ) and the net storage surface, which is the raw storage surface minus the alleys (i.e. surface of shelves on the TinkerTable). While these definitions seem to be quite simple, some apprentices still have problems to remember them and are most of the time not able to make a rough estimate of their relative importance when presented with the blueprint of a warehouse. In a questionnaire we distributed to several classes asking apprentices to choose among four layouts printed on paper the one with the largest net storage surface for instance, most of them gave a wrong answer. We also asked them to estimate the absolute value of this surface and the largest answers we received differed with more than one order of magnitude with the smallest one. The same was true for questions asking for percentages, with answers ranging from less than 10% to more than 70%. The task of apprentices was to design a warehouse layout maximizing both the percentage of net storage surface and the work efficiency. In a first layout phase, they were asked to use only ten shelves, which correspond to a very low usage of the table surface. The teachers then discussed with them the surfaces corresponding to this amount of shelves and asked them to think about how they could augment the percentage of net storage surface. Each group was then given time to build a warehouse with as many shelves as they wanted and were encouraged to try different layouts. When apprentices were satisfied with a given layout, a near realtime simulation was run to test its efficiency. The goal of the simulation was to test how much time four forklifts would need to move one hundred boxes from the storage area to the expedition dock. During a simulation, the system projects
virtual forklifts moving boxes in the warehouse. The content of the shelves is projected on their top and is represented by colored rectangles corresponding to different product types (see Figure 7). During this session, apprentices used one TinkerSheet to control the simulation and two others to visualize data. One of them displayed graphical and textual information about the surfaces (see Figure 6). The textual information included absolute and relative values of the three types of surfaces described above. The graphical information showed a 2D scaled visualization of the warehouse layout highlighting either the net or the raw storage surface. It is worth noting that the graphical display is identical to the one given in the class book of apprentices. The last sheet displayed information about the simulation state including time, amount of boxes moved to the expedition docks and waiting customer orders.
5.2.2
Augmentations as bridges
Surfaces are represented three times in this activity: through the perception of the physical properties of the small-scale model (relation between space occupied by objects and table size), by a downscaled drawing on a TinkerSheet and finally numerically by absolute and relative numbers. The graphical representation on the TinkerSheet is the bridge beetwen the specific area of the warehouse (highlighted in a different colour, dark rectangles on Figure 6) and the numbers which represent it.
5.2.3
Observations
Several groups followed a surprising pattern during the initial layout phase. These groups placed the shelves as if they were gas particles, trying to maximize the distance between each of them and thus using the whole surface of the table even though a small fraction of it would have been necessary. They then read percentage of net storage surface on the TinkerSheet and observed that it was really low (below 10%). They tried to augment it by regrouping all the shelves in one corner of the table and were surprised to see that the number did not augment. A group member finally understood the reason why it did not change and could explain it to the others. While the intuition about grouping the shelves together has some valid ground (augmenting the density of the shelves augments their relative usage of space), these groups failed to take into account the fact that the raw surface of the warehouse does not change whatever the position of the ten shelves. It illustrates the difficulty that apprentices have to imagine proportions and spatial relationships.
5.3 5.3.1
Activity 3: Storage management Description
The third session took place on the TinkerTable with a class of apprentices in the middle of their second year, currently in the manager module. The objective was to introduce concepts related to storage management. Given a set of parameters including the annual demand for a given product and suppliers’ delivery delays, apprentices were asked to define a restocking strategy minimizing the storage breaks. Two values could be modified by apprentices. The product reorder limit (i.e. the product should be restocked if its amount in the warehouse goes below this value) and the size of product
Figure 7: An augmented warehouse layout during a simulation on a TinkerLamp. Four virtual forklifts are working, moving boxes between the docks and the shelves. The content of the shelves is displayed on top of them.
reorders (i.e. when a product has to be restocked, order this amount of boxes to the supplier). The difficulty for apprentices is to understand how these values are related to external factors like customer demand and delivery time. If for example the suppliers’ delivery delay become longer, the typical reaction of apprentices is to augment the size of reorders. This does not solve the problem because reorders are still issued when the amount of available boxes of a product reaches the same limit. As the reorder is delivered later, more boxes of this product will be ordered by customers in the interval between the reorder time and its delivery, resulting in storage breaks. Another aspect that the teachers addressed during this session is the Andler formula which is used to compute the theoretical optimal reorder size. It is an equation which takes as input several parameters including the annual customers’ demand, the fixed ordering costs, the storage costs and the price of a given product and computes the optimal size of reorders for this product. It is actually computing a trade-off between reordering and storage costs, finding the reorder size that minimizes their sum. Figure 9 shows a graphical representation of this formula as presented to the apprentices on the TinkerTable, which is identical to the one printed in their course book. This formula is rather complicated in comparison with the math level of the average apprentice and the number of parameters involved make it difficult to interpret intuitively. The aim of the teachers was thus to let apprentices experiment with the parameters of the formula, allowing them to observe how they influence the optimal reorder size by modifying the curves of costs. At the beginning of the session, apprentices were instructed to build a warehouse layout that would then be used during the rest of the activity. This part is optional as previously created layouts can be saved using a dedicated TinkerSheet and reloaded at any time. When the apprentices were happy with their design, the teacher froze the layout and asked them to remove all the elements of the small-scale model. The projection of the warehouse was then reduced to 25%
Figure 8: The TinkerTable during a simulation in fast mode. The small-scale model has been removed from the table surface. The layout of the warehouse is displayed in 2 dimensions, scaled down to 25% of its original size. TinkerSheets allowing apprentices to control products’ parameters are aligned on the right part of the table. Storage levels, storage breaks and the Andler formula are displayed in the form of dynamic charts on TinkerSheets placed at the bottom center of the table. of its original size and switched to a 2D mode. The teacher finally set initial external parameters (customer demand, delivery delays and costs) and launched a simulation in fast mode. Figure 8 shows the surface of the table during this simulation. The 2D scaled warehouse layout is projected at the top center of the table. Apprentices have spread several sheets around it, which are used to control the simulation parameters and visualize the storage state. Three types of products are used during this simulation mode and their parameters can be set independently. The central part of the activity was to first equilibrate the reordering parameters to cope with the initial parameters and then test different external parameters to observe their influence on the storage strategy and the Andler formula. The apprentices and their teacher used twelve different TinkerSheets during this activity. Each product has two dedicated sheets to control its external parameters and its reorder strategy. Two other sheets display charts showing storage levels and storage breaks. The curves of all the products are displayed on the same graphs but it is possible to focus on one product only. A sheet was used to display a graphical representation of the Andler formula. The three last sheets were dedicated to the control of the simulation as well as saving and loading functionalities.
5.3.2
Augmentations as bridges
The physical flow of items is represented twice: as an animation of the content of the shelf on the projected warehouse layout and by the evolution of the curves on the charts displayed on TinkerSheets. Understanding the meaning of desembodied charts is made possible by the animation of a concrete representation.
5.3.3
Observations
Figure 9: Top left: TinkerSheet displaying the storage level of three product types on a dynamic chart. Top right: TinkerSheets displaying the storage breaks of three product types. Bottom: Graphical representation of the Andler formula on a TinkerSheet. Reorder size is given on the horizontal axis, costs on the vertical axis. The blue curve (increasing value with the order size) stands for the storage costs and order costs are given by the green curve (decreasing value with the order size). The red curve (U-shape) represents the sum of the storage and the order costs, and its minimum value indicates the optimal theoretical order size.
During this session, apprentices were working with abstract representations, using mostly TinkerSheets. What we observed is that they were able to read and make sense of the curves displayed on the charts. What appeared is that the relationships between reorder limit, reorder size and external parameters were not understood by most of the apprentices. When asked to react to an increase of the suppliers’ delivery time, they often had the wrong reaction and augmented the size of the reorders and were then surprised to see that they ended up having systematic storage breaks. The simulation was useful to illustrate in a dynamic example the impact of external parameters on storage levels and how a logistician can react to avoid storage breaks. Another interesting observation is that the two-dimensional down-scaled projection of the warehouse layout was useful to ground the values presented on the TinkerSheets. On several occasions, the teacher asked a group to look at it when it was showing an almost empty storage area. He discussed with them the pertinence of keeping the warehouse most of the time empty and the different actions that could be taken to reduce the costs (i.e. move to a smaller warehouse or rent available space). This example also illustrates some values that would be necessary to display on TinkerSheets if we wanted to create a representation getting rid of the warehouse layout, like the percentage of available space in the warehouse for instance.
6.
DISCUSSION
The three sessions reported in the previous section illustrate the use of the TinkerTable at different stages of the apprenticeship of logisticians. The first general comment
we can make about these observations is that the pedagogical approach we implemented seems to be adequate. The level of representation offered at each stage seems to be well adapted. The apprentices are able to read the different representations, which allows them to actively engage in the activities. The difficulties encountered by several groups in the first activity show that they really need a representation at least as concrete as the small-scale model. Most of the problems identified during the activities come less from the level of representations than from a lack of comprehension of the concepts. In these cases, the environment allowed the teachers to identify the concepts that were not clear for apprentices and focus on them during the activity. These examples also demonstrate the importance of the collaborative setting offered by the TinkerTable. A pattern we often found in the groups we observed is that some apprentices have a better understanding of the concepts addressed during the activity and explain them to their peers. These three situations give an overview of the progressive move towards abstract representations and the use of MERs at each level. During the first activity, the main representation is the small-scale model. TinkerSheets are used only for displaying information that is embedded in the model itself. The number of shelves, for instance, could be obtained by simply counting them. The same is true for the amount of available storage places. We can not really use the term MERs here, but our assumption is that we still have multiple representations embedded in the small-scale model. As described earlier, the small-scale model offers a strong link with both the virtual world and the workplace of each apprentice. Each object thus represents two things in the mind of apprentices: the interface to the simulation and an authentic workplace. It is not clear whether apprentices really have these two internal representations. Seeing the small-scale model as either the bridge to the virtual world or to the more concrete world of the workplace corresponds to the concepts of ready-at-hand (the model is invisible to apprentices) and present-at-hand (apprentices reflect about the model) [5]. Marshall [12] argues that passing from one view to the other is important in learning situations and it would thus be interesting to support it. During the second activity, the focus is both on the smallscale model and on the TinkerSheets. The action is mainly taking place on the small-scale model, as apprentices have to move the shelves to optimize surface usage. Little action happens on the sheets, but they display the most interesting information, the values of the different kinds of surfaces. Three external representations are available for apprentices. The placement of shelves on the table, which could allow them to estimate their score, the graphical representation of the warehouse layout on a TinkerSheet and the textual representation of the actual surfaces values. The goal here is to relate the abstract information of a percentage of net storage value to a visual representation. Our hope is that apprentices will get an intuitive understanding of what it means to have a percentage of net storage surface of 23%. Is it a lot? How does a warehouse with such a percentage looks like? In the last activity reported, the focus is mainly on the TinkerSheets, both in terms of actions and information seeking.
The information displayed on the TinkerSheets is made of charts showing the evolution of storage levels and storage breaks. The small-scale model has been removed from the table and is now projected in a scaled 2-dimensional way, reduced to a role of awareness information. Our observations show that this representation is still important as it links the abstract information displayed on the charts to its meaning in an actual warehouse layout. It allowed the teacher to point out some problems that would have gone undetected on the sheets.
7.
CONCLUSION AND FUTURE WORK
We presented a pedagogical approach for the TinkerTable, a tabletop learning environment for apprentices in logistics. This approach is built on the physical properties of two interaction modalities, a small-scale model of a warehouse offering a concrete representation, and TinkerSheets, a paperbased interface used as a generic information container. The main goal of this approach is to support the move from concrete to abstract representations, relying on MERs to support the understanding of progressively more abstract representations. We illustrated the implementation of this approach through the description of three typical sessions with apprentices at different stages of their apprenticeship. Our observations indicate that the levels of representation offered by the two interaction modalities are well adapted to the particular needs of the apprentices who are able to engage in meaningful activities. Future work includes additional developments to allow teachers to address more logistics concepts using our environment. We are also interested in performing longitudinal data analysis that would allow us to evaluate learning outcomes obtained with the TinkerTable.
8.
ACKNOWLEDGMENTS
This project is part of Dual-T, a leading house on technologies for vocational training, funded by the Swiss Departement of Economic Affairs. We would like to thank the teachers, Andr´e Ryser, Jacques Kurzo, Hans Erni and Boris Seiler for their strong support and willingness to innovate.
9.
REFERENCES
[1] Studierstube tracker. http://www.imagination.at, last seen on march 5. [2] S. Ainsworth. Deft: a conceptual framework for considering learning with multiple representations. Journal of Learning and Instruction, 2006. [3] A. Blackwell and T. Green. HCI Models, theories and frameworks: Towards a multidisciplinary science, chapter Notational systems - The cognitive dimensions of notations framework, pages 103–133. 2003. [4] J. S. Bruner. Toward a theory of instruction. Norton, 1966. [5] P. Dourish. Where the action Is: the foundations of embodied interaction. MIT Press, 2001. [6] D. Edge and A. Blackwell. Correlates of the cognitive dimensions for tangible user interface. Journal of Visual Languages & Computing, 17(4):366–394, August 2006. [7] Y. Fernaeus and J. Tholander. Finding design qualities in a tangible programming space. In CHI ’06:
[8]
[9]
[10]
[11]
[12]
[13]
[14]
[15]
[16]
[17]
Proceedings of the SIGCHI conference on Human Factors in computing systems, pages 447–456, New York, NY, USA, 2006. ACM Press. K. P. Fishkin. A taxonomy for and analysis of tangible interfaces. Personal Ubiquitous Comput., 8(5):347–358, 2004. G. W. Fitzmaurice, H. Ishii, and W. A. S. Buxton. Bricks: laying the foundations for graspable user interfaces. In Proceedings of CHI 1995, pages 442–449. ACM Press/Addison-Wesley Publishing Co., 1995. E. Hornecker and J. Buur. Getting a grip on tangible interaction: a framework on physical space and social interaction. In CHI ’06: Proceedings of the SIGCHI conference on Human Factors in computing systems, pages 437–446, New York, NY, USA, 2006. ACM Press. H. Ishii and B. Ullmer. Tangible bits: Towards seamless interfaces between people, bits and atoms. In CHI ’97, pages 234–241, 1997. P. Marshall. Do tangible interfaces enhance learning? In TEI ’07: Proceedings of the 1st international conference on Tangible and embedded interaction, pages 163–170, New York, NY, USA, 2007. ACM. A. Mazalek, G. Davenport, and H. Ishii. Tangible viewpoints: a physical approach to multimedia stories. pages 153–160, 2002. T. S. McNerney. From turtles to tangible programming bricks: explorations in physical language design. Personal Ubiquitous Comput., 8(5):326–337, 2004. J. Piaget. The future of developmental child psychology. Journal of Youth and Adolescence, 3:87–93, 1974. B. Piper, C. Ratti, and H. Ishii. Illuminating clay: a 3-d tangible interface for landscape analysis. In CHI ’02: Proceedings of the SIGCHI conference on Human factors in computing systems, pages 355–362, New York, NY, USA, 2002. ACM. S. Price and Y. Rogers. Let’s get physical: the learning benefits of interacting in digitally augmented physical
spaces. Comput. Educ., 43(1-2):137–151, 2004. [18] M. Resnick, F. Martin, R. Berg, R. Borovoy, V. Colella, K. Kramer, and B. Silverman. Digital manipulatives: new toys to think with. In CHI ’98: Proceedings of the SIGCHI conference on Human factors in computing systems, pages 281–287, New York, NY, USA, 1998. ACM Press/Addison-Wesley Publishing Co. [19] K. Schmudlach, E. Hornecker, H. Ernst, and F. W. Bruns. Bridging reality and virtuality in vocational training. pages 137–138, 2000. [20] D. Stanton, V. Bayon, H. Neale, A. Ghali, S. Benford, S. Cobb, R. Ingram, C. O’Malley, J. Wilson, and T. Pridmore. Classroom collaboration in the design of tangible interfaces for storytelling. In CHI ’01: Proceedings of the SIGCHI conference on Human factors in computing systems, pages 482–489, New York, NY, USA, 2001. ACM. [21] B. Ullmer and H. Ishii. Emerging frameworks for tangible user interfaces. IBM Systems Journal, 39:915–931, 2000. [22] P. Wyeth and H. C. Purchase. Tangible programming elements for young children. In CHI ’02: CHI ’02 extended abstracts on Human factors in computing systems, pages 774–775, New York, NY, USA, 2002. ACM. [23] O. Zuckerman, S. Arida, and M. Resnick. Extending tangible interfaces for education: digital montessori-inspired manipulatives. In CHI ’05: Proceedings of the SIGCHI conference on Human factors in computing systems, pages 859–868, New York, NY, USA, 2005. ACM Press. [24] O. Zuckerman and M. Resnick. System blocks: A physical interface for system dynamics simulation. In Proceedings of CHI ’03, 2003. [25] G. Zufferey, P. Jermann, A. Lucchi, and P. Dillenbourg. Tinkersheets: Using paper forms to control and visualize tangible simulations. In TEI’09, Third International Conference on Embedded and Tangible Interaction.