Proceedings of the Ninth International Conference on Machine Learning and Cybernetics, Qingdao, 11-14 July 2010
USING EEG TO DETECT DRIVERS’ EMOTION WITH BAYESIAN NETWORKS XIN-AN FAN, LU-ZHENG BI, ZHI-LONG CHEN School of Mechanical Engineering, Beijing Institute of Technology, Beijing 100081, China E-MAIL:
[email protected],
[email protected],
[email protected]
Abstract: Driver behavior plays a critical role in driving safety. Besides alcohol and fatigue, emotion is another factor influencing driver behavior. Thus, the detection of driver emotion can contribute to improve driving safety. In this paper, we use Bayesian Network (BNs) to develop a detection model of driver emotion with electroencephalogram (EEG), which considers two factors of driver personality and traffic situation. The preliminary experiment results suggest that this method is feasible and therefore can be used to provide adaptive aiding.
Keywords: Driver emotion; Driving safety; EEG; Detection model; Bayesian Networks
1.
Introduction
As the number of motor vehicles grows, the number of motor vehicle crashes also increases. According to statistics, in recent years, traffic fatalities are 10 million each year in china, the most fatalities country around the world. The statistical results from Public Security show that there were 265,204 crashes in China in 2008, which caused the cost of 10.1 million Yuan, fatalities of 73,484, and injuries of 30,4919. During the first half of 2009, there were 29,866 people dead and 128,336 people injured in the 107,193 crashes. The cost of property was 4.1 billion Yuan [1]. Thus improving driving safety becomes rather crucial. A general agreement that driver behavior plays a critical role in driving safety has been reached [2]. Some studies demonstrate that emotion is another factor influencing driver behavior besides alcohol and fatigue [3]. L. James’ research shows that if drivers are in an angry state, driving performance will be impaired [4]. If a real-time detection model of emotional states of drivers can be proposed, it can be used to help develop driver assistant systems, and thus can contribute to improve driving safety. Some researchers have investigated how to detect emotion states by tracking the changes of facial expressions and physiological signals in real-time [5-6]. Studies show that physiological signals have significant changes between different emotional states [7-10].
In this respect of factors of emotion states, psychologists have found that personality has an effect on emotional states. In addition, external environment can affect emotional states [11]. Considering findings mentioned above, Qiang Ji et al. proposed a detection model of emotion states, which integrates personal information, background information, and bio-signals with Bayesian Networks (BNs) [12]. In the model, they incorporated an active sensing mechanism into the Dynamical Bayesian Networks (DBN) framework to infer user’s affective state [12-13]. They, however, just validated the detection of fatigue state by experiments, and they didn’t choose electroencephalogram (EEG) as one of evidence sources. In this paper, we propose a driver’s emotion detection model from EEG with Bayesian Network (BNs), which integrates driver personality and traffic situation. First we introduce an emotional state detection model with Bayesian networks. Then we describe the relative EEG power spectrum and feature selection. Finally, we validate the model with experimental data. 2.
The model of emotion detection with Bayesian Networks
2.1. Bayesian Networks Bayesian networks are also called Belief networks or Causal networks. It is a graph model that describes the relationship among variables, and a kind of model used in reasoning. Its nodes stand for random variables whereas the directed arcs mean direct causal relationship between nodes. The uncertainty of the interdependence of variables is shown by the conditional probability table of each corresponding node, given its parents. One of the most important features of BNs is that the joint probability distribution can be factored out as a product of the conditional distributions in the network [14].
978-1-4244-6525-5/10/$26.00 © 2010 IEEE 1177
Proceedings of the Ninth International Conference on Machine Learning and Cybernetics, Qingdao, 11-14 July 2010 2.2. The model of drivers’ emotion detection with Bayesian Networks This paper proposes a driver’s emotion detection model with Bayesian Networks (BNs). In this model, driver personality and traffic situation are chose as the priori factors affecting emotional states and EEG signal is used a sensory observation. As shown in Figure 1, the model captures the drivers’ personality, traffic situation, emotional states, and driver EEG.
m
l
P (ei ) = ∑ ∑ P (c p , jq ,ei ) q
p
m
l
q
p w=1
2
= ∑ ∑ ∑ Pr (ei / Pa (ei )) m
l
q
p
= ∑ ∑ P (c p )×P ( jq )×P (ei / jq )×P (ei / c p )
(1)
where P (c p ) is the possibility of personality, P ( j ) is the q possibility of traffic situation, of emotional states,
Pa (ei ) is the parent node
P (ei / c p ) and P (ei / jq )
are the
probability of emotion under the condition of personality and traffic situation, respectively. We can compute the condition probability distribution, P ( t k / e i ) , of features with the data from the experiments.
According to the joint probability distribution theory: P (tk , ei ) = P (t k / ei ) × p (ei ) , (2) where e i is the ith emotional state, t k is the kth feature of EEG signals, and P ( t k , e i ) represents the joint probability
Figure 1. Detection model of drivers’ emotional states
Psychologists have found that personality has an effect on emotional states. Studies show that “Krapelin-Uchida” continuous addition test (hereafter called UK test) can show the difference in the personality by the value of the personality deviation, represented as PF [15]. In addition, researchers found that the excessive information from traffic situation would be bad to driving [11]. In addition, researchers found that the excessive information from traffic situation would be bad to driving. In this model shown in Figure 1, there are four variables. We assume that E = {e1 , e 2 , e 3 ,...,e h } represents possible
emotional
states,
personality of drivers, and
C = {c 1 , c 2 , c 3 ,...,c l }
J = { j 1 , j 2 , j 3 ,...,j m }
means
represents
possible traffic situation. The nodes of personality and traffic situation are the parents of emotion node, and they are independent. T = {t 1 , t 2 , t 3 ,...,t n } represents the features of EEG.
distribution of emotional states and features. According to the probability distribution theory, the posterior probability distribution of emotional state is as follows:
P '( ei ) = P (ei / tk ) P (t k , ei ) = P (t k ) P (tk / ei )× p ( ei ) = ∑ P (tk / ei )× p ( ei ) i
3.
Feature selection
In this paper, we chose the power spectrum of EEG as features to develop the detection model. Because of good variance characteristics, the method of Welch was used to estimate the power spectrum. 3.1. Power spectrum estimation based on Welch The basic idea of Welch is to divide data x N ( n ) whose
Prior probability value of emotional states can be defined as P(ei ) . It can be computed by the formula:
(3)
length is N into L sections, and the length of each section is M. By averaging the power spectrum of each section, the variance characteristics can be improved. Each section can partly overlap with other sections.
1178
Proceedings of the Ninth International Conference on Machine Learning and Cybernetics, Qingdao, 11-14 July 2010
The window of each section, d ( n ) , can be rectangular-window, hanning-window, or hamming-window.
fij =
Si + S j i j 2 ( mean(t ) − mean(t )) ,i ≠ j = i i 2 j j 2 (t − mean(t )) + (t − mean(t ))
^ i
P PER ( f ) , represents the power spectrum of the ith section: ^i
P PER ( f ) = where U =
1
M −1
MU
n =0
2
∑ xNi ( n)d (n)e − j 2π fn
i
,
(4)
Fij
where t is
(7)
the feature of the ith state, F ij is the square of
1
M −1
difference between means of one certain feature of two
M
n =0
i corresponding states, S i is the variance of t . The features
∑ d 2 (n) .
The average of the power spectrum is: ~
P PER ( f ) = =
1 L
L
can finally be selected by using the following decision rule:
^i
∑ P PER ( f )
*
E = arg max( fij ), i ≠ j
i =1
1 LMU
L
M −1
∑ ∑x i =1 n = 0
t
2 i N
( n) d ( n )e
− j 2π fn
(8)
(5) 4.
3.2. Feature selection
Experiment
In our preliminary experiment, we took the recognition of angry and happy emotions (i.e. E = ( e1 , e 2 ) ) as an
(1) Artifact removal The amplitude of EEG is quite low, which is about 50µV, and the frequency range is 0.5~50Hz. Moreover, it contains other artifacts. Therefore we need to remove the artifacts before using the EEG signal. Studies show that artifacts include the vivo and vitro signals. The sources of vitro signal mainly involve EEG instrument, and the electromagnetic interference from alternating current and environment. By linking the GND channel of electroencephalograph to the ground, and keeping good contact between electrodes and scalp, the interference can be inhibited effectively. The vivo noise sources include pulses, body movement, and eye blinking, which are almost at the low frequency range of less than 5Hz [16]. EEG can be divided into five bands: δ (0-4 Hz), θ (4-8 Hz), α (8-13 Hz), β (13-30 Hz), and γ (30-50 Hz) [16]. So we removed the δ band to eliminate artificial signals which are at the low frequency part, and used the low-pass filtering to remove the high frequency part greater than 50Hz. (2) Feature Selection Due to the individual differences, the power spectrum should be normalized to select appropriate features. The paper used the equation (6) to normalize the power spectrum: (6) T =T / T RV
Sr
Tr
where TRV is the relative power spectrum, TSr is the power spectrum of the selected band, and TTr is the value of the whole band of 4-50Hz. The function of feature selection is defined as follows:
example to show the feasibility of the proposed method considering the factor of personality but without considering traffic situation due to the limitation of time and conditions. 4.1. Participants Nine subjects (aged 22 to 26) are healthy males, and they all have neither any history of brain diseases nor eating any drugs before the experiments. 4.2. Method In this paper, we used simulated emotional states of drivers in the laboratory. Two kinds of videos were chosen to evoke the states. According to the relationships between personality, environment, and emotional states [11], we preset the prior probability of states subjectively. We chose 3 video sections to evoke the two states, respectively, and subjects were asked to answer some questions to ensure the success of each stimulus. The questionnaire includes two questions: “what emotion you were in?” and “what the magnitude (on a scale of 0-4) of emotion was?” The higher the level, the more obviously the state is. 4.3. Data collection The data were collected by 192 channel digital brain wave measurement system of Japan NEURO Company Studies found that the cerebral amygdala, cerebral hippocampus, area, and the bilateral frontal lobe had some
1179
Proceedings of the Ninth International Conference on Machine Learning and Cybernetics, Qingdao, 11-14 July 2010
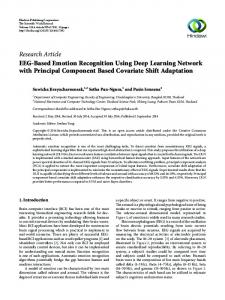
correlation to emotion. Therefore we collected the data from such channels: F3, F4, C3, C4, P3, P4, O1, O2, P7, P8, T7, T8, F7, and F8. Figure 2 shows the position distribution of the used channels marked by red circles.
1.4 1.2
X: 48 Y: 1.035
X: 40 Y: 1.007
Feature Value
1 0.8
X: 16 Y: 0.9035
0.6 0.4 0.2 0
0
10
20
30 Feature NO.
Figure 4. The values of
f ij
40
50
for 56 features
As shown in Figure 4, the maximum value of f ij is Figure 2. Position distribution diagram of selected electrodes
4.4. Results (1) Artifact removal According to the method of artifact removal, we filtered the artifact. Figure 3 shows the plots of the original and filtered signals. The Results indicate that the filtered signal can reflect EEG well. 100
80
80
60
60
40
40
20
20
0 -20
TABLE 1 POSTERIORI PROBABILITY DISTRIBUTION OF EMOTIONAL STATES
0 -20
-40
-40
-60
-60
-80 -100
(3) Emotion recognition Based on Bayesian networks model, 1200 samples from each emotional state were chosen to train the model. Then the probability distributions of emotional states based on the 48th feature were shown in Table 1:
Filtered
100
Amplitude
Amplitude
Unfiltered
1.035, and the number of feature is 48(the γ band of T8 channel). Thus the 48th feature was chosen.
-80 0
2
4 6 Time(s)
8
10
-100
0
2
4 6 Time(s)
8
10
Figure 3. EEG signal of P8, the left is the original signal, and the right is the filtered one
(2) Feature selection We took each two-second EEG data of each selected channel as a sample. According to the Equation (5), the power spectrum of each band of each sample was computed, by using humming-window, m=256, and overlapping number of 200. According to the Equation (8), the feature values were computed. 56 features were coded according to the sequence (F4, C3, F3, P3, P4, C4, O1, O2, P7 P8, T7, T8, F7, F8), and each channel had four features (θ, α, β, γ). 56 feature values are shown in Figure 4.
t 48
P ( e happy / t 48 )
P ( e angry / t 48 )
0~0.2 0.2~0.4 0.4~0.6 0.8~1.0
0.21831 0.61075 0.98917 1.0000
0.78169 0.38925 0.01083 0
According to Table 1, the criterion of state recognition is as follows: if t 48 > 0.2 , the state is the happy emotion ( t 48 : the value of the 48th feature); if t 48 ≤ 0.2 , the state is the angry emotion. The result shows that training accuracy is 73.33%. By using two groups of 1000 samples to test, the testing accuracy is 72.25%. The study above didn’t consider the effects of personality and traffic situation. In the next step, personality was considered. We used the PF value that can be obtained with UK test to divide subjects into two classifications in personality (i.e. C = {c 1 , c 2 } ). When the PF value was greater than 8, the subject was regarded as high deviation in personality whereas the PF value was less than or equal to 8, the subject was regarded as low deviation in personality. According to the rule, 5 subjects were in the classification of
1180
Proceedings of the Ninth International Conference on Machine Learning and Cybernetics, Qingdao, 11-14 July 2010
low deviation, four subjects were in the other classification. We used 600 samples to train and used 600 samples to test the proposed model for the low deviation classification. The selected feature is the 48th, and the results show that the training accuracy is 77.95%, and the testing accuracy is 78.17%. Furthermore, we employed 500 samples to train and test the model for the high deviation one, respectively. The feature is the 40th, and the result is 77.27% and 73.64%. 5.
Conclusions
This paper proposed a detection model of driver emotion from EEG with Bayesian Network (BNs), which integrates driver personality and the traffic situation. The preliminary results show that the model has good performance. This study strode a step forward toward the goal of developing a real-time detection model of driver emotion with bio-signals and some causes of driver emotion as inputs of the model. In practice, the real-time detection model can help develop driver assistant systems, and thus can contribute to reduce crashes. Furthermore, this study is good for developing personalized robots, such as the service robot. Our future research includes the following two aspects. First, we will validate the model of driver emotion recognition in vehicle simulator. Second, we will study the on-line detection model of driver emotion with dynamic Bayesian networks (DBNs). Acknowledgements
This paper is funded by Specialized Research Fund for the Doctoral Program of Higher Education under Grant 20070007043, and NSFC under grant 90920304. References
[1] http://www.mps.gov.cn/n16/n1282/n3553/index.html [2] John D. Lee, “fifty years of driving safety research”, Human Factors, Vol. 50, No.3, June 2008, pp.521-528 [3] Jolieke Mesken. Determinent and consequence of driver's emotion. Groningen, Nederland: University of Groningen, 2006. [4] L. James. Road Rage and Aggressive Driving. Prometheus Books, Amherst, NY, 2000. [5] Christine Lisetti, and Cynthia LeRouge, “Affective Computing in Tele-home Health”, Proceedings of the 37th Hawaii International Conference on System
Sciences, 2004:1-8, [6] Wang Zhiliang. “Artificial psychology and artificial emotion” (in Chinese), CAAI Transactions on Intelligent Systems, 2006,1 (1): 38-43. [7] Jonghwa Kim, Nikolaus Bee, Johannes Wagner,and Elisabeth André, “Emote toWin: Affective Interactions with a Computer Game Agent”, GI Jahrestagung, 2004: 159-164,. [8] J.S. Lerner, R.M. Gonzales, R.E. Dahl, Hariri, A.R., and S.E Taylor, “Facial expressions Of emotion reveal neuroendocrine and cardiovascular stress responses”, Biological Psychiatry, vol.58, 2005:743-750, [9] R.W. Picard, E. Vyzas, and J. Healey, “Toward machine emotional intelligence: analysis of affective physiological state”, IEEE Trans. Pattern Analysis and Machine Intelligence, vol. 23, no,10, Oct. 2001:1175 – 1191 [10] Kazuhiko Takahashi, “Remarks on SVM-Based Emotion Recognition from Multi-Modal Bio-Potential Signals”, Proceedings of the 2004 IEEE International Workshop on Robot and Human Interactive Communication, Sept. 2004:95-100 [11] Li Pengfei, Zhao Changshi, Cao Gengyong. “Research on Traffic Security Strategies Based on Traffic Psychology” (in Chinese), Modern Transportation Technology, 2008.10, 5 (5): 62-72 [12] Xiang yang Li, Qiang Ji, “Real-Time Nonintrusive Monitoring and Prediction of Driver Fatigue” [J]. IEEE Transactions on Vehicular Technology. vol. 53, NO.4. July.2004:1052-1068 [13] Xiang yang Li, Qiang Ji, “Active Affective State Detection and User Assistance With Dynamic Bayesian Networks”, IEEE Transactions on Systems, man, and Cybernetics—Part A: Systems and Humans, vol. 35, NO.1. Jan.2005:93-103 [14] Zhang Lian-wen, Guo Hai-peng. Introduction to Bayesian Networks (in Chinese). Science Press. Beijing. 2006:34-36 [15] Lu-Zheng Bi, Peng-Dong Wu, Zhi-Long Chen, Pei-Cheng Hu, Tamai Hirosi. Study on dynamic characteristics of brain information processing. Proceedings of the Second International Conference on Machine Learning and Cybernetics. Xi’an, November 2003: 2-5 [16] Li Ying-jie, Qiu Yi-hong, Zhu Yi-sheng. Analysis method and application of the EEG signal (in Chinese). Science Press. Beijing. 2009:12-13
1181