applied sciences Article
Vehicle Speed Estimation and Forecasting Methods Based on Cellular Floating Vehicle Data Wei-Kuang Lai 1,† , Ting-Huan Kuo 1, * and Chi-Hua Chen 2,3,4,5,† 1 2 3 4 5
* †
Department of Computer Science and Engineering, National Sun Yat-sen University, No. 70, Lienhai Road, Gushan District, Kaohsiung 804, Taiwan;
[email protected] Telecommunication Laboratories, Chunghwa Telecom Co., Ltd., No. 99, Dianyan Road, Yangmei District, Taoyuan 326, Taiwan;
[email protected] Department of Information Management and Finance, National Chiao Tung University, No. 1001 University Road, East District, Hsinchu 300, Taiwan Department of Communication and Technology, National Chiao Tung University, No. 1001 University Road, East District, Hsinchu 300, Taiwan Department of Electrical and Computer Engineering, National Chiao Tung University, No. 1001 University Road, East District, Hsinchu 300, Taiwan Correspondence:
[email protected]; Tel.: +886-7-5252-000 (ext. 4301); Fax: +886-7-5254-301 These authors contributed equally to this work.
Academic Editor: Antonio Fernández-Caballero Received: 9 November 2015; Accepted: 25 January 2016; Published: 5 February 2016
Abstract: Traffic information estimation and forecasting methods based on cellular floating vehicle data (CFVD) are proposed to analyze the signals (e.g., handovers (HOs), call arrivals (CAs), normal location updates (NLUs) and periodic location updates (PLUs)) from cellular networks. For traffic information estimation, analytic models are proposed to estimate the traffic flow in accordance with the amounts of HOs and NLUs and to estimate the traffic density in accordance with the amounts of CAs and PLUs. Then, the vehicle speeds can be estimated in accordance with the estimated traffic flows and estimated traffic densities. For vehicle speed forecasting, a back-propagation neural network algorithm is considered to predict the future vehicle speed in accordance with the current traffic information (i.e., the estimated vehicle speeds from CFVD). In the experimental environment, this study adopted the practical traffic information (i.e., traffic flow and vehicle speed) from Taiwan Area National Freeway Bureau as the input characteristics of the traffic simulation program and referred to the mobile station (MS) communication behaviors from Chunghwa Telecom to simulate the traffic information and communication records. The experimental results illustrated that the average accuracy of the vehicle speed forecasting method is 95.72%. Therefore, the proposed methods based on CFVD are suitable for an intelligent transportation system. Keywords: vehicle speed estimation; vehicle speed forecasting; cellular floating vehicle data; intelligent transportation system; cellular networks
1. Introduction In recent years, the usage and improvement of mobile techniques have been growing for a variety of real-life applications. For instance, many intelligent transportation systems (ITSs) and services have been designed and developed by several enterprises [1–4]. For the development of ITSs, studying how to collect the traffic information efficiently is a really important topic. The case studies of cooperative intelligent transportation systems (C-ITS) [2,3] and connected-vehicle technology [4] developed real-time traffic information collection methods and evaluated traffic status. Furthermore,
Appl. Sci. 2016, 6, 47; doi:10.3390/app6020047
www.mdpi.com/journal/applsci
Appl. Sci. 2016, 6, 47
2 of 19
Gao et al. [1] considered traffic status to predict travel time for the design of a navigation system and the avoidance of traffic jams. ITSs have three kinds of popular position collection approaches, which are the vehicle detector (VD), the reports of global positioning system (GPS)-equipped probe cars and cellular floating vehicle data (CFVD). VD is a sensor based on the techniques of active infrared/laser, magnetic, radar or video to regularly detect vehicles on a road for the analysis of time mean speed and traffic flow [5,6] GPS-equipped probe cars can periodically report their location information to a server for computing the space mean speed [7]. CFVD, which is obtained by tracking the network signals of the mobile station (MS) in the car, can be analyzed to estimate the traffic information (e.g., traffic flow, vehicle speed and traffic density) [5]. The advantages and limitations of these three methods are illustrated in the following paragraphs. The establishment cost and maintenance fees of VDs were discussed and analyzed in some studies from different countries [8]. For instance, the Texas Transportation Institute spent 43,500 U.S. dollars to install video image vehicle detection systems (VIVD) for the detection of real-time traffic information in 2002. The Ministry of Transportation and Communications in Taiwan spent 75,873 U.S. dollars to establish one VD per each kilometer on Taiwan Highway No. 1 for the collection of real-time road information [9]. However, the maintenance fees of VD solutions are really high because the damage of VD usually result by the environmental factors. Some studies discussed traffic collection and estimation methods based on the reports of GPS-equipped probe cars, which were compared to the traffic information from VDs for the evaluation of traffic estimation accuracies. For instance, Cheu et al. [10] showed that the lower error rate of space mean speed estimation (less than 3%) can be obtained with enough active probe vehicles. Herrera et al. [10] showed that GPS-equipped probe vehicles periodically recorded their speeds and locations in practical environments for traffic information estimation. Furthermore, their study suggested that a 2%–3% penetration of GPS-equipped probe vehicles is enough to provide accurate measurements of space mean speed. However, the cost of deployment of GPS-equipped probe cars is very expensive for reaching a penetration rate of 2%–3% [10,11]. CFVD can be obtained by tracking MS signals (call arrival (CA), handover (HO), double handover (DHO), normal location update (NLU) and period location update (PLU)), and it can be used for the analysis of traffic status [12,13]. Furthermore, the International Telecommunication Union (ITU) indicated that the handphone penetration rate is more than 100% in many countries [14], and the penetration rate is high enough to assume that everyone has a handphone. Therefore, some studies assumed one handphone in one vehicle. For instance, Lin et al. [9] analyzed two HO locations based on the location service (LCS) as CFVD to estimate the real-time travel time and real-time vehicle speed between HO locations. Their experimental results indicated that the accuracy of the proposed traffic information estimation method was high. However, due to tracing the routes of each MS, a higher computation power is required, and privacy threats may exist. Moreover, future traffic information forecasting based on CFVD has not been investigated. Therefore, this study proposes analytic models and traffic information estimation methods based on CFVD to obtain a low-cost solution for ITS. The proposed analytic models are used to analyze the relationship between traffic information (e.g., traffic flow, traffic density and vehicle speed) and the amount of cellular network signals (e.g., HO, NLU, CA and PLU). Then, traffic information can be estimated based on the proposed analytic models and CFVD. Furthermore, a vehicle speed forecasting method based on a back-propagation neural network (BPNN) algorithm is proposed to analyze the estimated vehicle speeds from CFVD and to predict the future vehicle speed for road users. The rest of this study is organized as follows. Section 2 discusses the related studies and techniques of traffic information estimation and forecasting methods. Section 3 purposes vehicle speed estimation and forecasting methods based on CFVD. A case study of a highway in Taiwan and experimental results are illustrated and analyzed in Section 4. Finally, Section 5 summarizes the contributions of this study and presents future work.
Appl. Sci. 2016, 6, 47
3 of 19
2. Literature Review In this section, the techniques of cellular networks, CFVD and traffic information forecasting methods are illustrated in the following subsections. The architecture of cellular networks and mobility management methods are described in Section 2.1. Section 2.2 presents the advantages and limitations of each CFVD method. Finally, traffic information estimation and forecasting methods based on data mining techniques are discussed in Section 2.3. 2.1. Cellular Networks This section presents the network architecture of the Global System for Mobile Communications (GSM)/General Packet Radio Service (GPRS)/Universal Mobile Telecommunications System (UMTS). The components and mobility management (MM) in cellular networks are described as follows. 2.1.1. System Components The GSM consists of the MS, base transceiver station (BTS), base station controller (BSC), mobile switching center (MSC), home location register (HLR) and visitor location register (VLR). MSs communicate with the network through the BTS and BSC via the A-bis interface (the interface between the BTS and the BSC). The BSC communicates with the MSC via the A (the interface between the BSC and the circuit switched core network) interface, and MSC can connect the calls from the MSs to the public switched telephone network (PSTN). Moreover, the HLR and VLR can provide mobility management and record the location information of the MS [15]. GPRS evolved from GSM and added two new components, which include the serving GPRS support node (SGSN) and the gateway GPRS support node (GGSN). GPRS can establish the data connection with the Internet. However, this study focuses on circuit-switched networks, and the signaling of packet-switched networks is not discussed and analyzed. The UMTS consists of user equipment (UE), Node B, the radio network controller (RNC) and the components in GSM and GPRS. UEs communicate with the network through Node B and the RNC via the Iub (the interface between the Node B and the RNC) interface. The BSC communicates with the MSC via the IuCS (the interface between the RNC and the circuit switched core network) interface, and the MSC can connect the calls from the UEs to the PSTN [15]. 2.1.2. Mobility Management For MM, the functions related to the management of the common transmission resources may be performed in accordance with the MS/UE. There are two modes, which include idle mode and radio resource (RR) connected mode in RR management. Idle Mode In idle mode, the location updating procedures are performed for MM. The location updating procedure is a general procedure, which is used for the following purposes [16]. (1) (2) (3)
Normal location updating: NLU is performed when a new location area is entered (European Telecommunications Standards Institute (ETSI), 1995). Periodic location updating: PLU is performed at the expiration of the timer (ETSI, 1995). International Mobile Subscriber Identity (IMSI) attach: IMSI attach is performed when the MS is turned on [16].
Radio Resource Connected Mode In RR connected mode, the handover procedures are performed for MM. The MSC can control the call and the MM of the MS during the call. When MS enters a new cell during a call, the handover procedure is performed to provide good quality RR by the MSC [17]. This study assumes that each
Appl. Sci. 2016, 6, 47
4 of 19
MS in the car can perform the handover procedure in accordance with the specification when the MS enters a new cell during a call. 2.2. Traffic Information Estimation Methods The techniques of traffic information estimation method based on CFVD can be classified into two groups, which include (1) location services and (2) signal statistics. 2.2.1. Location Services Several location positioning methods, which were defined in the LCS specification of the 3rd Generation Partnership Project (3GPP), could be grouped into three classes, including: (1) assisted GPS (A-GPS) methods; (2) mobile scan report (MSR)-based location methods; and (3) database lookup methods [18,19]. For A-GPS methods, a GPS component should be equipped in each MS to determine the location of the MS. However, these methods cannot be performed for the MSs without GPS components. Therefore, A-GPS methods are not discussed and applied in this study. For MSR-based location methods, each MS can send periodically MSR messages (e.g., received signal strength indication (RSSI), round-trip delay and relative delay) to core networks in cellular networks (e.g., Global System Mobile Communications (GSM), Universal Mobile Telecommunications System (UMTS) and Long-Term Evolution (LTE)) [9]. Some studies analyzed the MSR messages to determine the locations of MSs, and these locations can be used to estimate traffic information. For instance, Cheng et al. [9] proposed a fingerprint-positioning algorithm (FPA) based on the k-nearest neighbors (kNN) algorithm to analyze the RSSIs of MSR messages for generating the locations of MS in car, and the average vehicle speed and travel time between two locations of the same MS can be estimated by FPA. Because the interfaces of A-bis and Iub in radio networks should be monitored to retrieve RSSIs for FPA, it is required to have above 10,000 servers to deploy to proceed with recording and analysis by Taiwanese environment. However, core network signals (e.g., CA, HO, NLU and PLU) can be captured via the interfaces of A and IuCS, so only less than 100 servers are needed to be deployed by the Taiwanese environment. The experiment results of FPA showed a high accuracy of vehicle speed estimation, although this method may need higher signaling costs for sending MSR message between MSs and base stations. For database lookup methods, the information of cellular network signals, which include cell ID, CA, HO and NLU, are considered to generate the mapping table of cell ID, handoff-pair and geographic location. For instance, the cell ID can be retrieved to query the mapping table and to get the geographic location of the queried cell when the CA signal occurs, and the handoff-pair can be retrieved to query the mapping table and to get the geographic location of the queried handoff-pair when the HO signal occurs. When two or more locations of the same MS are determined by database lookup methods, the average vehicle speed and travel time between these locations can be estimated [20]. Birle et al. [21] recorded two handover signals to measure the retention period of each cell, and the time difference between handover signals and the length of the road segment covered by the cell could be analyzed for the estimation of vehicle speed. The locations of MSs can be precisely determined by using LCS methods, and traffic information can be obtained by the analyses of locations of MSs. However, the location of the MS should be traced, and the power consumption and time complexity of these methods are higher in runtime. Furthermore, the issue of the invasion of privacy should be considered and investigated. 2.2.2. Signal Statistics Some studies analyzed the relationship between traffic information and the amount of cellular network signals (e.g., NLU, PLU, HO and CA) on the road segments and proposed traffic information estimation methods based on signal statistics. For instance, Caceres et al. [22] collected and counted the handover events, which were triggered when the communicating MSs entered a new cell for traffic
Appl. Sci. 2016, 6, 47
5 of 19
flow estimation. Furthermore, a virtual traffic counter at inter-cell boundaries was proposed to monitor call events in different cells and to estimate traffic flow [23]. A method was proposed to retrieve the NLU events, which were triggered when MSs entered a new location area, and to estimate traffic flow in accordance with the amount of NLU events [24]. For traffic density estimation, a method was proposed to monitor the CA events and to analyze the relationship between traffic density and the amount of CA events [25]. These studies indicated that their proposed methods can estimate traffic information precisely with anonymous MSs. 2.2.3. Summary Although A-GPS and MRS-based location methods can obtain the precise location information of the MS, heavy computational loads are required for these methods. Database lookup methods may be used to obtain traffic information, but the frequency of vehicle speed report generation is not enough in Taiwan [12]. Moreover, due to tracking of the location of each MS, privacy challenges may arise from using location service methods. The amount of cellular network signals (e.g., NLU, PLU, HO and CA) from anonymous MSs can be collected and analyzed by signal statistics methods for traffic information estimation. However, long road segments that are covered by a location area are about 10 km, so the traffic information of short road segments cannot be obtained by the analysis of NLU and PLU events. Although the amount of HO events can be used to estimate the traffic condition of short road segments, the variation of HO events may be large in dynamic traffic environments. Therefore, this study proposes a data fusion method based on signal statistics to estimate and forecast traffic information for ITS. 2.3. Traffic Information Forecasting Methods For traffic information forecasting methods, several studies used data mining techniques (e.g., linear regression [26,27], logistic regression (LR) [28], Bayesian classifier [29,30], k-nearest neighbors (kNN) [31–33], artificial neural network (ANN) [34–37], etc.) to analyze the historical traffic information and obtain the forecasted traffic information. For traffic information forecasting methods based on regression approaches, some studies used and applied linear regression and LR approaches to predict the future vehicle speed, and the experimental results in these studies showed that the average accuracy of vehicle speed forecasting was higher than 90% for highways [26,28]. However, these regression approaches are unsuitable to analyze the non-linear distribution of data, so the accuracy of the vehicle speed prediction-based regression approach was only 73.3% for an urban road network in [27]. Furthermore, the regression approaches are the special cases of ANN without hidden layers, and the accuracy of the traffic information forecasting method based on ANN may be higher than regression approaches [34–37]. For traffic information forecasting methods based on probability approaches, Bayesian classifier approaches were proposed and used to analyze traffic information and conditions [29], and these approaches could be combined with regression approaches to improve the accuracy of traffic information prediction [30]. However, the assumption and limitation of Bayesian classifier approaches were the independence between input characteristics. Therefore, Bayesian classifier approaches may not be applied to a variety of practical cases. For traffic information forecasting methods based on the distances between data attributes, a kNN approach was proposed to analyze the previous arrival time, dwell time and delay time for bus arrival time prediction [31,32]. Moreover, some studies used a kNN approach to analyze the relationship of traffic information and weather conditions for the improvement of vehicle speed prediction [33]. Although the results showed that the mean relative errors of using the kNN method were lower, the power consumption and time complexity of the kNN method were higher with big data at runtime. For traffic information forecasting methods based on ANN, some studies proposed and applied ANN to forecast short-term traffic information, and the experimental results showed that the accuracy of using ANN was better than using other approaches [35–37]. Although a previous study classified
Appl. Sci. 2016, 6, 47
6 of 19
road segments into several road types for reducing ANN models [35], the diverse traffic characteristics of road segments may exist in the same type of road. Moreover, using ANN to analyze CFVD for short-term traffic information prediction has not been investigated. Therefore, this study proposed a traffic information forecasting method based on ANN to analyze and predict the traffic information of each road segment from CFVD. 3. Traffic Information Estimation and Forecasting Methods The traffic information estimation methods based on CFVD are proposed and analyzed in Section 3.1, and the estimated traffic information is adopted as the input parameters for the proposed traffic forecasting method in Section 3.2. The details of traffic information estimation and forecasting methods are described as follows. 3.1. Traffic Information Estimation Methods This study proposes some analytic models to estimate traffic flow based on the amount of HOs and NLUs and to estimate traffic density based on the amount of CAs and PLUs. The traffic information estimation method of CFVD is applied to estimate the traffic flow and traffic density. The estimated traffic flow and traffic density are then used for vehicle speed estimation. The notation used in this paper is summarized in Table 1. The vehicle speed can be estimated in accordance with traffic flow and traffic density by Equation (1) [19]. Ui “
Qi Ki
Table 1. The definition of notation. PLU, periodic location update; HO, handover; CA, all arrival; NLU, normal location update. Parameter
Description
Q (car/h) K (car/km) U (km/h) τ (h/call) λ (call/h) t (h/call) 1/µ (h/call) x (km) li (km) b (h) hi (event/h) ai (event/h) pi (event/h) qi,h (car/h) qi,n (car/h) k i,a (car/km) k i,p (car/km) ui,ha (km/h) ui,na (km/h) ui,hp (km/h) ui,np (km/h)
The practical traffic flow The practical traffic density The practical vehicle speed The call inter-arrival time The call arrival rate The call holding time The mean call holding time The time x is between the preceding call arrival and entering the target road The length of road segment covered by Celli The cycle time of PLU The amount of HOs of road segment covered by Celli The amount of CAs of road segment covered by Celli The amount of PLUs of road segment covered by Celli The estimated traffic flow by using hi The estimated traffic flow by using NLU events The estimated traffic density by using ai The estimated traffic density by using pi The estimated vehicle speed by using qi,h and k i,a The estimated vehicle speed by using qi,n and k i,a The estimated vehicle speed by using qi,h and k i,p The estimated vehicle speed by using qi,n and k i,p
Uiψ (km/h)
The practical vehicle speed of road segment i at cycle ψ
Uiψ`1 (km/h)
The practical vehicle speed of road segment i at cycle pψ ` 1q
Uiψ`11 (km/h)
The predicted vehicle speed of road segment i at cycle pψ ` 1q
uψ i,ha (km/h)
The estimated vehicle speed of ui,ha at cycle ψ
uψ i,na uψ i,hp uψ i,np
The estimated vehicle speed of ui,na at cycle ψ
(km/h) (km/h)
The estimated vehicle speed of ui,hp at cycle ψ
(km/h)
The estimated vehicle speed of ui,np at cycle ψ
(1)
Appl. Sci. 2016, 6, 47
7 of 19
3.1.1. Traffic Flow Estimation This study considers the amount of HOs (hi ) and the amount of NLUs (qi,n ) to estimate traffic Appl. Sci. 2016, 6, 47 7 of 20 flow (Qi ) on the road segment covered by Celli . This study considers the amount of HOs (hi) and the amount of NLUs (qi,n) to estimate traffic
Traffic flow Flow(QEstimation by Using HO Events i) on the road segment covered by Celli.
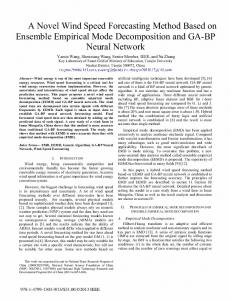
When a call arrives within the coverage area of a cell, the destination (or the originating) MS will Traffic Flow Estimation by Using HO Events be connected if a channel is available. While a communicating MS moves from the coverage area of When a call arrives within the coverage area of a cell, the destination (or the originating) MS will one cell to the coverage area of another cell, the channel in the old cell is released, and the new cell will be connected if a channel is available. While a communicating MS moves from the coverage area of provide a channel to the MS if there is a free channel. This process is called a handover. one cell to the coverage area of another cell, the channel in the old cell is released, and the new cell Figure 1a illustrates space for channel. vehicleThis movement handover on a road. will provide a channel the to the MS if diagram there is a free process is and calledthe a handover. Figure 1b depicts the timingthe diagram for thefor handover on the road segment covered byFigure Celli .1b The MS Figure 1a illustrates space diagram vehicle movement and the handover on a road. the timing diagram the handover on the1a,b); road segment by Cell Thehandover MS in a cararea of in a cardepicts performs the call set-upfor at time t0 (in Figure then, thecovered MS goes intoi. the performs call set-up at time t0 (in Figure 1a,b); then, the MS goes into the handover area of the the coverage ofthe Cell i´1 and Celli at time t1 (in Figure 1a,b), and the base station controller (BSC) or coverage of Cell i−1 and Celli at time t1 (in Figure 1a,b), and the base station controller (BSC) or radio radio network controller (RNC) will allocate an available channel for the communicating MS. At this network controller (RNC) will allocate an available channel for the communicating MS. At this moment, if Celli has a free channel, the connection between the MS and Celli will be established moment, if Celli has a free channel, the connection between the MS and Celli will be established successfully. The process is called a handover from Celli´1toto Cell . successfully. The process is called a handover from Celli−1 Celli. i
(a)
(b) Figure 1. (a) The scenario diagram for vehicle movement and the handover on the road; (b) the timing
Figure 1. (a) The scenario diagram for vehicle movement and the handover on the road; (b) the timing diagram for the handover on the road segment covered by Celli. BSC, base station controller; RNC, diagram for the handover on the road segment covered by Celli. BSC, base station controller; RNC, radio network controller. radio network controller. This study assumes that the call holding time (t) is exponentially distributed with the mean 1/ μ
This study assumes that the call holding time (t) is exponentially distributed with the mean 1{µ to generate handovers [25]. The average speed of cars is Ui, and the traffic flow is Qi. Furthermore, to generate handovers [25]. The average speed cars is Ui , and thethe traffic flow is Qbetween i . Furthermore, the length of road segment covered by Celli is lof i. Let the variable x be time difference t0 the length roadli/U segment Celli is between li . Let the variable be the time difference and of t1, and i denotescovered the timeby difference t1 and t2. Thex handover procedure will between be when the callthe holding (t) is larger than x.tThereby, amount of handover (hi) onwill be t0 and performed t1 , and li /U timetime difference between The handover procedure 1 and t2 .the i denotes the road segment covered by Cell i can be expressed as Equation (2), and this study can estimate performed when the call holding time (t) is larger than x. Thereby, the amount of handovertraffic (hi ) on the flow ( qi ,covered (3),be which is the traffic flow multiplied by the HO events. traffic h ) by using road segment byEquation Celli can expressed as Equation (2), and thisnumber study of can estimate flow (qi,h ) by using Equation (3), which is the traffic flow multiplied by the number of HO events.
Appl. Sci. 2016, 6, 47
8 of 20
Appl. Sci. 2016, 6, 47
8 of 19
hi = Qi ×
∞ x=0
Pr ( t > x ) dx
∞
hi
“ “ “ “
∞
− μt ş8× =Q dtdx t = xąμexq dx x = 0 pt Qi ˆ xi “0Pr ∞ ∞ ş × ş∞8 − e − μ´t µt = Q8 dx = Qi × e − μx dx i Qi ˆ 0 x µe t = xdtdx x=0 x“0x =t“ ¯ ş8 ´ − μx´µt ş8 ∞ ˇ8 ˇ Qdx e Qi ˆ x“0 −´e “ Qi ˆ x“0 e´µx dx t“=x i = Qi × μ ˜ μ ˇ8x = 0 ¸ Q ´e´µx ˇˇ “ i Qi ˆ µ ˇqxi“, h0= hi × μµ
(
)
(2) (2)
(3)
qi,h “ hi ˆ µ (3) Traffic Flow Estimation by Using NLU Events Traffic Flow Estimation by Using NLU Events In cellular networks, the NLU event is generated when an MS moves from a location area (LA) In cellular NLU event generated when an MSthe moves fromofa NLU location area (LA) to another LA. networks, Therefore, the traffic flow canisbe estimated by using number events. This to another LA. Therefore, traffic flow can be estimated by using the number of NLU events. This study assumes that the actual traffic flow on the road segment covered by Celli is Qi and one MS is study assumes that the actual traffic flow on the road segment covered by Celli is Qi and one MS is in in each car (shown in Figure 2) [24]. Therefore, the estimated traffic flow qi , n (i.e., the number of each car (shown in Figure 2) [24]. Therefore, the estimated traffic flow qi,n (i.e., the number of NLU NLU events) the segment road segment covered by Celli can be calculated as Equation (4), which is the events) on theon road covered by Cell i can be calculated as Equation (4), which is the traffic traffic flow multiplied by the number of NLU events. flow multiplied by the number of NLU events. =Q qqi,n Qii i,n “
(4) (4)
Figure Figure 2. 2. The The scenario scenario diagram diagram of of location location update update events. events. LA, LA, location location area. area.
3.1.2. Density Estimation Estimation 3.1.2. Traffic Traffic Density For density estimation, For traffic traffic density estimation, this this study study considers considers the the amount amount of of CAs CAs (a (aii)) and and the the amount amount of of periodic location updates (PLUs) (p i) to estimate traffic density (Ki) on the road segment covered by Celli. periodic location updates (PLUs) (pi ) to estimate traffic density (Ki ) on the road segment covered by Celli . Traffic Density Estimation by Using CA events Traffic Using CA events In Density cellular Estimation networks, abycell is supplied with radio service by vicinal BTSs or Node Bs. The BSC in GSM and RNC in UMTS are is responsible for the network control. When a call arrivesBs. within the In cellular networks, a cell supplied with radio service by vicinal BTSs or Node The BSC coverage area of a cell, the BSC or the RNC provides a free channel to the MS, and the MS will be in GSM and RNC in UMTS are responsible for the network control. When a call arrives within the connected withofthe corresponding station if there is a free channel. coverage area a cell, the BSC orbase the RNC provides a free channel to the MS, and the MS will be Figurewith 3a depicts the scenario diagram for vehicle movement and call arrivals on the road. Figure 4b connected the corresponding base station if there is a free channel. shows the timing diagram call arrivals on the segment coveredand by acall specific Cellon i. The in Figure 3a depicts thefor scenario diagram forroad vehicle movement arrivals theMS road. aFigure car moving along roaddiagram performsfor thecall first call at on time (in Figure 3a,b) and enters the coverage 4b shows thethe timing arrivals thet0road segment covered by a specific Celli . area of Cell i at time t 1 (in Figure 3a,b). The MS performs another call at time t 2 (in Figure 3a,b) before The MS in a car moving along the road performs the first call at time t0 (in Figure 3a,b) and enters the leaving i (time t3 iin and the callThe performed by the MS is call called a callt2arrival in Cell i. coverageCell area of Cell atFigure time t13a,b), (in Figure 3a,b). MS performs another at time (in Figure 3a,b)
Appl. Sci. 2016, 6, 47
9 of 19
before leaving Celli (time t3 in Figure 3a,b), and the call performed by the MS is called a call arrival in Cell i . 2016, 6, x Appl. Sci. 9 of 20
1st
2nd
(a) 1st Call Arrival
2nd Call Arrival t
Entering Cellii x t00
Leaving Cellii li/Ui
t11
t22
t33
(b) Figure3.3.(a) (a)The Thescenario scenariodiagram diagramfor forvehicle vehiclemovement movementand andcall callarrivals arrivalson onthe theroad; road;(b) (b)the thetiming timing Figure diagram for call arrivals on the road segment covered by Celli. diagram for call arrivals on the road segment covered by Celli.
Thisstudy studyassumes assumesthat that the the call call inter-arrival inter-arrival time time (τ) ( τ )isisexponentially exponentiallydistributed distributedwith withthe themean mean This generate call arrivals[25]. [25].The Thelength lengthofofroad roadsegment segmentcovered coveredby byCelli Celliisislil,i,and andthe theaverage average 1{λ generate call arrivals 1 / λtoto speedof ofcars carsisisUUi .i.Therefore, Therefore,lil/U i/Uii denotes the time time difference differencebetween betweentt11 and andtt33.. This This study study analyzes analyzes speed denotes the the amount amount of of call call arrivals t3 on thethe road segment covered by Cell i. The the arrivals (a (ai)i )that thatoccur occurbetween betweent1 tand t3 on road segment covered by Cell 1 and i. amount of call arrivals cancan be be expressed asasEquation this study study The amount of call arrivals expressed Equation(5), (5),and andEquation Equation(6) (6) indicates indicates that that this canderive deriveestimated estimatedtraffic trafficdensity density(k( i,a ) fromthe theamount amountofofcall callarrivals. arrivals. ki ,)a from can ai
×1Pră[tt1 2