1 INTRODUCTION. The collapse of the I-35W Mississippi River Bridge in Minneapolis, Minnesota, USA on August 1, 2007, was an unprecedented shock to the ...
Bridge Maintenance, Safety, Management and Life Extension – Chen, Frangopol & Ruan (Eds) © 2014 Taylor & Francis Group, London, 978-1-138-00103-9
Vibration-based damage detection and damage-induced stress redistribution of a real steel truss bridge C.W. Kim, K.C. Chang & S. Kitauchi
Department of Civil and Earth Resources Engineering, Kyoto University, Kyoto, Japan
M. Kawatani
Department of Civil Engineering, Kobe University, Kobe, Japan
ABSTRACT: This study investigated the practicability of a damage detection approach using vehicle-induced bridge vibrations to a real steel truss bridge subjected to artificial damage. Stress redistribution was observed under both static and dynamic vehicle loadings, implying that vehicle-induced bridge vibrations, even measured at members away from the damaged one, may carry information about damage. The damage were detected if a set of candidate observations collected from an unknown condition do not follow the same pattern of the observations from the known intact condition. The pattern dissimilarity was evaluated by the Mahalanobis-Taguchi system, by taking damage indicators calculated from a certain sensor group of bridge vibrations as variables. Among three candidate damage indicators, Nair’s damage sensitive feature was more sensitive to the artificial damage than dominant frequencies and damping ratios were. Damage localization was also feasible if sensors were densely deployed near the damaged member and adjacent sensors were grouped as variables. 1 INTRODUCTION The collapse of the I-35W Mississippi River Bridge in Minneapolis, Minnesota, USA on August 1, 2007, was an unprecedented shock to the civil engineering community (National Transportation Safety Board 2008). After the event, damage at members of steel truss bridges was also discovered during bridge inspections in Japan. In the aftermath of these events, the importance and need for bridge inspection/monitoring has increasingly become apparent. For the inspection/monitoring, vibration-based bridge health monitoring (BHM) have drawn relevant authorities’ great attention since it is expected to provide a more efficient way comparing to conventional visual inspections (e.g. Salawu 1997, Doebling et al. 1998). From the viewpoint of structural dynamics, damage changes bridge structural properties, such as sectional parameters, material parameters, energy dissipation mechanisms, and so on. Those structural properties relate to dynamic characteristics, which can be identified from the dynamic responses and then serve as damage indicators if they are sensitive enough to the damage. From the viewpoint of structural mechanics, damage also causes stress redistribution for the bridge under dead and live loads. The relation between the three factors: damage, redistributed stresses, and dynamic characteristics, is an important issue to be clarified.
How to excite small-to-medium-span bridges economically, reliably and rapidly is another technical issue in the vibration-based BHM. For those bridges, vehicles moving on them are dominant external vibration sources. Although the vehicleinduced vibrations are known to be non-stationary (e.g. Kim & Kawatani 2008, Chang et al. 2013), the idea of using them in BHM bases on the experience that repeatedly identified dynamic parameters under moving vehicles may form a specific pattern and provide useful information for damage detection (Kim et al. 2013). This study investigates how artificial damage in a truss member results in stress redistribution and how the stress redistribution affects the results of damage detection utilizing the vehicle-induced vibrations of a real nine-span continuous steel truss bridge. Within this scope, the measured stresses of certain truss members under dead, static and dynamic live loads are given for the intact and damaged bridge, respectively, right following the description of the field experiment given in next section. For damage detection, three candidate damage indicators obtained from the vehicle-induced bridge vibrations are tested herein: (1) dominant frequencies, (2) damping ratios and (3) Nair’s damage sensitive feature (NDSF), defined as a function of the coefficients of autoregressive (AR) models (Nair et al. 2006). The decisions on bridge health condition are made with the aid of the Mahalanobis-Taguchi system (MTS, Taguchi &
577
Jugulum 2000), a well-known multivariate patterninformation technology, by taking the indicators obtained from a group of sensors (variables in MTS) in several runs (observations in MTS) into analysis. Moreover, damage localization is preliminarily investigated, by taking the indicators from local groups of sensors into analysis. 2 FIELD EXPERIEMNT DESCRIPTION Field experiments were conducted on a real ninespan continuous steel truss bridge, as shown in Figure 1. The test span was the sixth span from the A1 abutment. The roadway roughness condition was poor due to lack of maintenance for quite a long time. Artificial damage was applied on the truss member D-4 by severing (see Figure 2). It is noteworthy that the damaged member was wrapped in a protection device with steel bars to prevent any possible bridge collapse due to the abrupt release of tensile force of the damaged member during the field experiment. For differentiation, the bridge before the artificial damage is referred to as the intact bridge (even though it may not perfectly intact as in its newly-constructed status) and the bridge after the damage as the damaged bridge. Fourteen uni-axis accelerometers were mounted vertically on the deck of the bridge, as shown in Figure 2. A denser accelerometer deployment around the damaged member is to investigate if it is beneficial to the damage detection and localization. Strain gauges were also deployed on members D-3, D-4, D-5, V-4, V-5, L-4, and L-5, to measure the stain changes, further to calculate the stress changes accordingly, before and after the severing of member D-4. The notation of the strain gages is also given in Figure 2. The MTS requires larger number of observations (i.e. runs in experiment) than of variables (i.e. sensors in experiment). However, only a limited number of runs were carried out in the field experiment due to limited time and cost. In consideration of this limitation, this study adopts data from certain sensor groups to reduce the number of variables. It is believed that reducing the number of variables in MTS has a similar effect to increasing the number of observations does. Three sensor groups (see Figure 2) are considered: Group 1 includes 7 sensors at the truss nodes on the damaged side, i.e. sensors No. 4 and 6 to 11; Group 2 includes two adjacent sensors, say sensors No. 1 and 2 in sub-Group A, No. 2 and 3 in B, and so on; Group3 includes the adjacent nodal sensors, i.e., sensors No. 1 and 2 in sub-Group A, No. 2 and 4 in BC, and so on. Sub-groups in Groups 2 and 3 are also used for damage localization besides damage detection as they are local groups. Group 3 with absence of non-nodal sensors (i.e. Nos. 3 and 5) serves as a comparison group to Group 2
for examining the feasibility of damage localization with not particularly dense sensor deployment around the damaged member. A three-axle cargo truck was adopted as the experiment vehicle in the two-day experiment campaign. The total vehicle weights were slightly altered from 253kN in the 1st day to 258kN in the 2nd day, but the difference in total weight and relevant loading distribution were considered small enough to be negligible in regard to its effect on the bridge responses. Photoelectric switches were mounted at two end-spans and the mid-span to locate the passing vehicle as well as to estimate its average speeds accordingly. An independent vehicle-drop test were performed prior to the field experiment and showed that vehicle’s natural frequencies were 3.0 Hz for the front axle, 3.5 Hz for the rear axles in bounce motion, 12 Hz for the front axle and 14 Hz for the rear axles in hop motions.
Observation span
Vehicle path
A1
P1 43.68
P5
Unit: m
P6 65.52
P8
A2 43.68
43.68*2+65.52*5=546
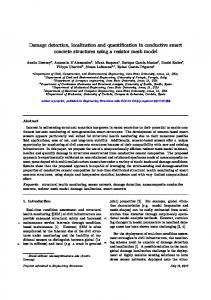
Figure 1. Photos and elevation view of the experiment bridge.
Group 1: (4, 6, 7, 8, 9, 10, 11) Group 2: A(1,2); B(2,3); C(3,4); D(4,5); E(5,6); F(6,7); G(7,8); H(8,9); I(9,10); J(10,11); K(12,13); L(13,14) Group 3: A(1,2); BC(2,4); DE(4,6); F(6,7); G(7,8); H(8,9); I(9,10); J(10,11); K(12,13); L(13,14)
Figure 2. Sensor-deployment layout and photos of the diagonal member before and after being severed.
578
Table 1 Stress change due to damage under dead load. __________________________________________________ Sensor ID Strain change* Stress change* ______________ Sensor location** (x10-6) (MPa) Section Member __________________________________________________ D-3 -41 -8.2 I A __________________________________________________ D-4-1 -288 -57.6 I B D-4-2 -214 -42.8 II B D-4-3 -400 -80.0 I A D-4-4 -313 -62.6 I C __________________________________________________ D-4'-1 111 22.2 I B D-4'-2 -40 -8.0 II B D-4'-3 91 18.2 I A __________________________________________________ D-5 -155 -30.9 I A __________________________________________________
For both intact and damaged bridges, their dynamic responses during the passage of the vehicle and were recorded and utilized in damage detection. In the experiment, 18 runs were carried out for the intact bridge: 4 runs with a vehicle speed of 10 km/h, 7 runs of 20 km/h and 7 runs of 40 km/hr. For the damaged bridge, 15 runs were carried out: 3 runs with a vehicle speed of 10 km/h, 6 runs of 20 km/h and 6 runs of 40 km/h.
V-4-1 222 44.4 III A V-4-2 410 82.1 IV A V-4-3 223 44.5 V A __________________________________________________ V-5-1 -158 -31.7 III A V-5-2 -25 -4.9 IV A __________________________________________________ L-4-1 -32 -6.4 I D L-4-2 42 8.3 II D __________________________________________________ L-5-1 3 0.6 I D L-5-2 -105 -21.0 II D __________________________________________________ * +: increase in tension, -: decrease in tension for D-4 and increase in compression for the others **
The stress redistribution due to the artificial damage in diagonal member D-4 is estimated from strain measurements. Table 1 shows the change in stresses of gauged members due to the damage under dead load. The largest change is observed in the damaged member, D-4, with an average of 60 MPa release in tensile stress; the second largest change is observed in the adjacent vertical member, V-4, with an average of 56 MPa increase in tensile stress; as for the members D-3, D-5 and V-5, their compressive stresses also increase, but with a magnitude smaller than 32 MPa. An interesting observation is that increases in both compressive and tensile stresses appear at members D-4’, L-4 and L-5, indicating that those members deformed out of plane with bending moments induced. Under static and dynamic vehicle loadings, strain responses of the artificially damaged member, D-4, and the adjacent vertical member, V-4, are plotted in Figures 3 and 4, respectively. The horizontal axis denotes the location of the vehicle’s front axle away from pier P5. Figure 3 shows the static and dynamic strain responses at member D-4 for both intact and damage conditions. It is observed that the artificial damage makes the peak strain magnitudes reduced to about half of those without damage. The strains of the severed member did not approach zero probably because the protection device partially prevents the out-of-plane behavior that a bridge usually performs when it is damaged asymmetrically and thus forces the severed member to take bending moment. Figure 4 shows the static and dynamic strain responses measured at member V-4. Unlike the damaged member, the adjacent vertical member presents little change in peak strain magnitudes. However, its responses following the peaks are larger after applying damage, indicating that damage may induce stress redistributions under vehicle loadings and conversely that vehicle-induced bridge vibrations may provide useful information for damage detection.
__________________________________________________
(a) P5
40 20 0 -20
P6 D-4 D-4-1s D-4-2s D-4-3s D-4-4s D-4-1d D-4-2d D-4-3d D-4-4d
0 20 40 60 Front axle position of the vehicle from P5 (m)
(b) Figure 3. Static (in discrete markers) and dynamic (in continuous curves) strain responses of the damaged member, D-4: (a) intact; (b) damage.
3 STRESS REDISTRIBUTION
579
those observations form a ‘reference’ group, called Mahalanobis space (MS) or unit space, after being normalized by the mean mi and standard deviation σi of the i-th variable, i.e. Xpi = (xpi-mi)/σi, i = 1~k, p = 1~n. With the MS, the Mahalanobis distance (MD) can be calculated for the p-th observation using the following equation MD p (a) P5
P6 V-4
60 V-4-1s V-4-2s V-4-3s V-4-1d V-4-2d V-4-3d
40 20 0 -20
(b)
0 20 40 60 Front axle position of the vehicle from P5 (m)
Figure 4. Static (in discrete markers) and dynamic (in continuous curves) strain responses of the vertical member V-4: (a) intact; (b) damage.
4 DAMAGE DETECTION FROM VEHICLEINDUCED BRIDGE VIBRATIONS 4.1 Mahalanobis-Taguchi System (MTS) for Damage Detection For the intact bridge, damage indicators identified from several runs (or observations) of dynamic responses may form a certain statistical pattern, while those for the damaged bridge may not follow this pattern. Based on this knowledge, the bridge damage can be detected by first recognizing the pattern of the observations of the intact bridge and then testing if a new observation, probably from the intact or damaged bridge, follows the above pattern or not: if yes, it is classified as intact; if no, it is classified as damage. To achieve this task, the MahalanobisTaguchi system (MTS), a multivariate patterninformation technology, is adopted in this study. The algorithm is introduced as follows. Given n observations, xp = [xp1, xp2, …, xpk], p = 1~n, collected from the intact condition with respect to k variables as
x1 x11 x12 x1k x x x22 x2 k 2 21 x xnk xn xn1 xn 2 k variables
n observations (1)
1 X p R -1MD X Tp k
(2)
where Xp = [Xp1, Xp2, …, Xpk] and RMD Rn×k denotes the correlation matrix assembled with the elements rij = ∑nm=1Xmi / ( ∑nm=1Xmi2 · ∑nm=1Xmi2 )1/2. As can be seen from Eq. (2), MD is a single measure of the distance in multidimensional spaces by taking correlations into account. In MTS, it is taken to measure the degree of abnormality of any candidate observation and therefore to detect the health condition of the bridge from which the candidate observation is measured. For a candidate observation yq = [yq1, yq2, …, yqk], probably measured from the intact or damaged bridge, with respect to the same k variables, its MD are calculated with the same correlation matrix RMD of MS as follows, 1 MD q Yq R -1MD YqT k
(3)
where Yq = [Yq1, Yq2, …, Yqk] with elements Yqi = (yqi-mi)/σi, i = 1~k, is the observation vector normalized with the mean and standard deviation of MS. Theoretically, the MDs corresponding to intact conditions are small while those from damage conditions are large. To make a quantitative decision on the health condition, a threshold is necessary. Herein, the threshold is determined by an objective way: the cross validation (Bishop 2006). Firstly we treat the 1st observation as candidate observation and take the normalized vectors of the rest n-1 observations as MS to calculate the MD of the 1st observation. Repeating the above step n times by treating each observation as candidate observation one by one yields n MDs. Then, we remove the largest and smallest MD values to reduce the effect of possible outliers and finally take the mean of the rest n-2 MDs as the threshold for future damage detection. It should be noted that the MTS adopted herein is not a full version, which includes also the identification of useful variables, following the above algorithm, with the aid of orthogonal arrays (OA) and signal-to-noise (S/N) ratios (Taguchi & Jugulum 2000). The identification of useful variables is excluded because every variable (assigned in following sections) is regarded so important that cannot be removed and therefore all the variables are taken to detect bridge damage.
580
Taking z-transform of Eq. (1) yields (e.g. Oppenheim et al. 1996)
4.2 Taking Dynamic Characteristics as MTS Variables Autoregressive (AR) model is adopted to fit the time series of the measured bridge acceleration responses and then to identify the dominant frequencies and corresponding damping ratios of the bridge. Its algorithm is briefly given as follows while available in details in many other existing works (Ljung 1999, Kim et al. 2012). Given a set of discrete time series y(k) of length N (k = 1, …, N), it can be regarded as the output generated from a AR linear dynamic system of order p as p
y(k) ai y ( k i ) e( k )
(4)
i 1
where ai is the i-th AR coefficient to be estimated and e(k) the noise term. Multiplying Eq. (4) by y(ks), s = 1, …, p, and taking expected value (denoted as E[.]) yields the Yule-Walker equation, which is expressed as
Ra r
(5)
where R is the Toeplitz autocorrelation matrix assembled with elements Rs,i = rs-i = E[y(k-s)y(k-i)] defined as the autocorrelation function of y(k); a = [a1, …, ap]T; r = [r1, …, rp]T. The AR coefficients ai’s can be solved by any effective solution technique involving a Toeplitz matrix, e.g. the LevinsonDurbin algorithm (Ljung 1999).
(a)
Y ( z) H ( z)E( z)
1 p
1 ai z
E( z) -i
(6)
i 1
where Y(z) and E(z) are z-transforms of y(k) and e(k), H(z) the transfer function of the system, and z-i the forward shift operator. The system’s characteristic equation is then obtained by letting the denominator of H(z) equal zero, i.e.
z p a1 z p 1 a2 z p 2 a p 1 z a p 0
(7)
The complex conjugate roots, zk and z*k‘s of Eq. (7) are the poles of the system, which has been proved to relate to the frequencies ωk’s and damping ratios hk’s of the system as (taking the k-th mode for example)
zk , zk* exp hkk jk 1 hk 2
(8)
where j is the imaginary unit. Not all the system frequencies and damping ratios thus calculated are related to true bridge structural modes. Some of them are related to other physical modes, such as vehicle dynamics, road surface roughness, measurement noises or so on, while some of them to non-physical modes that present only for better fitting the mathematical model to the measured time series. To identify bridge structural modes of our interest, certain subjective judgments are required. In this study, the judgment is made with the aid of (1) the singular value spectra yielded by performing frequency domain decomposition (FDD) (Brincker et al. 2000) and (2) the stability diagrams by performing multivariate AR analysis with respect to a wide range of orders (Allemang & Brown 2010). Following the above algorithm, two bridge structural modes are identified, one (designated as the 1st mode hereafter) with dominant frequency around 1.96 Hz and the other (designated as the 2nd mode hereafter) around 7.64 Hz. Let us firstly take the dominant frequencies of the above two modes as damage indicators and test if their statistical patterns are qualified to detect bridge damage. Taking the 1st dominant frequencies (f1) identified from sensor Group 1 as MTS variables and all 18 observations from intact bridge as reference group, one can calculate the MDs for every observation from the intact, damaged bridge and cross validation, as shown in Figure 5(a). Replacing f1 with the 2nd dominant frequencies (f2) and performing the same procedures, one can also obtain the MDs for every observation as shown in Figure 5(b). The damage detection criterion is quite simple: if the
(b) Figure 5. MDs calculated with dominant frequencies from Group 1 as variables: (a) 1st mode; (b) 2nd mode. (red line: threshold)
581
percentage of observations with crossing-threshold MDs (referred to as the crossing-threshold percentage hereafter) for the damage condition is larger than that for the cross validation, damage detection is successful, and vice versa. According to this criterion, damage detection is failed for f1, with a smaller crossing-threshold percentage (27%) for the damage condition than that (33%) for the cross validation; it is successful for f2, with the crossing-threshold percentage (47%) for the damage condition larger than that (33%) for the cross validation. Secondly, let us test if the statistical patterns of damping ratios of the above two modes are qualified to detect bridge damage. Taking the 1st (d1) and 2nd damping ratios (d2), respectively, from the sensor Group 1 as MTS variables, one can calculate the MDs for every observation, as shown in Figure 6(a) and (b). Observed from those figures, damage detection is successful for d1 (crossing threshold percentage: 60% for damage condition > 27% for cross validation) but failed for d2 (crossing threshold percentage: 20% for damage condition < 27% for cross validation). In summary, dominant frequencies and damping ratios seem not always sensitive to the artificial damage and therefore not reliable enough to be qualified damage indicators if without aid of other advanced technique.
4.3 Taking Nair’s Damage Sensitive Feature (NDSF) as MTS Variables NDSF is defined as (Nair et al. 2006) NDSF
a1 a a22 a32 2 1
(9)
It is simply a function of the first three AR coefficients. Nothing related to modal information is required and thus neither is subjective judgment, indicating that automatic calculations are possible. The only parameter has to be determined is the AR order. Several existing information criteria, e.g. the Akaike information criterion (AIC, Akaike 1974) adopted herein, can be used to non-subjectively determine an optimal order, with which the numerical model is best fitted to the measured data series while a certain large-order penalty is introduced, from a number of candidate orders. AIC is defined as AIC = -2(ML) + 2(NP), where ML denotes the maximum logarithm likelihood and NP the number of independently adjusted parameters within the model. The AR coefficients estimated with this optimal order (denoted as Mo) can thus be substituted into Eq. (9) to yield the NDSF value. The statistical patterns of NDSFs are tested to see if they are qualified to detect bridge damage. Taking NDSFs from sensor Group 1 as MTS variables, one can calculate the MDs for every observation from the intact, damaged bridge and cross validation, as shown in Figure 7. It is observed that all observations from the damage condition present a MD crossing the threshold, while only 38% of the observations from the cross validation do. The damage detection is successful. It can be said that NDSF is more sensitive to potential bridge damage than either dominant frequencies or damping ratios are (see Figures 5 & 6 also).
(a)
(b) Figure 6. MDs calculated with damping ratios from Group 1 as variables: (a) 1st mode; (b) 2nd mode. (--: threshold)
Figure 7. MDs calculated with NDSFs from Group1 as variables. (--: threshold)
582
Intact
Cross Validation
Damage
Damage
Figure 8. MDs calculated with NDSFs from Group 2 as variables (bottom) and crossing-threshold percentage (top). (--: threshold)
with denser sensor deployment coincides with our physical senses that the stresses drastically decreased only at the damaged member (see Figures 3 and 4) and thus two additional sensors installed close to the damaged member may provide more information about the damage. However, it is a rather unrealistic idea to predict the damage-suspected member and accordingly to install monitoring sensors around the suspected member. A following issue to be clarified would be the feasibility to localize damage if sensors are uniformly deployed at the nodal points instead of more densely near the damaged member. For this purpose, this study next examines the feasibility of damage localization considering Group 3, in which the two non-nodal sensors, No. 3 and 5, close to the damaged member, are excluded. The results are plotted in Figure 9. In comparison with Figure 8, it seems more difficult to localize the damage without considering sensors close to the damage because the sub-Groups BC and DE, closest to the damage, do not yield larger MDs than other subgroups do. However, it is still obvious that NDSF is still qualified to serve as an indicator for damage detection as it always yields larger MDs for observations from damage conditions than those from cross validations. 5 CONCLUDING REMARKS
Figure 9. MDs calculated with NDSFs from Group 3 as variables (bottom) and crossing-threshold percentage (top). (--: threshold)
The damage localization is also tested, firstly with sensor Group 2. Figure 8 shows the MDs calculated by taking NDSFs from Group 2 as MTS variables. In this figure, the crossing-threshold percentages are also presented. It seems that the observations from sub-Groups 2B, C and D, with denser sensors close to the damaged member, are easier to yield MDs that cross, even largely, the threshold. The successful bridge damage localization
This study investigated the practicability of a damage detection approach using vehicle-induced bridge vibrations to a real steel truss bridge. The bridge was applied an artificial damage, by severing a diagonal member. The stress redistribution induced by the damage was also presented. Obvious damage-induced stress redistribution was observed under both dead and live loads. Under dead loads, the largest stress change was observed at the damaged member, as expected, and the second largest change at adjacent vertical members. Under vehicle live loads, stress redistributions to other members implied that vehicle-induced bridge vibrations may carry information about damage, even though they were measured at members away from the damaged one. The damage was detected by examining if a set of candidate observations collected from an unknown condition follow the same pattern of a set of observations collected from the known intact (reference) condition. The pattern dissimilarity was evaluated by the Mahalanobis-Taguchi system (MTS), by taking damage indicators calculated for a certain sensor group as MTS variables. Three damage indicators calculated from the vehicle-induced bridge vibrations were tested: dominant frequency, damping ratio and Nair’s damage sensitive feature (NDSF). Among them, NDSF was more sensitive to the artificial damage than the other
583
two were, in providing more observations with a large Mahalanobis distance (MD) that crosses the pre-defined threshold. Damage localization was also feasible if sensors were densely deployed near the damaged member and adjacent sensors were grouped for MTS variables. Once the sensors were uniformly deployed, the damage localization was less successful, despite the damage-detection task remaining successful. It can be said that the present damage-detection and -localization approach is applicable to real truss bridges with structure type and damage scenario similar to those in this study. More comprehensive investigations are needed to verify its applicability to bridges with other structure types and damage scenarios. Moreover, it is important to clarify why the damage localization task were failed once the sensors were not densely deployed near the damaged member, motivating the ongoing study on the optimal number and deployment of monitoring sensors. ACKNOWLEDGEMENT This study is partly sponsored by JSPS, Grant-inAid for Scientific Research (B) under project No. 24360178. The second author, K.C. Chang, is sponsored by “The JSPS Postdoctoral Fellowship for Foreign Researchers” Program. Such financial aids are gratefully acknowledged. REFERENCE S Akaike, H. 1974. A new look at the statistical model identification. IEEE Transactions on Automatic Control 19(4): 716723. Allemang, R.J. & Brown, D.L. 2010. Chapter 21: Experimental modal analysis. In Piersol, A.G. & Paez, T.L. (ed.) Harris’ Shock and Vibration Handbook, 6th ed. New York: McGraw-Hill Companies, Inc. Bishop, C M. 2006. Pattern Recognition and Machine Learning, New York: Springer.
Brincker, R., Zhang, L. & Andersen, P. 2000. Modal identification from ambient responses using frequency domain decomposition. Proceedings of 18th International Modal Analysis Conference: 625-630. Chang, K.C., Kim, C.W. & Kawatani, M. 2013. Feasibility Investigation for Bridge Damage Identification through Moving Vehicle Laboratory Experiment. Structure and Infrastructure Engineering: accepted for publication (DOI:10.1080/15732479.2012.754773). Doebling, S.W., Farrar, C.R., Prime, M.B. & Shevitz, D.W. 1998. A review of damage identification methods that examine changes in dynamic properties. Shock and Vibration Digest 30(2): 91-105. Kim, C.W. & Kawatani, M. 2008. Pseudo-static approach for damage identification of bridges based on coupling vibration with a moving vehicle. Structure and Infrastructure Engineering 4(5): 371-379. Kim, C.W., Kawatani, M. & Hao, J. 2012. Model parameter identification of short span bridges under a moving vehicle by means of multivariate AR model. Structure and Infrastructure Engineering 8(5): 459-472. Kim, C.W., Isemoto, R., Sugiura, K., & Kawatani, M. 2013. Structural fault detection of bridges based on linear system parameter and MTS method. Journal of JSCE, JSCE 1: 3243. Ljung, L. 1999. System identification- Theory for the user, 2nd Ed. Upper Saddle River, N. J.: Prentice Hall PTR. Nair, K.K., Kiremidjian, A.S. & Law, K.H. 2006. Time seriesbased damage detection and localization algorithm with application to the ASCE benchmark structure. Journal of Sound and Vibration 291(1-2): 349-368. National Transportation Safety Board. 2008. Collapse of I35W Highway bridge, Minneapolis, Minnesota, August 1, 2007. Highway Accident Report NTSB/HAR-08/03. Washington, DC. Oppenheim, A.V., Willsky, A.S. & Nawab, S.H. 1996. Signals and Systems, 2nd Ed. Upper Saddle River, N. J.: Prentice Hall. Salawu, O.S. 1997. Detection of structural damage through changes in frequency: A review. Engineering Structures 19: 791-808. Taguchi, G. & Jugulum, R. 2000. New trends in multivariate diagnosis. Indian Journal of Statistics 62(B): 233-248.
584