At the time of developing the compact fluorescent lamp phosphors, they have been optimised to achieve good efficacy and high colour rendering index, and not ...
VISUAL COLOUR-RENDERING EXPERIMENTS N Sándor and J Schanda University of Veszprém, Hungary Lighting Res. & Technol. 38/3 225-239 2006 ABSTRACT The colour-rendering index was introduced at the time when the second-generation fluorescent lamps (deLuxe type) have been brought onto the market. At the time of developing the compact fluorescent lamp phosphors, they have been optimised to achieve good efficacy and high colour rendering index, and not good visual colour rendering. Today, a major technological breakthrough has led to a new generation of light sources based on LED technology. The emission spectra of these is different from that of fluorescent lamps, thus optimising these to achieve a high colour rendering index could again lead to differences between calculated and observed colour rendering. Before one can recommend a new mathematical model for calculating a colour-rendering index, one has to re-investigate the existing model and its usefulness. In the present work we describe a series of visual investigations of three groups of LEDs with different correlated colour temperature (2700 K, 4000 K and 6500 K) and evaluate their correlation with the current method of colour rendering index as well as with possible updates of the calculation method. Also the question of updating the test samples gets consideration. Visual experiments have shown that the CIE Test Method is not a good predictor of visual perception. A method based on calculating colour differences using the CIECAM02 (or CIECAM97sR) colour appearance model provides better correlation between visual and calculated colour rendering values. But to get to a proper colour rendering description the fundamental concept of determination has to be changed. Keywords: Colour rendering, colour space, colour appearance model, colour scaling, LED, CIECAM02.
INTRODUCTION LEDs get widespread use, not only as signal lights but for exterior and decorative lighting1,2 automotive lighting3 and start to penetrate into interior lighting4,5 as well. For all white-light applications an up-to-date mathematical model for calculating colour-rendering index, correlating well with visual experiments is needed. CIE introduced the current method for calculating a colour-rending index some thirty years ago6. During these thirty years several attempts have been made to update this publication and bring it in line with modern colorimetric practice (see e.g.7), but due to lack of the availability of convincing visual experimental data this has not taken place to date. Pilot experiments have shown that – in accordance with anecdotic earlier observations – the colour rendering index does not always describe visual colour rendering correctly, especially in case of White LEDs (see CIE TC 1-62 interim report8). The CIE definition of colour rendering is9: “Effect of an illuminant on the colour appearance of objects by conscious or subconscious comparison with their colour appearance under a reference illuminant” The CIE Test Method6 translates this definition into selecting as a reference illuminant a Planckradiator of the same correlated colour temperature (CCT) if the CCT of the test source is below 5000 K, and a phase of daylight of equal CCT if the CCT of the test source is above 5000 K. The next step is then to calculate the tristimulus values of selected Munsell test samples irradiated by both sources perform a von Kries chromatic adaptation transformation if the chromaticity of the two illuminants is different - and calculate the colour difference for each test sample irradiated by the two illuminants. All colorimetric calculations have to be performed in the U*, V*, W* colour space. The final step is to convert the colour differences to a colour rendering index scale and perform some averaging to get the general colour-rendering index Ra. Several attempts were made during the last decades to extend or update the present method (see 7,10 11 12 e.g. ), both by introducing new descriptors, such as a flattery index , a colour discrimination index ,
and by trying to introduce new basic calculation methods13,14. The general opinion of the lamp manufacturers was in all these cases that first one should re-check the present method using visual experiments. Based on above considerations we started a series of experiments to first check the present test method by performing the steps of the recommended method using visual colour difference evaluation, and comparing these visual data with the present calculation method and with some possible updates of it. A new calculation method should be suggested only if these experiments prove to be inadequate to describe colour rendering correctly.
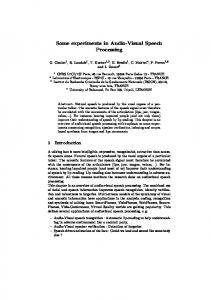
VISUAL EXPERIMENT Experimental method The CIE Test Method is a mathematical version of a direct comparison of samples illuminated by the test source and a reference source, and the determination of the colour difference observed for each sample illuminated by the two sources. A double booth was constructed, where in one of the compartments a reference lamp illuminated the samples, in the other compartment different test light sources could be installed. Figure 1 shows a photo of the experimental booth. Between the lamp-compartments and the test chambers an opal diffuser was placed, producing a homogeneous illumination at the bottom of the test chambers. The walls and bottom of both compartments were painted with a medium grey flat paint. Experiments were conducted at three CCTs, corresponding to Warm White, CoolWhite and Daylight lamp-colour. For each level of CCT we selected one lamp with good CIE colour rendering index as reference and the other lamps as test sources. The illumination level in the plane of the test samples in both chambers of the double booth was set in all three cases (low, medium and high CCT) to approximately the same value. It was about 250 lx at 2700 K CCT. This was the maximum value we could achieve with our LED cluster; other sources were dimmed to this value. Illuminance at the plane of the samples was between 350 lx and 400 lx for the different test sources at 4000 K and 6500K CCT. During its debates, CIE TC 1-33 came to the conclusion that instead of the original CIE Test Samples (taken from an early edition of the Munsell Atlas), samples of the Macbeth Colour Checker Chart (MCC)15 should be used. Two copies of the 24 sample edition of the MCC, placed in the two chambers of our visual observation booth were used in our experiments (see Figure 1). The task of the observer was to scale the visual colour difference between the corresponding chromatic samples of the MCCs. To aid the observer a grey scale was placed in the reference chamber, so that the observer could estimate the observed colour difference by comparing it to a given lightness difference of the grey scale. Observers were permitted to look into one or the other booth several times before they made their judgment. We tried to keep the chromaticity difference between the test and reference lamps low; so that the chromatic re-adaptation did not take a too long time.
Figure 1: Double booth for comparing the colour rendering properties of different light sources.
10 young university students took part in the experiment (6 male and 4 female students). All of them had good colour vision, tested by the FM 100 Hue test. They first participated in a training session where Munsell color chips of the same tristimulus values than the samples of the MCC were shown to them, together with chops from the Munsell Atlas differing from the target chip by plus or minus one step in hue, value and chroma. Subjects had to arrange properly the six samples around the target sample to understand the difference in the three directions in colour space around the test sample. Before starting the experiment observers were permitted to accommodate to the otherwise dark room, observing the test samples in one or the other booth for approximately five minutes. During this time they got an oral explanation of the experiment. In the experiment they compared one after the other the 18 chromatic samples of the MCC, taking notes of the estimated colour differences.
Objective measurements and colorimetric calculations Objective measurements were made with a Photo-Research 705 spectro-radiometer. The reference white was a PTFE reflectance standard. The spectral power distribution reflected from the MCC samples was measured under the same geometric conditions as measuring the white sample. For every light source a number of colorimetric calculations were performed: • Special (Ri) and the general colour rendering indices (Ra) were determined by using the CIE Test Method6 (using U*, V*, W* colour space and von Kries transformation). • Special and general colour rendering indices were determined using the above method, but using the 18 MCC chromatic test samples (Rci) as well as the 10 samples recommended by CIE TC 1337. We used the No. 2 sample of the MCC instead of the Caucasian complexion spectrum recommended by CIE TC 1-33, and as there is no Oriental complexion colour in the MCC we selected an-other often-occurring sample, blue sky, as the tenth sample for our calculations. • Colour differences were calculated by using the U*, V*, W* space (using a von Kries transformation to bridge the chromaticity difference between the test and reference sources), as well as CIELAB, CIECAM97sR colour differences (at 2700 K CCT, using Fairchild’s approximation of the CIECAM97s colour appearance formula) and CIECAM0216 formulas (at 4000 K and 6500 K CCT, with built-in chromatic adaptations and with the following viewing condition parameters: F=1.0 c=0.69 Nc=1.0). These colour differences were compared with the visually observed differences. Because of the long period of time of the whole experiment, parts of the experimental method subjects, calculation methods for evaluation - were not the same in the three parts of the series (at the three CCTs).
Experimental set-up at 2700 K CCT For the experiments at 2700 K CCT we selected an incandescent lamp as reference, and a tri-band fluorescent lamp of warm white colour and a cluster of red, green and blue emitting light emitting diodes (LEDs) set to the same CCT as that of the reference source, so that chromatic differences were minimal. Figure 2 shows the spectral power distribution (SPD) of the three sources used in the 2700 K experiment. Table 1 summarizes their colorimetric properties and their general colour rendering index value Ra.
1,2
relative spectral power distribution
1,0 0,8 0,6 0,4 0,2 0,0 380
430
480
530
580
630
680
730
780
w avelength (nm) Incandescent lamp
RGB LED
Tri-band f l. lamp
Figure 2: Spectral power distribution of the three sources investigated in the 2700 K experiment. Table 1: Colorimetric properties of the sources used, 2700 K group Lamp type – 2700 K
x
y
CCT, K
Ra
Incandescent lamp(reference)
0.4562
0.4140
2779
98,8
Tri-band fluorescent lamp
0.4559
0.4122
2780
74,6
LED cluster
0.4547
0.4134
2795
39,7
Experimental set-up at 4000 K CCT We had a group of 8 lamps with CCT near to 4000 K available: a special tungsten halogen lamp filtered to approximately 3720 K as reference, and as test lamps we selected a classical fluorescent lamp, three further narrow band fluorescent lamps and two Red-Green-Blue LED clusters and one * White LED . Figure 3a and Figure 3b show the spectral power distribution of the 4000 K set of lamps; see also Table 2 for colorimetric characteristics.
Table 2: Colorimetric data of test and reference sources, 4000 K group Lamp type – 4000 K
*
CCT
Ra
Tungsten Halogen (reference)
3719
94,2
De Luxe CoolWhite comp. fl. lamp
3614
93,2
White LED 1
3105
88,8
3-band Polylux XL fl. lamp
3841
84,2
CoolWhite comp. fl. lamp
3809
82,0
CoolWhite fl. lamp
4047
60,7
LED cluster 1
3719
41,5
LED cluster 2
3718
5,4
We distinguish between two types of LED lamps: if the light of a red, a green and a blue chip is mixed, we call it “LED cluster”, if the lamp consists a blue chip with yellow phosphor, we call it “White LED”.
1,2
Tungsten Halogen LED cluster 2
relative spectral power distribution
1,0
LED cluster 1 W hite LED 1
0,8 0,6 0,4 0,2 0,0 380
430
480
530
580
630
680
730
780
w avelength(nm)
3-band Polylux XL fl. lamp CoolW hite comp. fl. lamp De Luxe CoolW hite comp. fl. lamp CoolW hite fl. lamp
1,2
relative spectral power distribution
1,0 0,8 0,6 0,4 0,2 0,0 380
430
480
530
580
630
680
730
780
w a ve le ngth(nm)
Figure 3a, 3b: Spectral power distribution of the 4000 K lamps.
Experimental set-up at 6500 K CCT Sources (CCT near to 6500 K) have been selected for this part of the experiment: we had a high colour rendering fluorescent lamp as reference source and one daylight fluorescent lamp, two R-G-B LED clusters and a blue LED with yellow phosphor (White LED) as test lamps. Their colorimetric characteristics are seen in Table 3, their spectra are shown in Figure 4a and Figure 4b.
relative spectral power distribution
1,2
Toshiba D65 1,0
6500 K daylight comp. fl. lamp
0,8
0,6
0,4
0,2
0,0 380
430
480
530
580
630
680
730
780
w ave length(nm)
LED cluster 1
relative spectral power distribution
1,2
LED cluster 2 1,0
W hite LED 2 0,8
0,6
0,4
0,2
0,0 380
430
480
530
580
630
680
730
780
w a ve length(nm)
Figure 4a, 4b: Spectral power distribution of the 6500 K group of lamps. Table 3: Colorimetric data of test and reference sources, 6500 K group Lamp type – 6500 K
CCT
Ra
Toshiba D65 (reference)
5869
97,9
6500 K daylight comp. fl. lamp
6085
86,4
White LED 2
7076
80,8
LED cluster 1
5867
50,3
LED cluster 2
5867
11,9
Experimental results at 2700 K CCT We have set us the task to check whether the visually observed colour differences between the corresponding colours in the two booths correlate with one or the other colour difference formula. • If correlation with the U*, V*, W* colour difference is good, the current CIE Test Method can be recommended also for further use. • If one of the other colour differences correlates better with the visual observations, one should consider the use of the corresponding colour space for colour rendering evaluation. • If none of the formulae functions well, one should look for a different description of colour rendering.
The ten observers rated visually the colour difference of the 18 chromatic patches between the two MCCs (we have checked that the colorimetric differences between the two sets was negligible). Illuminating the patches with an incandescent lamp on one side, and with the tri-band fluorescent lamp or the LED cluster on the other side, they took notes on the visual colour differences. These were recorded and compared with the calculated colour differences, using the U*, V*, W* space as in CIE 13.3, CIELAB colour space and the space of the CIECAM97sR colour appearance model. The results of the ten observers have been averaged and in Figure 5 we plotted against the averaged visual observations the calculated colour differences, normalizing these to their average values to avoid artefacts due to scaling differences. It can be seen that the correlation between the visual observations and all three colour difference formulae is poor; although one has to state that the scatter of the visual data is relatively large. Table 4 shows the correlation coefficients of the six colour difference scenarios. None of the colorimetric formulae describes the visual colour differences well, but the colour difference constructed from the colour appearance model is better than the one presently used in the colour rendering calculations. Further problems with the present calculation method are revealed by comparing the visual evaluation data versus the colorimetric ones for the two tested sources: While the average visually observed colour difference is larger for the tri-band lamp than for the LED cluster, the colorimetric calculations provide a two to three times larger average colour difference for the LED cluster than for the tri-band fluorescent lamp. If one takes into account that the tri-band lamp is a lamp type developed after the introduction of the colour rendering test method, and has been optimised to provide good colour rendering indices, it is not surprising that many anecdotic remarks blame the accuracy of the present calculation method. 3,5 average STD = 0,35
colorimetric scalings
3,0
2,5
2,0
1,5
1,0
0,5
0,0 0,0
0,2
0,4
0,6
0,8
1,0
1,2
1,4
1,6
1,8
2,0
visual scaling
Figure 5: Averaged colorimetric colour differences using three colour difference formulae for the fluorescent lamp and the LED cluster taken against an incandescent lamp. : ∆Eab*, : ∆ECIECAM97sR*, U: ∆EU*V*W*; full signs: difference of tri-band lamp to incandescent lamp, open signs: difference of LEDs to incandescent lamp. Table 4: R2 correlation coefficients of the six colour difference scenarios: CIELAB, CIECAM97sR, CIE U*V*W* colour differences, incandescent lamp - fluorescent lamp/LED cluster
∆E*ab(Fl) ∆ECIECAM97sR(Fl) ∆EU*V* W*(Fl)∆E*ab(LED)∆ECIECAM97sR(LED)∆EU*V* W*(LED) 0,597
0,690
0,498
0,530
0,663
0,602
Experimental results at 4000 K and 6500 K CCT Similar experiments than at 2700 K were also conducted at 4000 K and 6500 K. First, we compared the visual and calculated colour differences. Table 5 and Table 6 show this for the 4000 K and the 6500 K groups, respectively, ordered according to increasing visual colour differences.
Table 5: Visual and calculated average colour differences, 4000 K lamp group 4000 K
Visual
CIE 13.3
CIECAM 02
3-band Polylux XL fl. lamp
0,49
4,43
4,87
CIELAB 5,38
De Luxe CoolWhite comp. fl. lamp
0,52
2,28
2,60
3,03 10,91
CoolWhite fl. lamp
0,66
12,89
10,08
CoolWhite comp. fl. lamp
0,71
5,03
5,58
6,37
LED cluster 1
0,85
18,46
13,71
14,35
LED cluster 2
1,65
32,61
23,90
25,43
Table 6: Visual and calculated average colour differences, 6500 K lamp group 6500 K
Visual
CIE 13.3
CIECAM02
6500 K daylight comp. fl. lamp
0,20
4,33
4,17
CIE-LAB 4,73
White LED 2
0,38
7,22
8,47
11,71
LED cluster 1
0,79
17,28
12,67
12,91
LED cluster 2
1,04
31,19
23,22
24,76
As can be seen, at the 4000 K group there are huge differences in ordering the lamps according to visual or calculated colour difference. The exceptionally good visual performance of the traditional CoolWhite lamp is hard to understand, one reason might be that most of the test samples contained only very little long wave radiation. It is also of interest that the small peak wavelength difference of the two LED clusters produced a large difference in Ra. The rank order for the 6500 K series is the same for all four methods of evaluation. As a next step we wanted to test which colour difference formula describes the observed colour difference best. We depicted for the single lamps and each test sample the calculated colour differences in relationship of the visual one. As an example Figure 6 shows this, together with the best fit linear regression lines for the CoolWhite fluorescent lamp, as this is a traditional fluorescent lamp from the times when the original colour rendering index was designed. CoolW hite fl. lamp calculated color difference
1,2 1,0 0,8 0,6 0,4 0,2 0,0 0,0
0,2
0,4
0,6
0,8
1,0
1,2
1,4
1,6
1,8
2,0
visual color difference CIE 13.3
CIELA B
CIECA M02
Regr. (CIE 13.3)
Regr. (CIELA B)
Regr. (CIECA M02)
Figure 6: Calculated colour differences versus observed ones for the Cool White Fluorescent lamp. As can be seen the trends are rather similar, therefore we tried to analyse the observed and calculated colour differences for the single samples. From the statistical analysis it turned out that the visual observations become increasingly uncertain as the colour rendering of the lamp becomes better. The reason may be that the observer is unable to scale very small colour differences accurately and consistently. Therefore here we will show only the results of the 4000 K and 6500 K fluorescent
lamps that showed larger colour differences and of the LED sources. The correlation between the observed and calculated colour differences for the three colour space models are seen in Table 7 and Table 8. In each case where the colour differences showed large values mostly by LED sources the CIECAM02 model worked best. Table 7: Correlation between the visually observed colour differences and the calculated ones for the 4000 K lamps with larger colour differences. Lamp type(4000 K)
Corr (U*,V*,W*)
Corr (CIECAM02)
Corr (CIELAB)
LED cluster 2
0,82
0,89
0,81
LED cluster 1
0,76
0,81
0,73
CoolWhite fl. lamp
0,68
0,72
0,50
White LED 1
-0,61
-0,47
-0,37
Table 8: Correlation between the visually observed colour differences and the calculated ones for the 6500 K LED clusters with larger colour differences. Lamp type(6500 K)
Corr(U*,V*,W*)
Corr(CIECAM-02)
Corr(CIE-LAB)
LED cluster 2
0,75
0,87
0,85
LED cluster 1
0,84
0,89
0,86
White LED 2
0,50
0,33
0,23
FURTHER INVESTIGATIONS Checking chromaticity distortions and changes in gamut area in a chromaticity diagram is a possibility to investigate colour rendering properties. We used this principle adapted to modern colour spaces for both our 4000 K and 6500 K CCT sources. Three groups of colour samples were used: 1. The first eight samples (TCS01-08) from the samples of the original CIE Test Method (TCS0114)6. These are moderate in saturation, and are approximately of the same lightness; will be called in the following “original”. 2. Ten samples recommended by the TC 1-33 (TCS01*-10*) instead of the CIE Munsell test samples, because the original ones did not cover the colour gamut sufficiently7; will be called in the following “selected”. 3. A real representation of the eight Macbeth Colour Checker Chart samples + TCS09* and TCS10* for the two skin tones; will be called in the following “real”. For the first two groups of samples we used the original, tabulated spectral radiance factor βi(λ) data and for the realization of the real MCC patches their measured values made by using a PR-705 spectro-radiometer. For the graphical representation we used only the first eight samples. For calculating the general colour rendering index we used the 8 samples in the first case, and the 8 MCC samples + 2 skin samples in the other two cases. In each case the size of the gamut area covered by the original Munsell samples is almost 3-4 times smaller than in case of the other group of samples, this is the consequence of the smaller chroma of the original Munsell samples. The first eight samples of group 3 should be nominally equal to those of group 2. We have found that the samples we have had showed a slightly smaller gamut area. This was probably due to the slight fading of the two-three years old samples, but this has negligible effect on our finding. Figure 7 shows the gamut area represented by each group in the a*,b* plane of CIELAB space for the reference source selected according to the CIE Test Method (line with full sign ) and illuminated by the real reference source used in our experiment (line with full sign U) at 4000 K level of CCT. It can be seen from the three diagrams that the and U lines overlap almost completely, which proves that our reference source renders colours almost exactly as the theoretical reference source of CIE 13.3, and that the difference between the “selected” and “real” samples can also be neglected. So in the future we only plot the gamut area with the original and real samples.
Original CIE samples
-60
-40
Selected MCC samples
Real MCC samples
100
100
100
80
80
80
60
60
60
40
40
40
20
20
20
0
0
-20 0 -20
20
40
60
80
-60
100
-40
-20 0 -20
-40
-40
-60
-60
CIE 13.3:
Tungs te n Haloge n
CIE 13.3:
20
40
60
80
100
-60
-40
0 -20 0 -20
20
40
60
80
100
-40 -60 CIE 13.3:
Tungs te n Haloge n
Tungs te n Haloge n
Figure 7: Gamut area for the 4000 K reference source in an a*, b* plane. Figure 8 shows the gamut area of the samples illuminated by the CoolWhite traditional fluorescent lamp and the reference source selected according to the CIE Test Method. Original CIE samples
-60
-40
Real MCC samples
100
100
80
80
60
60
40
40
20
20
0 -20 0 -20
20
40
60
80
100
-60
-40
0 -20 0 -20
20
40
60
80
100
-40
-40
-60
-60
CIE 13.3:
CoolW hite fl. lamp
CIE 13.3:
CoolWhite fl. lam p
Figure 8: Gamut area for the CoolWhite fl. lamp test source in an a*, b* plane. A noticeable lateral distortion on the left and right side (in the direction of green and red) can be seen, while the size of the gamut area of our test source decreased to 80% of the area of the related reference source. Figure 9 (LED cluster 2) shows an extremely big distortion in the direction of yellow and blue (in the opposite direction than for CoolWhite fl. lamp), while the size of the gamut area increases up to 120% of the gamut area of the related reference source. A similar distortion can be seen when one plots the colour co-ordinates of the samples illuminated by LED cluster 1 (Figure 10), however the distortion is not so spectacular, while the size of the plotted area is 27% larger than the area of the related reference source. The larger gamut means that these sources can render more colours, despite of the fact that their general colour rendering indexes are very low. Original CIE samples
Real MCC samples
100
100
80
80
60
60
40
40
20
20
0 -60
-40
-20 0 -20
20
40
60
80
100
20
40
60
80 100
-40
-40
-60
-60
CIE 13.3:
0 -80 -60 -40 -20 0 -20
LED cluster 2
CIE 13.3:
LED clus te r 2
Figure 9: Gamut area of the LED cluster 2 test source in a*, b* plane.
Original CIE samples
Real MCC samples
100
100
80
80
60
60
40
40
20
20
0 -60
-40
-20 0 -20
20
40
60
80
100
-60
-40
0 -20 0 -20
20
40
60
80
100
-40
-40
-60
-60
CIE 13.3:
CIE 13.3:
LED cluster 1
LED clus te r 1
Figure 10: Gamut area of the LED cluster 1 test source in a*, b* plane. The examined White LED 2 light source (a kind of new development) has a very impressive Ra value, and its gamut can be seen in Figure 11. Original CIE samples
Real MCC samples
100
100
80
80
60
60
40
40
20
20
0 -60
-40
-20 0 -20
20
40
60
80
-60
-40
0 -20 0 -20
20
40
60
80
100
-40
-40
-60
-60
CIE 13.3:
100
W hite LED 1
CIE 13.3:
White LED 1
Figure 11: Gamut area of the White LED 2 test source in a*, b* plane. We have calculated Ra values using the CIE 13.3 test method, but using the group of test samples as described at the beginning of this section under item 2 and 3. Table 9 contains all the Ra values of the light sources for each group of samples. For CIE 13.3 Test Method, Ra value was generated from the average of the colour rendering indices of the 8 colour samples, and for the other cases from the average of the colour rendering indices of the 8 MCC + 2 skin colour samples. Table 9: Ra values of the light sources for each group of samples at 4000 K CCT 4000 K Original Selected Real 88,5 88,9 Tungsten Halogen (reference) 94,2 93,2 87,3 88,0 De Luxe CoolWhite comp. fl. lamp 88,8 79,9 80,1 White LED 1 69,4 72,3 3-band Polylux XL fl. lamp 84,2 66,4 69,8 CoolWhite comp. fl. lamp 82,0 22,3 24,8 CoolWhite fl. lamp 60,6 -6,1 0,7 LED cluster 1 41,5 5,3 -73,1 -66,2 LED cluster 2 Table 10: Ra values of the light sources for each group of samples at 6500 K CCT 6500 K Original Selected Real 91,2 91,1 Toshiba D65 (reference) 88,3 76,5 77,0 6500 K daylight comp. fl. lamp 81,8 67,7 68,2 White LED 2 79,2 -1,7 4,6 LED cluster 1 52,3 13,1 -73,6 -66,8 LED cluster 2
Similar calculations were made for the 6500 K group of lamps. Table 10 shows similar general colour rendering indices for the 6500 K group as shown in Table 9 for the 4000 K group. In Figure 12 a*, b* colour coordinates of the different colour samples illuminated by 6500 K CCT lamps are plotted. As in the case at 4000 K CCT, our reference source has a very impressive fit with the related reference source, so it has very good colour rendering properties according to the presently used method, because the colour differences between the colour samples are just perceptible. The LED clusters show also in this case similar distortions of the colour sample chromaticities than seen in case of 4000 K. The very big chromaticity distortions produced by LED cluster 2 compared with illumination with the reference source is seen here too. We examined a 6500 K, commercially available “daylight” compact fluorescent lamp and it can be seen that the colour differences when samples are illuminated by the White LED 2 are noticeably bigger than those illuminated by the daylight compact fluorescent lamp, however the Ra values of both sources are almost the same. Original CIE samples
Real MCC samples
100
100
80
80
60
60
40
40
20
20
0 -60
-40
-20 0 -20
20
40
60
80
100
-60
-40
0 -20 0 -20
-40
-40
-60
-60
CIE 13.3:
Tos hiba D65
20
40
CIE 13.3:
60
80
100
Tos hiba D65
a.) Original CIE samples
Real MCC samples
100
100
80
80
60
60
40
40
20
20
0 -60
-40
-20 0 -20
20
40
60
80
100
-60
-40
0 -20 0 -20
-40
-40
-60
-60
CIE 13.3:
LED clus te r 1
20
CIE 13.3:
40
60
80
100
LED clus te r 1
b.) Original CIE samples
Real MCC samples
100
100
80
80
60
60
40
40
20
20
0 -60
-40
-20 0 -20
20
40
60
80
-40
-60
-40
0 -20 0 -20
20
40
60
80
100
-40
-60 CIE 13.3:
100
-60 LED clus te r 2
CIE 13.3:
LED clus te r 2
c.)
Original CIE samples
Real MCC samples
100
100
80
80
60
60
40
40
20
20
0 -60
-40
-20 0 -20
20
40
60
80
-60
100
-40
0 -20 0 -20
-40
-40
-60
-60
CIE 13.3:
White LED 2
20
40
CIE 13.3:
60
80
100
White LED 2
d.) Original CIE samples
Real MCC samples
100
100
80
80
60
60
40
40
20
20
0 -60
-40
-20 0 -20
20
40
60
80
100
-60
-40
0 -20 0 -20
-40
-40
-60
-60
CIE 13.3:
daylight com p. fl. lam p
CIE 13.3:
20
40
60
80
100
daylight com p. fl. lam p
e.) Figure 12: Colour coordinates plotted in a*,b* plane at 6500 K CCT: a.) Toshiba D65 reference source, b.) LED cluster 1, c.) LED cluster 2, d.) White LED 2, e.) Daylight compact fluorescent lamp.
DISCUSSION Figure 13 and Figure 14 represents the ranking order of the investigated lamps at 4000 K and 6500 K CCT against their Ra values calculated by the presently used CIE 13.3 Test Method, but using the three different groups of samples. It can be seen that the ranking order does not change using different colour sample sets. The plotted U and curves follow each other very closely, but this is not surprising due to the fact that the 3rd group is the real representation of the tabulated values of the 2nd group. 4000 K 120 100 80
CIE 13.3 Ra index
60 40 20 0 0
1
2
3
4
5
6
7
8
9
-20 -40 -60 -80 -100 Nr . of the Lights our ce
TCS01-08
TCS01*-10*
MCC(8+2)
Figure 13: Ranking order of the 4000 K CCT sources using different colour samples.
6500 K 100 80 60
CIE 13.3 Ra index
40 20 0 0
1
2
3
4
5
6
-20 -40 -60 -80 -100 Nr . of the Lights our ce
TCS01-08
TCS01*-10*
MCC(8+2)
Figure 14: Ranking order of the 6500 K CCT sources using different colour samples. The original Munsell samples provide higher Ra values (see also Table 9 and Table 10, except for our reference source at 6500 K CCT) the the other two groups of samples, the new samples are more saturated, and thus more selective. In our experiments we have not found so large differences as described in17, when changing from the printed MCC patches to laser printer or ink-jet printed metamers had an influence on the rank-order of some lamps using the traditional CRI calculation method. Table 11 and Table 12 summarize the size of the gamut area in pixels (P(Test),P(Ref)) represented by the three colour sample groups. P(Test) is the size of the gamut area for the test source, P(Ref) is the size of the gamut area for the reference source calculated according to the CIE Test Method. TCS01-08, TCS01*-08* and MCC 01-08 relate to the first eight colour samples of the “original”, “selected” and “real” colour sample groups, respectively. Table 11: Size of the gamut area for 4000 K sources 4000 K
TCS01-08 P(Test) P(Ref) 2453,5 2528,5 Tungsten Halogen (reference) 3-band Polylux XL fl. lamp 2630,3 2530,6 CoolWhite fl. lamp 2018,8 2531,4 LED cluster 2 3076,0 2528,4 LED cluster 1 3257,4 2528,4 White LED 1 2444,9 2488,8 CoolWhite comp. fl. lamp 2712,7 2530,2 De Luxe CoolWhite comp. fl. lamp 2603,8 2525,4
TCS01*-08* P(Test) P(Ref) 8234,6 8439,0 8369,5 8447,4 6737,4 8451,5 10084,9 8438,6 10784,1 8438,9 8302,9 8296,9 8625,2 8445,7 8402,9 8427,6
MCC 01-08 P(Test) P(Ref) 7612,5 7807,4 7698,3 7815,3 6226,9 7819,3 9311,8 7807,1 9825,7 7807,4 7614,2 7676,8 7940,1 7813,7 7785,5 7796,9
Table 12: Size of the gamut area for 6500 K sources 6500 K
TCS01-08 P(Test) P(Ref) 2486,5 2426,9 Toshiba D65 (reference) LED cluster 1 3185,4 2427,1 LED cluster 2 3126,9 2427,1 White LED 2 2121,4 2372,1 6500 K daylight comp. fl. lamp 2559,9 2416,7
TCS01*-08* P(Test) P(Ref) 8273,3 8223,2 10788,2 8223,7 10412,9 8223,6 7290,3 8029,5 8316,9 8186,5
MCC 01-08 P(Test) P(Ref) 7677,6 7606,4 9820,8 7606,8 9575,2 7606,8 6660,6 7430,1 7670,7 7573,0
A ranking order using these values gives a totally different order between lamps than the presently used CIE Test Method as seen in Table 13, where we compare the visual colour differences with the
Ra index of the 4000 K lamps calculated for the “real” samples and with the ratio between P(Test) and P(Ref). The correlation coefficient has a value of R2=0.85 between visual colour differences and the lamps’ Ra index at 4000 K, but P(Test)/P(Ref) do not correlate with Ra . Similar trend can be seen for the 6500 K group in Table 14. Table 13: Comparing the visual colour difference values with the Ra index of the lamps and the ratio between P(Test) and P(Ref) at 4000 K 4000 K Visual Ra P(Test) / P(Ref) 3-band Polylux XL fl. lamp 0,49 72,26 119,27% De Luxe CoolWhite comp. fl. lamp 0,52 87,99 98,50% CoolWhite fl. lamp 0,66 24,77 99,18% CoolWhite comp. fl. lamp 0,71 69,82 125,85% LED cluster 1 0,85 0,66 101,62% LED cluster 2 1,65 -66,15 99,85% Table 14: Comparing the visual colour difference values with the Ra index of the lamps and the ratio between P(Test) and P(Ref) at 6500 K 6500 K Visual Ra P(Test) / P(Ref) 6500 K daylight comp. fl. lamp 0,20 77,01 101,29% White LED 2 0,38 68,23 89,64% LED cluster 1 0,79 4,62 129,11% LED cluster 2 1,04 -66,76 125,88% It can be seen from the above investigation that colour rendering properties of a given light source can be divided into two major groups. First, if one defines colour rendering according to the CIE definition scaling and averaging colour differences between numbers of colour samples – one should use a CIECAM02 based colour appearance model to make ranking between different types of lamps, which correlates well with visual observations. But, if one considers colour rendering as the maximum realizable number of colours, one should use the size of the gamut area represented by the illuminated samples for ranking between sources.
CONCLUSIONS From the investigations we can conclude that the visual colour rendering is not well described by the CIE Test Method. As an interim solution one could recommend the use of the CIECAM02 model, or a CIECAM02 based colour difference formula18. But a more fundamental re-thinking of the concept of colour rendering seems to be appropriate19. All these might point into a direction that colour rendering calculation has to be based on a quite different evaluation of colour appearance, taking large colour difference, i.e. colour harmony and colour complementarity break into consideration.
REFERENCES 1
Tim Whitaker: LED design wins New York City streetlight competition. (December, 2004: archive) www.ledsmagazine.com
2
Cartier building gets LED holiday wrapping (and LED tiaras). (December, 2004: archive) www.ledsmagazine.com
3
Lumileds’ Luxeon LEDs Blaze New Trails with Audi A8 6.0, the First Production Vehicle with LED Daytime Running Lights. www.lumileds.com
4
Lumileds’ Luxeon low CCT and high CRI warm white solid-state light source. www.lumileds.com/products/
5
Lighting Research Center: LEDs for Aircraft Passenger Reading Lights. http://www.lrc.rpi.edu/programs/solidstate/completedProjects.asp
6
Commission Internationale de l’Eclairage: Method of measuring and specifying colour rendering properties of light sources. Publ. CIE 13.3-1995 (a verbatim re-publication of the 1974 2nd edition).
7
Commission Internationale de l’Eclairage: Colour rendering, TC 1-33 closing remarks. Publ. CIE 135/2 1999.
8
Bodrogi P (2003). CIE TC 1-62: Colour rendering of white LED light sources. Activity Report 2003. CIE TC 1-62.
9
Commission Internationale de l’Eclairage: International Lighting Vocabulary. Publ. CIE 17.4-1987.
10
Halstead M B: Colour rendering: past, present and future. Color 77, Troy, Adam Hilger, 97-127 1977.
11
Jerome C W: Flattery versus color rendition. J.IES, April, 208-211 1972.
12
Schanda J: Colour rendering and the impression of comfort with artificial illumination. Information Couleur, 3/2, 23-28, 1978.
13
Yaguchi H, Takahashi Y, Shioiri S: A proposal of color rendering index based on categorical color names. Internat. Lighting Congress, Istanbul 2001.
14
Masahura NAKAYAMA and Koichi IKEDA: Comparison of Perceived Colour Differences with Colorimetric Colour Differences in Uniform Colour Spaces and Colour Appearance Model, J. Light & Vis. Env. Vol.28, No.2, 2004
15
McCamy CS, Marcus H, Davidson JG: A color-rendition chart. Jr. Photographic Engng. 2/3, 95-99 1976.
16
Moroney N, Fairchild MD, Hunt RWG, Changjun L, Luo MR, Newman T (2003). The CIECAM02 color appearance model. Proc. IS&T/SID Tenth Color Imaging Conf. pp. 23-27.
17
Schanda J: The concept of colour rendering revisited, CIGV Conference, Poitiers 2002.
18
Li C, Luo MR, Cui GH (2003) Colour-Differences Evaluation Using Colour Appearance Models, 11th Color imaging Conference, Nov. 3-7 2003, SunBurst Resort, Scottsdale, Arizona, 2003.
19
Bodrogi P, Csuti P, Szabó F, Schanda J. Why does the CIE Colour Rendering Index fail for white RGB LED light sources? AIC Colour ‘05, May 8. - 13. 2005, Granada, Spain