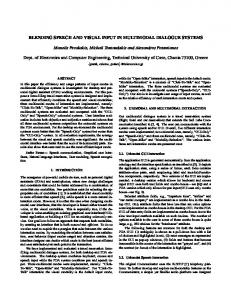
May 28, 1998 - The function and nature of inhibition of neurons in the visual ... and Off excitation, as intracortical blockade of g-aminobutyric acid. (GABA)A receptors results in loss of segregation of On and Off ... tinuously over the complete duration of the visual stimulation. e, Erev(t). f, Phase ... dendritic membrane19,20.
letters to nature 19. Barber, G. A. Observations on the mechanisms of the reversible epimerization of GDP-D-mannose to GDP-L-galactose by an enzyme from Chlorella pyrenidosa. J. Biol. Chem. 254, 7600–7603 (1979). 20. Barber, G. A. Synthesis of L-galactose by plant enzyme systems. Arch. Biochem. Biophys. 147, 619–623 (1971). 21. Feingold, D. S. in Encyclopedia of Plant Physiology, Vol. 13A (eds Loewus, F. A. & Tanner, W.) 3–76 (Springer, Berlin, 1982). 22. Roberts, R. M. & Harrer, E. Determination of L-galactose in polysaccharide material. Phytochemistry 12, 2679–2682 (1973). 23. Harris, G. C. et al. Mannose metabolism in corn and its impact on leaf metabolites, photosynthetic gas exchange, and chlorophyll fluorescence. Plant Physiol. 82, 1081–1089 (1986). 24. Conklin, P. L., Williams, E. H. & Last, R. L. Environmental stress sensitivity of an ascorbic aciddeficient Arabidopsis mutant. Proc. Natl Acad. Sci. USA 93, 9970–9974 (1996). 25. Conklin, P. L., Pallanca, J. E., Last, R. L. & Smirnoff, N. L-Ascorbic acid metabolism in the ascorbatedeficient Arabidopsis mutant vtc1. Plant Physiol. 115, 1277–1285 (1997). 26. Chen, Y-T., Isherwood, F. A. & Mapson, L. W. Quantitative estimation of ascorbic acid and related substances in biological extracts by separation on a paper chromatogram. Biochem. J. 55, 821–823 (1953). 27. Andrews, M. A. Capillary gas-chromatographic analysis of monosaccharides: improvements and comparisons using trifluoroacetylation and trimethylsilylation of sugar O-benzyl and O-methyl oximes. Carbohydrate Res. 194, 1–19 (1989). 28. Ghebragzabher, M., Ruffini, S., Monaldi, B. & Lato, M. Thin layer chromatography of monosaccharides. J. Chromatogr. 127, 133–162 (1976). 29. Dawson, R. M. C., Elliott, D. C., Elliott, W. H. & Jones, K. M. (eds) Data for Biochemical Research 2nd edn. (Clarendon, Oxford, 1969). Acknowledgements. The research was supported by a BBSRC studentship (G.L.W.), a Nuffield Student Bursary (M.A.J.) and Zeneca Agrochemicals. We thank Nippon-Roche for the gift of L-sorbosone. Earlier work by J. Pallanca, funded by the BBSRC BOMRIP programme, provided a basis for this research. We thank M. Raymond for technical assistance; J. Kingdon and J. Hindley for growing the plants; and W. Schuch for his support.
lapping in complex cells. We can consider how intracortical inhibition works during visual cortical processing at different levels. At the functional level, inhibition could help in the push–pull organization of opponent responses (for example, hyperpolarization is evoked by a decrease in light contrast in the On subfield) seen in simple receptive fields4. It could also control the spatial tuning of On and Off excitation, as intracortical blockade of g-aminobutyric acid (GABA)A receptors results in loss of segregation of On and Off excitatory responses in simple cells, whether measured extracellularly1 or intracellularly14. At the biophysical level, even if shunting inhibition does exist, there is still a quantitative issue concerning its functional importance. As the reversal potential for GABAA-mediated channels, which are probably responsible for the shunt in membrane conductance, is near the resting potential, shunting inhibition must produce a large change in the postsynaptic conductance to significantly counteract excitation. Simulations show that this shunt should be visible as a 100–200% increase in the somatic input conductance, Gin(t), relative to the no-stimulus condition (characterized as Grest)2,15. However, measurements from current clamp recordings have indicated limited conductance changes (relative
8
Correspondence and requests for materials should be addressed to N.S. (e-mail: N.Smirnoff@exeter. ac.uk).
Visual input evokes transient and strong shunting inhibition in visual cortical neurons Lyle J. Borg-Graham, Cyril Monier & Yves Fre´gnac Equipe Cognisciences, Institut Alfred Fessard, CNRS, Avenue de la Terrasse, 91198 Gif sur Yvette, France .........................................................................................................................
The function and nature of inhibition of neurons in the visual cortex have been the focus of both experimental and theoretical investigations1–7. There are two ways in which inhibition can suppress synaptic excitation2,8. In hyperpolarizing inhibition, negative and positive currents sum linearly to produce a net change in membrane potential. In contrast, shunting inhibition acts nonlinearly by causing an increase in membrane conductance; this divides the amplitude of the excitatory response. Visually evoked changes in membrane conductance have been reported to be nonsignificant or weak, supporting the hyperpolarization mode of inhibition3,9–12. Here we present a new approach to studying inhibition that is based on in vivo wholecell voltage clamping. This technique allows the continuous measurement of conductance dynamics during visual activation. We show, in neurons of cat primary visual cortex, that the response to optimally orientated flashed bars can increase the somatic input conductance to more than three times that of the resting state. The short latency of the visually evoked peak of conductance, and its apparent reversal potential suggest a dominant contribution from g-aminobutyric acid ((GABA)A) receptormediated synapses. We propose that nonlinear shunting inhibition may act during the initial stage of visual cortical processing, setting the balance between opponent ‘On’ and ‘Off ’ responses in different locations of the visual receptive field. In the visual cortex, there are two major types of receptive fields, ‘simple’ and ‘complex’, based partly on the degree of spatial overlap between On and Off responses (evoked by an increase or decrease in light contrast, respectively) in the visual field4,13. Simple receptive fields have distinct On and Off subfields, whereas these are overNATURE | VOL 393 | 28 MAY 1998
Figure 1 The visually evoked relative change in input conductance DGin(t) and its apparent reversal potential Erev(t) are derived from the current waveforms measured by two to four voltage-clamp protocols, illustrated here for the subthreshold response of an end-stopped simple cell to an Off transition of a flashing bar (full response is shown in Fig. 2e, cell 4, position 8). a, Voltage responses under current clamp and predicted Vˆm (arrow) from voltage-clamp currents, assuming a linear model. b, Responses under voltage clamp for four command holding potentials. c, I/V characteristics derived from linear regressions corresponding to the resting state (squares), the slope of which gives Grest, and during visual activation (circles) at the time T marked by a dotted line in (a–e), the slope of which gives Gin(T). The voltage axis, Vˆh, corresponds to the command holding potential corrected for Rs. The interpolated voltage at zero current of the I/V characteristic at any given time predicts the current clamp response (Vˆm(t) in c. The stability of the recording, and the justification of a linear approximation for this subthreshold example, are shown by the close match between the original and the interpolated traces superimposed in a. d, Relative DGin(t), derived continuously over the complete duration of the visual stimulation. e, Erev(t). f, Phase plot of relative DGin(t) versus Erev(t), where each point represents averages taken over 1 ms, illustrating the various trajectories in time (arrow for time T). In this case, the conductance response at time 0 is .105% of the input conductance at rest because the tail of the On response starts 1000 ms earlier. All responses in this paper are averages of 10 trials.
Nature © Macmillan Publishers Ltd 1998
369
letters to nature DGin(t) typically in the order of 5–20%) during optimal and nonoptimal visual activation3,8–11. We aimed to examine the balance between the excitation and inhibition underlying the spatial opponency of On and Off responses, and to identify the biophysical nature of the inhibition, using a new method for the continuous measurement of conductance dynamics. The standard approach to characterize Gin(t) (used in the visual cortex in vitro16,17 and in vivo9,12,18) is to measure voltage deflections in response to injected current pulses. A major constraint of this method is that although the rate of repetition of the pulses should be at least twice the highest frequency in the conductance signal, the pulse rate is limited by the resting time constant to account for the capacitive component of the input impedance. Voltage-dependent channels activated by the voltage change during a current pulse or by action potentials, and the electrical shunt introduced by sharp microelectrodes, also tend to underestimate the relative DGin(t). Another approach10 relies on measuring the amplitude of electrically evoked test excitatory postsynaptic potentials (EPSPs) during the visual response. However, as the peak of the EPSP is reached within a few milliseconds, its amplitude approaches that of the peak response to a current impulse delivered at the soma, in this case given by the ratio of the EPSP driving force and cell capacitance. Thus, this technique is an insensitive measure of DGin(t). a
To overcome these constraints, we derived the entire DGin(t) waveform from whole-cell, steady-state, voltage-clamp recordings. After characterization of receptive fields under current clamp (see, for example, Fig. 1a), we repeated the measurements of the response to the same visual stimulus under voltage clamp (continuous mode, no compensation for the access resistance, Rs) at two to four holding potentials, Vh (Fig. 1b). We then derived Gin(t), where time is referenced to the visual stimulus, from the slope of the linear regression (I/V characteristic) of the points given by the measured ˆ h, corrected for averaged current, Im(t), and the holding potential, V the drop across Rs ðVˆ h ðtÞ ¼ V h ðtÞ 2 Rs 3 I m ðtÞÞ (Fig. 1c). The relative DGin(t) was then taken as 100 3 ðGin ðtÞ 2 Grest Þ=Grest ð%Þ (Fig. 1d). As with any somatic-based impedance measurement, this method does not overcome the loss of visibility of dendritic inputs due to synaptic interactions or cable attenuation, or contamination by currents from poorly clamped voltage-dependent dendritic membrane19,20. Rather, the advantage of using the voltageclamp method is that distortion of synaptic events by transient voltage-dependent channels and capacitance near to the recording site are minimized. This method also allows the continuous estimation of the apparent somatic reversal potential of the visual response, Erev(t). This value is taken as the voltage of the intersection between the I/V characteristic at every time t and at rest (Fig. 1e) whenever the relative difference in their slopes (that is, relative DGin(t)) was
b
Cell 2, Position 5, ON
Figure 2 Response–plane receptive field maps based on spike activity (peri-stimulus histograms, PSTHs, left column), voltage (centre) and conductance (right) measurements. a, Time course of the voltage 6
10 mV 5
Voltage 50 ms
4
50 %
Cell 1 (S)
Conductance
c
10
periods of 1 s, in adjacent locations in the visual field,
10 9
8
spaced by 0.78 for cell 1, 0.58 for cell 2, and 18 for cells 3 and 4. For cell 4, a long bar stimulus was used to
8
7
7
emphasize the inhibitory response. PSTHs are shown
6
6
in the absence (b, d) or presence (c, e) of a constant
5
5
depolarizing current (100 pA in c, 300 pA in e). Grest and
4
4
3
3
Cell 2 (S)
2
2
Rs values were, respectively,17 nS and 60 MQ for cell 1, 40 nS and 25 MQ for cell 2, 15 nS and 20 MQ for cell 3,
1
1
and 29 nS and 15 MQ for cell 4. Horizontal scale, 500 ms; vertical scales, 25 action potential per
10
10 9
9 8
second for the PSTHs, 10 mV for the voltage traces, and 50% for relative DGin(t).
8
7
7
6
6 5
5
4
4
3
3
Cell 3 (C)
2
2
1
1
e
10
10 9
9 8
8
7
7
6
6
5
5
4
4
3
3
Cell 4 (SH)
2
2
1
1
25 Hz
10 mV 500 ms
Spike 370
b, c) one complex cell (cell 3, d) and one end-stopped bars flashed On and Off during two consecutive
9
d
dominant On response of cell 2 in position 5. b–e,
simple cell (cell 4, e). Stimuli are optimally oriented light
1 50 ms
current) and of the conductance observed for the Response–plane maps for two simple cells (cells 1, 2,
3 2
responses (top, 100 pA and bottom, 0 pA injected
500 ms
Voltage
50 % 500 ms
Conductance Nature © Macmillan Publishers Ltd 1998
NATURE | VOL 393 | 28 MAY 1998
8
letters to nature .5%. This criterion allows a precise determination of the intersection point of the two characteristics. Assuming that the change in the visually evoked somatic conductance reflects the composite synaptic input reaching the soma, Erev(t) characterizes the balance between excitation and inhibition over time. Finally, to indicate more clearly the type of synaptic input underlying the conductance changes, we constructed phase plots of the relative DGin(t) against Erev(t) (Fig. 1f). The recordings from seven cells, from a total population of 109 cells first characterized in current clamp (see Methods), were stable enough in terms of Rs and visual responsiveness to allow reliable measurement of both visually evoked voltages and synaptic currents in receptive fields (response-plane maps21). Previous studies of On/Off opponency have concluded, on a qualitative basis, that the dominant and opponent responses in simple cells result from pure excitation and from pure subtractive inhibition, respectively4,9,22,23. However, comparison of the temporal profiles of the post-stimulus time histograms (PSTHs), and the averaged evoked synaptic potential under current clamp, shows that both types of response in simple cells (Fig. 2b, c) may include composite excitatory/inhibitory input (for example, in Fig. 2c the dominant response in cell 2 position 5, and in Fig. 2b the opponent responses in cell 1, positions 5 and 6). a 250 250 200 200
∆G(%)
150 150 100 100 50 50 0
0 -
–100
-–80
-–60
-–40
00
-–20 Erev (mV)
b 250 250 200 200
∆G(%)
150 150 100 100
5050 00 0
0
200 200
400 400
600 600
800 800
1,000 1000
Latency (ms)
c
00 Erev (mV)
-
-
–20 –40
-
–60
-
–80 –100
0
0
200 200
400 400
600 600
800 800
1,000 1000
Latency (ms) Figure 3 Relationships between amplitude, latency and apparent reversal potential of the maximum values of relative DGin(t). Each point in the graphs corresponds to one stimulus condition (On or Off light or dark bar flashed at a given position). Results from seven cells (11 protocols) for all tested positions have been pooled. The responses with the maximum value of the relative DGin(t) for each cell are marked by open circles. Black and blue symbols refer to simple and complex cells, respectively. a, Maximal DG versus Erev. b, Maximal DG versus latency. c, Erev versus latency. NATURE | VOL 393 | 28 MAY 1998
The conductance profiles derived from the voltage-clamp measurements show that, for a given position in the receptive field, On and Off stimuli trigger a similar transient increase of Gin(t) (Fig. 2). The average value for the largest relative conductance increases seen in each cell was 113% (s:d: ¼ 58%, n ¼ 7; see Fig. 3). In general, the maximum and global shape of the DGin(t) waveform did not parallel the overall spike output or the waveform of the voltage record (see, for example, positions 5–6 for cell 1 in Fig. 2b, and positions 5–7 for cell 2 in Fig. 2c). Detailed examination shows that the rising phase and maximum of the conductance peaks are associated with an absence of spikes for both dominant and opponent responses, even when applying a depolarizing current to increase the cell’s responsiveness (Fig. 2a, inset), indicating a transient early suppressive effect. The largest peaks (138% 6 69%, n ¼ 4) were observed for three simple cells and one end-stopped simple cell (Figs 2b, c, e and 4). Three complex cells showed smaller but still significant conductance transients (80% 6 29%, n ¼ 3; Figs 2d and 4). Phase plots for relative DGin(t) versus Erev(t) indicate a prototypical bounded region for the synaptic dynamics that is independent both of the resting potential of the cell and of its functional type (Fig. 4). The extrapolated Erev peak values of all state trajectories converge near −60 to −70 mV. The averaged value of the actual peaks established for all seven cells ( 2 63:3 mV 6 5:5 mV), when compared to the reversal potentials of the major classes of currents gated by excitatory and inhibitory transmitters, concurs with the GABAA reversal potential measured in vitro with identical patch pipette solutions ( 2 64 6 9 mV) (ref. 24). The main difference in the trajectories associated with specific On or Off responses is that, typically, more positive potentials were produced when the preferred stimulus was present (for example, the On response in position 6 for cell 1 and position 7 for cell 3; see Fig. 4), and more negative potentials were produced in response to both preferred and opponent stimuli (for example, cell 4 in Fig. 4e), indicating GABAB receptor activation16. The trajectories often reached Erev values beyond those expected for either GABAB (less than −90 mV) or a-amino-3-hydroxy-5-methyl-4-isoxazole propionic acid (AMPA) (.0 mV), which can be accounted for by voltage escape of distal inputs20. The early onset of the larger conductance peaks, occurring sometimes as early as 50–70 ms after stimulation (Fig. 3b), further supports the conclusion that these responses are dominated by GABAA rather than GABAB activation (GABAB activation occurs after longer latencies16). In some cases, early excitatory input is subsequently shunted by the large inhibitory input, with Erev moving rapidly to a value close to the GABAA reversal potential (Fig. 4a, chronogram inset). The consistent shape of the phase plots has two possible interpretations, not mutually exclusive. First, shunting inhibition is the largest component of synaptic activation that reaches the soma. Second, the shape of the peak may be constrained by the relative visibility at the soma of proximal GABAA inputs compared with more distal excitatory (and perhaps GABAB) inputs15,25. These findings are consistent with the two following observations. First, synaptic excitation and inhibition seem to overlap strongly during visual activation5,26 as is the case when synaptic activation is produced by electrical activation of thalamic or intracortical axons in vitro16 and in vivo18. Second, both electrical stimulation of intracortical pathways and iontophoretically applied GABA evoke a significant conductance increase in vitro as well as in vivo14,16,18, contradicting the suggestion that, whatever the mode of activation, the effects of inhibition in vivo should differ from those obtained in vitro17. These results argue against an extreme schematization of the synaptic basis for the spatial discreteness of On and Off subfields and opponency of their On and Off spike responses, according to which each subfield in simple cells is constructed exclusively from either On excitation only and Off inhibition only in On regions, or
Nature © Macmillan Publishers Ltd 1998
8
371
letters to nature a
Cell 2, Position 5, ON
Figure 4 Phase plots of relative DGin(t) versus Erev(t) for positions in the receptive
b
fields (indicated in corner of each graph) eliciting the largest conductance or
100 80
5
180 ms
6
spike responses. a, The chronogram corresponds to the first 300 ms of the dominant response (0 nA) detailed in Fig. 2a. b–e, Plots correspond to the same
60 Cell 1 (S)
40 300 ms
20 60 ms
0 –80 –60 –40 –20
c
0
* 6
*
d
3
*
e
potentials (−76 mV for cell 1, −74 mV for cell 2, −68 mV for cell 3 and −80 mV for cell
*
5
*
7
5
5
4). Black and red dots correspond to the On and Off responses, respectively. Cell 2 (S)
*
*
250
cells shown in Fig. 2b–e. Asterisks under the plots indicate the cells’ resting
7
Cell 3 (C)
* 6
8
∆G(%)
200 150 Cell 4 (SH) 100 50 0 * –150 –100 –50
0
50
*
*
Erev (mV)
vice versa4,13. Rather, the profiles of Erev(t) for dominant and opponent responses, and the study of synaptic responses under bicuculline application14, indicate that both On and Off responses normally combine excitatory and inhibitory inputs. We propose that excitatory and inhibitory synaptic inputs interact to shape the response for each On or Off transition of the stimulus by controlling the global gain of the cortical spiking response. A strongly shunting GABAA input would be decisive during an early, nonlinear step of processing, allowing the dynamic emergence of the On/Off opponency expressed by small networks of reciprocally connected simple cells. If this shunting priming signal is weak, these circuits would then operate in a complex-like mode that lacks this form of M functional selectivity. .........................................................................................................................
Methods
We recorded cells in the primary visual cortex of anaesthetized (Althesin), paralysed kittens and adult cats as described26,27. For data-processing and visual-stimulation protocols we used in-house software. Patch electrode (3– 5 MQ) solutions contained 140 mM K-gluconate, 10 mM HEPES, 4 mM ATP, 2 mM MgCl2, 0.4 mM GTP and 0.5 mM EGTA (KOH), with pH adjusted to 7.3 and the osmolarity adjusted to 285 mosM. We obtained whole-cell patch recordings (Axoclamp 2A amplifier) to depths